Distributive
effects
of
new
highway
infrastructure
in
the
Netherlands:
the
role
of
network
effects
and
spatial
spillovers
Ana
Condeço-Melhorado,
Taede
Tillema
,
Tom
de
Jong
,
Rogier
Koopal
Network effects and spatial spillovers are intrinsic impacts of transport infrastructure. Network effects imply that an improvementinaparticularlinkinanetworkgenerateseffectsinmanyotherelementsofthatnetwork,whilespillovereffects canbedefinedasthoseimpactsoccurringbeyondtheregionswheretheactualtransportinvestmentismade.Thesetworelated effectsentailaredistributionofimpactsamongregions,andtheiromissionfromroadplanningisarguedtocausethesystematic under-estimationoftheprofitabilityoftransportprojectsandthereforethepublicfinancingtheyrequire.How-ever,traditional transportappraisalmethodologiesfailtoconsidernetworkandspillovereffects.Inthisstudywefocusonthespilloverimpacts oftwohighwaysectionsplannedinthecityregionofEindhoven,locatedintheDutchprovinceofNoord-Brabant,aregionwith trafficcongestionproblems.Thenewroadinfrastructurewillbefinancedmainlybynationalgovernment,theprovinceandthe urban region of Eindhoven(‘Stadsregio Eindhoven’), which consists of 21 municipalities. We measurethe benefitsof the additionallinksintermsoftraveltimesavingsandtheaccompanyingmonetarygains.Theresultsshowthatimportantspillovers occurinthosemunicipalitiesclosetothenewlinks.TheprovinceofNoord-Brabantwill benefitthemost.Wealso found importantspilloversintheprovinceofLimburg.Thislatterprovincewillbenefitfromreducedtraveltimeswithoutcontributing financiallytotheestablishmentoftheanalysednewroadlinks.
1. Introduction
Improvements in transport infrastructure are crucial in global-ized economies, where flows of people, goods and information are key aspects to a country’s competitiveness. The construction or upgrading of transport infrastructure cuts effective distance
through travel time gains (Lakshmanan, 2011; Vickerman et al.,
1999). For firms, the reduction of transport costs can extend
mar-kets and lead to economies of scale and specialization benefits (Forslund and Johansson, 1995). This has direct implications for overall operational costs but may also have indirect benefits with
regard to, for instance, the storage of goods (Vickerman et al.,
1999). Moreover, changes to regional competitive advantage due
to transport infrastructure can result in firms formation and relo-cating in more accessible territories where they can benefit from
the advantages of spatial concentration and from proximity to
innovation and knowledge (Holl, 2004, 2012; Melo et al., 2010).
In addition, infrastructure investments can imply that people can move more rapidly, efficiently and using fewer economic re-sources, which increases the flow of people and goods. For workers, travel time savings can be translated into an increase in social and leisure activities or can lead to additional work-related opportuni-ties. Travel time reliability can also increase, which is important in the context of the increasing role of just-in-time delivery and out-sourcing processes in global markets but also from the viewpoint of passenger transport.
When evaluating the effects of transport infrastructure, it is important to consider the wider network effects and spillover
ef-fects. Network effects (Laird et al., 2005) imply that the
improve-ment in a particular link in a network generates effects in other elements of that network. The network effect is intrinsically related to spillover effects, which we define here as those changes in travel times that occur beyond the regions where new transport invest-ments are made. These effects represent a kind of distributive effect because they concern the redistribution of impacts among regions, something not usually included in transport appraisal. When an 1 The views expressed are purely those of the writer and may not in any
investment is made to improve the transport infrastructure of a re-gion, its benefits are spread to many other regions. Traditional methods such as Cost Benefit Analysis (CBA), despite being sound evaluation procedure in the public sector, have several limitations (Beuthe et al., 2000; Button, 1993; Vreeker et al., 2002) and rarely deal with the spatial redistribution of generated effects. Spillover analysis can offer some insights into the distribution of impacts across regions and can determine which regions benefit most from a transport project. Such insights can also be of interest from a funding perspective. In the Netherlands, as in many other countries, there has been a strong trend towards transferring certain respon-sibilities to more decentralized public institutions such as regions and municipalities. This also occurs within the field of major road infrastructure planning, where provinces and municipalities have gained in importance within the highway planning process along-side national government. Where they specifically focus on the integration of land-use and infrastructure developments, national government remains the main responsible agency from a transport network perspective. These greater local responsibilities may also result in greater financial contributions. Spillover effects could help us to understand how project costs could be distributed fairly according to accessibility gains.
In this paper we focus on studying the spillover impacts of two highway sections planned in the urban region of Eindhoven, in the southern Netherlands. This region has significant traffic congestion problems, which are expected to increase in the near future if no investments in road infrastructure are made. The benefits of the additional links will be measured in terms of travel time savings and the accompanying monetary gains, with a particular look at spillover effects. Previous studies have measured the spillovers of new transport infrastructure using accessibility measures
(poten-tial accessibility: seeCondeço-Melhorado et al., 2011; Gutiérrez
et al., 2010; López et al., 2009), but to our knowledge, this is the first time spillovers have been validated with actual mobility data. By weighting spillovers with traffic intensities it is possible to determine their true importance in terms of potential user benefit. Other novel aspects of this study are the monetization of spillovers according to traffic intensities and the value of travel time, and the use of spillovers as a possible indicator for determining how pro-ject costs could be distributed amongst different stakeholders.
The outline of this paper is as follows: Section2introduces the
theoretical background of this study and is subdivided into two
subsections. Section2.1provides insight into road infrastructure
planning in the Netherlands, with a specific focus on financing
responsibilities. Section2.2is an overview of the spillover concept
used in this study and the importance of considering these effects
in transport infrastructure appraisal. Section3considers the
mea-surement of spillovers in transport infrastructure and is subdivided in two subsections, where 3.1 presents the case study and 3.2
de-fines the methodological steps. Section4presents impacts of the
new road planned for the city region of Eindhoven, both in terms
of travel time impacts (Section4.1) and monetary and mobility
im-pacts (Section4.2). Finally, Section5presents our discussion and
conclusions.
2. Who finances roads and who benefits?
2.1. Road infrastructure planning and financing in the Netherlands
In the Netherlands, national government plays an important role in the planning process for highway development. However, traditional approaches to major road infrastructure planning are changing towards the increased involvement and participation of regional and local public institutions in the planning process. This is part of a wider trend towards so-called area-oriented planning,
which integrates transportation objectives with further develop-ments in a specific area, with the objective of improving
sustain-ability by means of area-specific plans (Heeres et al., 2012). A
more effective and efficient planning process could emerge through broader and earlier involvement of different but comple-mentary – rather than conflicting – actor interests into the plan-ning process. The road remains central to the planplan-ning process but additional developments are induced by these transport
infra-structure developments (Arts and De Vaan, 2010). The idea behind
closer cooperation with decentralized public agencies is that they have more expertise in the local context, know more about land-use opportunities and have greater options in land-land-use control. In practice, area-oriented planning often implies that national gov-ernment remains involved in infrastructural projects, but that provinces and municipalities become more important and focus on the integration of land-use and infrastructure developments. The national government, on the other hand, mainly focuses on its responsibility for the main Dutch infrastructure network, to which individual highway projects belong.
Stronger regional and local responsibilities might translate into greater financial contributions yet regional and local budgets are often limited. However, with increased attention for area-oriented infrastructure planning, also financial contributions by decentral governments may increase. In addition to more common local and regional tax revenues, value capture mechanisms may be used to recoup and reinvest potential value increments (e.g., land values or house prices) caused by improved accessibility as a consequence of new or adjusted road infrastructure. Local and regional govern-ments may use such money primarily to invest in the area around road infrastructure, for instance, to improve sustainability. They may, however, also use value increments to reinvest in road infra-structure itself such as to improve the business case of projects. Although Dutch examples of value capturing mechanisms in inte-grated highway and spatial development projects were recently
described (seeHeeres et al., 2013), the relevance of financial
con-tributions by decentral governments may be even higher in coun-tries where local municipalities and regions have greater responsibility and resources when it comes to road infrastructure development. In the light of the discussion, and, in addition to fac-tors, such as formal responsibilities and the weight of regions and municipalities in terms of geographical and population size, we be-lieve that spillover effects of new road infrastructure developments may provide an interesting additional perspective for looking at how projects costs could be distributed. Municipalities and regions that gain more from a new road in terms of travel time gains could,
for instance,ceteris paribus, be asked to contribute more.
2.2. Accessibility and spillover effects
Traditionally, spillover effects have been measured by economic
procedures motivated byAschauer’s study (1989a,b), which found
a positive and significant influence of public capital stock, specifi-cally that devoted to transport infrastructure, over regional pro-ductivity. Since then, transport infrastructure is thus regarded as an additional factor that can be used by firms to increase their
pro-ductivity. Some studies (Cohen, 2010; Cantos et al., 2005; Delgado
and Álvarez, 2007; García-Milá and McGuire, 1992) show evidence of spillover effects, defined as the positive effect of transport infra-structure that extends beyond the regional boundaries of where they are located.
of that region but also from that of adjacent regions. They use a vicinity criterion, which considers that spillovers generated by transport infrastructure in neighbouring regions will be more in-tense. However, this assumption has certain limitations, most of
which are pointed out inGutiérrez et al. (2010). The vicinity
crite-rion implies that the same weight is attributed to infrastructure lo-cated in all adjacent regions, yet they will have different roles depending on the direction and intensity of traffic flows. It may happen that some neighbouring regions are very important for cross-traffic flows while other regions are barely used for this pur-pose. The assignment of flows in a network cannot be captured by stock measures. Furthermore, the vicinity criterion only takes ac-count of transport infrastructures located in adjacent regions which can lead to the overestimation of certain neighbouring infrastructure and underestimation of the infrastructure of non-adjacent regions. On the other hand the public capital stock vari-able is often criticized since it not a measure of service provided by (public) transport infrastructure but is mainly a construction cost measure. Instead, some authors recommend the use of
acces-sibility measures (Bruinsma and Rietveld, 1997; Rietveld and
Nijk-amp, 1993) arguing that these measures better represent the increased utility of transport infrastructure, such as more available opportunities.
As stated previously, the fact that spillovers depend on infra-structure characteristics is often not taken into account. When looking at road infrastructure it is clear that some roads are only used for internal traffic within a region – urban and local roads – whereas others have a crucial role in interregional flows, such as highways. Though public capital stock measures fail to capture pects related to the performance of transport networks, these as-pects can, however, be measured by network analysis and accessibility indicators. In this study we believe that accessibility measures are appropriate for measuring spillover effects of trans-port infrastructure. Despite being a common term, the accessibility concept has many definitions and many ways of measuring it (see
for exampleGeurs and Ritsema van Eck, 2001; Geurs and Van Wee,
2004). In this study, we follow the accessibility concept proposed
byMorris et al. (1979), who defines accessibility as the ease with which activities can be reached from a certain place using a certain type of transport system.
Accessibility improvement is a direct consequence of transport upgrades and can thus be considered a main ‘product’ of
transpor-tation systems (Schürmann et al., 1997). The construction of
trans-port infrastructure immediately impacts on an area’s accessibility conditions, reducing transport costs and increasing the regional advantages of that place. For that reason accessibility is an impor-tant variable for economic development as regions benefiting from high accessibility are usually richer and their inhabitants benefit from the proximity to the economic opportunities they need in their daily activities.
Improvements in transport infrastructure will impact
accessi-bility in a wider transport network (Laird et al., 2005): the addition
or improvement of a single link can significantly affect the demand and the performance of the whole network. The extent with which changes occur in the entire network is known as the network effect and spillovers are a consequence of these network effects. With
some exceptions (Gutiérrez et al., 2010; López et al., 2009),
spill-over effects are not included in transport assessment studies, although exclusion of these effects can be argued as resulting in the profitability of transport projects and therefore the public financing they require, being systematically underestimated.
On the other hand accessibility analyses are not fully exploited
in policy evaluation (Geurs and Ritsema van Eck, 2003; Handy and
Niemeier, 1997). Some of the main reasons for this are the risk of
double counting of effects (Beuthe, 2002) and the complexity of
some accessibility measures, which complicate the subsequent
interpretation of results. Nevertheless, the inclusion of (good) accessibility as a political priority is gaining greater importance across developed countries. In the UK for example, accessibility is one of the five assessment criteria of the ‘New approach to
apprai-sal’ (NATA) (DETR, 1998).2Accessibility and reliability are also key
concepts in current Dutch policy (‘Nota Mobiliteit’;Dutch Ministry
of Transport, Public Works and Water Management, 2005;
‘Struct-uurvisie Infrastructuur en Ruimte’;Dutch Ministry of Infrastructure
and the Environment, 2012). Furthermore, accessibility is considered vital at the EU level, as can be derived from the TEN-T policy, which is an important tool in connecting central and peripheral regions in Europe and towards achieving territorial and economic cohesion (COM, 2009).
In this study we look at spillover effects from the viewpoint of accessibility. Accessibility analysis can be used to estimate net-work effects as well as spillover effects defined here as the acces-sibility changes due to transport infrastructure developed in a different region. We added the adjective ‘‘spatial’’ in order to dis-tinguish our approach to spillover effects assessed with traditional econometric models. With accessibility analysis we can overcome some of the drawbacks pointed out previously by capturing net-work effects of transport infrastructure and by including all the re-gions in the study area (not only the neighbouring ones).
3. Measurement of spatial spillovers of roads in Eindhoven 3.1. Case study
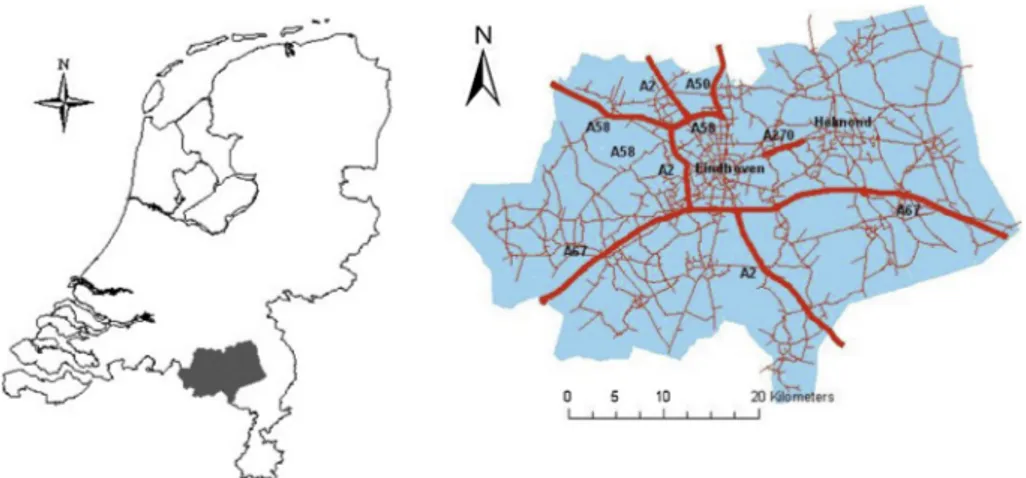
3.1.1. Description of the case study area: the current situation Our case study area is part of the Dutch province of
Noord-Brabant in the south-eastern Netherlands (seeFig. 1), one of the
twelve provinces of the Netherlands. This area is referred to as Zuid-Oostvleugel BrabantStad (‘BrabantCity South-eastern Wing’) or as Brainport Eindhoven, and is known as the Netherlands’
high-tech industry heartland (seeFig. 1). It consists of 21
munici-palities represented by an inter-municipal cooperation board (the
so-calledSRE; ‘cooperation region Eindhoven’). Two major cities
are located within the boundaries of the area. The bigger of the two is Eindhoven, with about 217,000 inhabitants, the smaller is
Helmond, with a population of about 89,000 (seeCBS Statistics
Netherlands, 2012).
Currently, several motorways cross the area, all converging in
Eindhoven (seeFig. 1). The motorways in the area are notorious
for their traffic jams: as a consequence, there are long-lasting accessibility problems. Because Eindhoven has no eastern ring road, accessibility in the region is vulnerable to incidents that can hinder traffic flow on the western ring road, i.e. the A2.
3.1.2. Plans for the near future: towards an area-oriented approach After a long lasting and great deal of discussion on the need to improve accessibility, especially by means of a north–south con-nection in eastern Eindhoven, in 2006, the provincial government of Noord-Brabant enforced a regional approach with a broad, area-oriented plan with traffic, spatial planning and economic is-sues as its starting point: ‘‘The Zuidoostvleugel development
pro-gramme’’. This programme (seeDutch Ministry of Infrastructure
and the Environment, 2011) consisted of mutually linked develop-ments in four main areas: the north-east corridor (abbreviated as ‘the T’, because of its shape), the Middle Area (MA), the A2-zone,
and the Boarder Area with Belgium (BA) (seeFig. 2). The province
acted as a process manager for ‘the T’ and the BA, while the
municipal cooperation board of Eindhoven (SRE) performed this role in the MA and the A2-zone. ‘The T’ concerns the development of the missing eastern and northern parts of the ring road around Eindhoven, also known as the ‘Ruit’ (diamond): this will be a 4-lane 100 km/h road. In addition, new road development in the north to Veghel is part of the plans. The MA will function as a recreational green area, thereby constraining the development of new urban functions such as housing. Two nature connection zones will con-nect the MA area with the natural habitat to the north of the to be extended A58 and with the area below the A67 highway. A further part of the plans is to downgrade highway A270 between Helmond and Eindhoven to a regional road with speed limits of 80 or 100 km/h instead of the current 120 km/h, and also to downgrade two (other) local/regional roads within the MA area to stimulate drivers to use the new T-structure.
After the regional agreement was reached in 2007, a pilot study was started in 2008. At that moment the national government also positively evaluated the programme and gave a financial commit-ment of EUR 259 million to developing the T-structure (i.e. com-pleting the Eastern and Northern ring structure). The total costs
of the T-structure part are estimated at EUR 815 million (Dutch
Ministry of Infrastructure and the Environment, 2011), which means that the region, both the 21 SRE municipalities and the
province of Noord-Brabant have to contribute significantly. The project is now in the planning stage and the exact provincial and municipal financial contribution is still unclear.
3.2. Modelling procedure
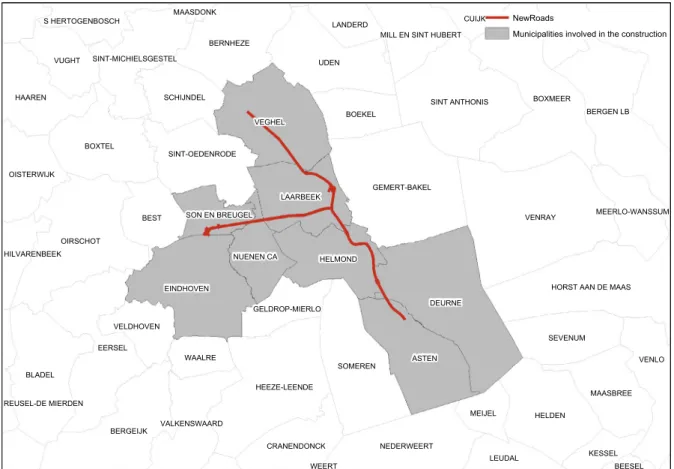
The two new roads are shown inFig. 3. The
northwest-south-east link of approximately 68 km is an improvement of the existing N279, whereas the west–east link is a totally new construction of about 32 km. These roads cross several municipalities, as can be
seen inTable 1.
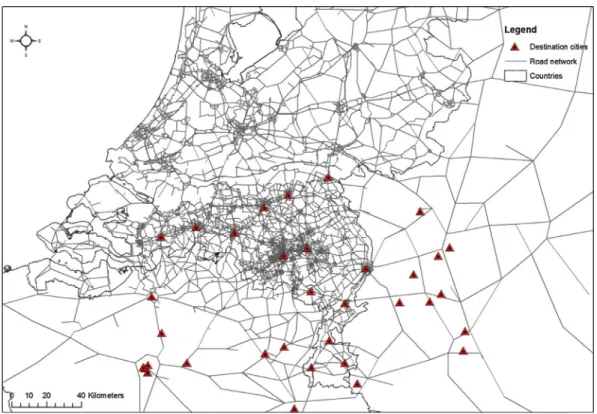
In this paper we consider the effects of these roads in terms of accessibility and mobility improvements, with a particular focus on the spillover effects generated. To do so, we compiled a data set about the location where trips have their origin and destination as well as the network links used. The study area contains 4026 four digit postcodes in the Netherlands, with their centroids repre-senting the places of origin, and we selected a set of 34 ‘prominent cities’ surrounding Eindhoven as destinations, 10 of which are located in Germany, 10 in Belgium and the remaining 14 in the
Netherlands (Fig. 4). By selecting these 34 cities we ensure that
the relationships we are looking at are economically significant. Furthermore the use of postcodes has the main advantage of
Fig. 1.Case study area; left: study area shaded in grey as part of the Netherlands; right: SRE study area with network links and major cities.
capturing more spatial variability of effects than if we would use more aggregates zones (e.g. municipalities or provinces). For the network analysis we used a digital road network, which includes a total of 48,073 arcs and which covers the Netherlands, part of Germany and Belgium. The network has more geographical detail in the province of Noord-Brabant, where most of the impacts are expected to occur. Each arc contains information about the type of road, the free flow speed, capacities and loads.
Considering the traffic congestion levels in this area, it is impor-tant to correctly measure the effects of the new roads on traffic redistribution. Two simulation models are used to achieve this: a
dynamic traffic assignment model called INDY (Bliemer et al.,
2004), which can realistically simulate traffic flows and traffic
con-gestion, and a GIS called Flowmap (Breukelman et al., 2009).
Basi-cally, INDY uses the network data about road type, speeds in free flow, capacities and traffic intensities to estimate route travel times before and after the construction of a new road. Within the model, two alternatives were simulated for the morning peak per-iod: one base scenario without the new roads and one scenario with the planned T-structure in combination with a downgrade
of highway A270 between Helmond and Eindhoven to a regional road. The model allowed for changes to occur in trip distribution and modal split between both scenarios. This means that because of changes in the network and accompanying changes in travel impedances, certain OD-relationships may become more or less preferable compared with the base scenario. However, the sum of all trips remained unaltered, i.e. the total number of trips in the origin- destination (OD) matrix summed up for all different transport modes. Outputs from the traffic model, in the form of tra-vel times per network link, are used as input for Flowmap to obtain origin destination travel time matrices, taking postcodes as origins and the 34 selected cities as destinations.
For each postcode, the travel time needed to reach each partic-ular city is measured on the basis of two scenarios:
Areference scenario, which represents the road network before the construction of new roads.
Afuture scenario that simulates the completion of these new roads.
We first compute the mean travel time changes (MTTC) in
rela-tive terms for each postcode, by comparing the travel times (T)
estimated for the future scenario (t1) with those computed for
the reference situation (t0) between a postcodeiand a cityj,
ac-cording to:
MTTCi¼
Xn
j¼1
ðTijt1Tijt0Þ 100
Tijt0
,
n ð1Þ
wherenis the number of destination cities (34 in total). This
indi-cator yields an indication of the average impact of the new road infrastructure on travel time. A negative value indicates a reduction
VENRAY
DEURNE UDEN
BOXMEER
EERSEL
ASTEN OIRSCHOT
BLADEL
VEGHEL
HELDEN GEMERT-BAKEL
SOMEREN
BERGEN LB
BOXTEL
BERGEIJK
EINDHOVEN
HEEZE-LEENDE
SINT ANTHONIS
VENLO BEST
BERNHEZE
HAAREN
HELMOND LAARBEEK
HORST AAN DE MAAS
NEDERWEERT
SEVENUM VUGHT
MAASBREE BOEKEL
SCHIJNDEL
SINT-OEDENRODE
OISTERWIJK
LEUDAL NUENEN CA
CRANENDONCK
MEIJEL WAALRE
CUIJK
VELDHOVEN
LANDERD
KESSEL VALKENSWAARD
SINT-MICHIELSGESTEL
MEERLO-WANSSUM MILL EN SINT HUBERT
GELDROP-MIERLO HILVARENBEEK
S HERTOGENBOSCH
SON EN BREUGEL
BEESEL REUSEL-DE MIERDEN
MAASDONK
WEERT
NewRoads
Municipalities involved in the construction
Fig. 3.Location of the new roads selected as case studies.
Table 1
Municipalities involved in the construction process.
Municipalities km of new roads
Laarbeek 27.3
Son en Breugel 13.4
Helmond 12.5
Nuenen Ca 2.5
Veghel 8
Asten 2.9
Eindhoven 0.3
in travel time due to the new roads, which can be interpreted as an increase of the accessibility from a postcode (i.e. the origin) to the selected cities. This represents a meaningful measure of the acces-sibility impacts since it entails an access change from each postcode to major destinations.
In addition to the indicator above, we aim to gain greater
in-sight into where the highest time gains (and thus benefits3) of
the new road infrastructure are to be expected. Our second indicator represents the highest travel time gains as a consequence of the
additional infrastructure for each postcode zonei:
HTTCi¼Highestij
ðTijt1Tijt0Þ 100
Tijt0
ð2Þ
whereHTTCiis the highest travel time benefit in relative terms for
postcodei,Highestijis the maximum negative travel time change
concerning all relationships betweeniand the 34 destination cities
j. For each postcode, this indicator provides information about the
size and location of the highest potential travel time benefits. Both indicators target the postcode level. Moreover, we also looked at a
municipal and even a provincial level because sometimes it is polit-ically more significant, as these institutional bodies are involved in the planning process and in the construction of roads. When doing
this we average the mean or the highest travel time gains (Eqs.(1)
and (2)) of all postcodes inside each municipality or province. Moreover, we analyse the impacts of the new road in monetary terms, because it can provide an indication of how projects costs could be distributed amongst different stakeholders. The value of
travel time changes (VTTC) between each municipalitykand
desti-nation cityjis calculated by crossing information about travel time
differences betweenkandj(TTD, calculated asTkjt0Tkjt1, in
min-utes, where Tkj is the mean travel time change achieved by all
postcodes inside a municipalitykto a destination cityj),4traffic
intensities (TI) between kandj and a value of travel time (VOT),
according to:
VTTCkjTIkjVOT ð3Þ
Because traffic intensities were available only for the Netherlands, we restricted these results to only 14 destinations, i.e. cities located in the Netherlands. We used estimated daily traffic intensities for the plan year, which includes the T-structure around Eindhoven. Moreover, we applied three different VOTs (5; 11 and 20 EUR per hour) to cover diverse social groups. We based our average VOT
of 11 EUR/h onVan Amelsfort and Bliemer (2006), who estimated
this value on the basis of data from a stated choice experiment in which respondents had to trade off alternative commute journeys under road pricing conditions. The other two values were chosen quite arbitrarily as rounded minimum and maximum values. The
total value of travel time changes by each municipality (VTTCk) is
calculated as:
VTTCk¼
Xj
i¼1
VTTCkj ð4Þ
Fig. 4.Destination cities and the road network.
Table 2
Descriptive statistics of travel time reductions (%) at postcode level (mean travel time changes – Eq.(1)).
All postcodes Postcodes receiving the infrastructure
Postcodes not receiving the infrastructure
Count 4026 16 4010
Minimum 2.9 2.9 2.9
Maximum 1.3 0.9 1.3
Mean 0.03 1.0 0.03
Standard Deviation 0.25 1.1 0.2
3 We implicitly assume that travel time gains bring benefits. Although this is a common assumption,travel time gains only bring benefits if the time savedcan be used usefully (in an economically beneficial way).
4
Note that positive values indicate that travel times were reduced, while in Eqs.(1)
4. Travel time, monetary and mobility impacts of the new road infrastructure
4.1. Travel time impacts
Table 2presents some descriptive statistics about the impacts of the two new roads expressed as mean travel time changes.
These results were calculated using Eq.(1)and represent the mean
travel time change for each postcode (in the Netherlands) when accessing the entire set of destination cities. Globally, the mean
travel time change is negligible (i.e. 0.03%), denoting that
improvement of the transport infrastructure at a national level has a slightly positive effect on travel times. Travel time decreases occur mainly in those postcodes where new roads are built and for those origin–destination relationships for which it is likely to use the new T-structure. The highest average travel time decrease for an origin postcode to all 34 destinations amounts to almost 3%. Changes occurring outside those postcodes receiving the
infra-structure can be regarded as spillover effects.Table 2shows that
these spillovers are lower than travel time reductions inside the area where new roads are constructed.
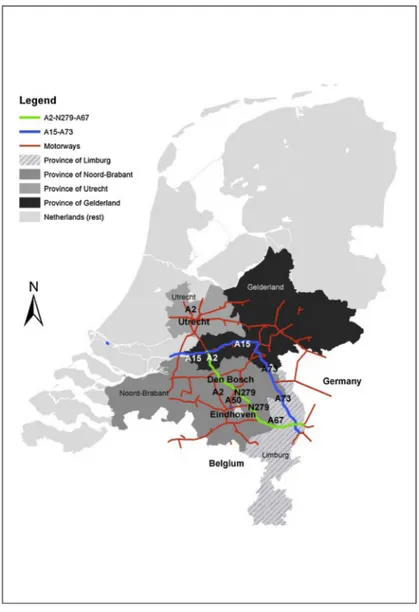
Some postcodes outside the construction area register a slight increase in travel times. This occurs mainly for relations between Eindhoven and Helmond at the east, and, is caused by the
impairment of the highway A270 between Helmond and Eindho-ven, and, the additional downgrading of two local/regional roads
within the MA area (seeFig. 2), which are meant to stimulate
driv-ers to use the new T-structure. Moreover, we observed a small accessibility decrease between the cities of Utrecht and Den Bosch, which are both well outside the area where the road structure is planned. Further examination of traffic intensities from the model output indicated that part of the upgraded T-structure, i.e. the N279, is used more intensively by traffic between the western part
of the Netherlands and the German-Ruhr area (seeFig. 5). Whereas
in the base-scenario the most likely trip path was to take the A15–A73 combination, the infrastructure adjustments also make some trips being diverted to the path A15–A2–N279–A67. Especially on the A2 stretch between Utrecht and Den Bosch this results in a slight decrease in accessibility.
Analysing spillovers at a postcode level has minor political significance, because municipal boards and, at a higher level, prov-inces and the national government are the responsible institutional agencies involved in major road project planning. We therefore
also analysed spillovers at the municipal (seeTable 3) and
provin-cial level. The results at the municipal level are generally in line
with those observed inTable 2, although the minimum and
maxi-mum values are less extreme because of the aggregation from postcode to municipal level. As we already pointed out, some areas
register a slight increase in travel time as a consequence of induced traffic. Generally speaking, however, averaged over all Dutch municipalities there is a small travel time decrease. As expected, at regional level, the province of Noord-Brabant registers the great-est travel time reductions, because it contains the new T-structure. However, important ‘positive’ spillovers can also be found in the north of the province of Limburg and to a lesser extent in the south of the province of Gelderland.
We obviously obtain a more positive picture with the second indicator – the highest travel time gain – because it focuses on the highest travel time reduction achieved by each postcode to any of the selected cities. On average we observe a travel time
reduction of approximately 3% (Table 4), while in some areas,
espe-cially where the new road links are located, this decrease amounts to almost 25%. However, in some postcodes outside the construc-tion area, we observe significant effects of up to 20%, which emphasizes the importance of taking account of spillovers. At a somewhat higher spatial scale, i.e. municipalities, we found com-parable results to those at the postcode level.
Fig. 6also shows the results of Eq.(2), graphically at a postcode level. This figure shows that spillovers are greater at the end of the links, following a northwest-southeast distribution for the old N279, and a west–east distribution for the new west–east link. This
is in line with previous studies (Gutiérrez et al., 2010;
Condeço-Melhorado et al., 2011), which found that orientation and distance to new links are an important factor influencing spillover magni-tude. Finally, we note that the west–east link seems to generate greater spillovers than the other link, which is in line with expec-tations, because the west–east link is a new connection, whereas the other is an improvement of partly already existing road links (i.e. the N279).
4.2. Monetary and mobility impacts
In this section we translate traffic intensities and express travel
time changes into monetary values (see Eq.(3)) at municipal level.
Table 5 shows descriptive statistics of the value of travel time changes for all municipalities in the Netherlands. In line with ear-lier results, some municipalities show a loss, while the new trans-port infrastructure results in a gain for other municipalities, up to a maximum between approximately EUR 1000 (VOT = 5 EUR/h) and EUR 4000 (VOT = 20 EUR/h) per day. For the whole country, the Table 3
Descriptive statistics of travel time reductions (%) at municipal level (mean travel time changes – Eq.(1)).
All
municipalities
Municipalities receiving the infrastructure
Municipalities not receiving the infrastructure
Count 443 8 435
Minimum 2.2 2.2 1.8
Maximum 0.9 0.9 0.5
Mean 0.04 0.5 0.03
Standard Deviation 0.3 1 0.2
Table 4
Descriptive statistics of travel time reductions (%) at postcode level (highest travel time changes – Eq.(2)).
All postcodes
Postcodes receiving the infrastructure
Postcodes not receiving the infrastructure
Count 4026 16 4010
Minimum 24.5 24.5 20.3
Maximum 0.2 3.8 0.2
Mean 3.2 15.0 3.2
Standard Deviation 2.5 5.5 2.4
Mean travel time changes (%)
-24,5 : -18
-18 : -16
-16 : -14
-14 : -12
-12 : -10
-10 : -8
-8 : -6
-6 : -4
-4 : -2
-2 : -0,2
Noord-Brabant
NewRoads
0 25 50Kilometers
new T-structure represents a gain ranging from slightly less than EUR 3000 to more than EUR 11,000 per day, while the average gain by municipality ranges from a modest EUR 6 to EUR 26 per day. In
line with Section4.1, we again find that some municipalities lose.
The losses are smaller, however, than the gains.
Furthermore, we analysed which bilateral relationships gain. The ones most benefited either originate or end up in’s Hert-ogenbosch and/or Helmond; they make full use of the benefits of the new T-structure. Another connection that scores well is the internal relationship within Eindhoven. This latter result is not so much due to the absolute size of the travel time gain but is rather caused by small travel time gains in combination with high traffic
intensities. Finally,Table 6shows the value of travel time changes
by province. As expected, the province of Noord-Brabant benefits most. However, the benefits measured for the province of Limburg are noteworthy and account for approximately 40% of the benefits achieved by Noord-Brabant. The likely reason for this is that the new T-structure is located close to Limburg.
5. Conclusions
When evaluating the effects of transport infrastructure spillover effects must be considered. The exclusion of these effects can be ar-gued to cause the underestimation of the profitability of transport projects and therefore the public financing they require. Previous
studies have measured spillovers (Condeço-Melhorado et al.,
2011; Gutiérrez et al., 2010; López et al., 2009) of new transport infrastructure with accessibility measures (potential accessibility), but this is the first time spillovers have been validated with mobil-ity data. The main contribution of this paper is the estimation of spillover effects caused by two new roads planned for the city re-gion of Eindhoven and weighting these with traffic intensities. It was thereby possible to determine their true importance with re-spect to their benefit for potential users. Another novel are-spect of this study was the monetization of spillovers according to traffic intensities and the values of travel time.
The effects of the new roads were expressed in travel time changes and in monetized time changes. Regarding the former, two measures were used: (1) the mean travel time change (both gains and losses) and (2) the highest travel time decrease (i.e. ben-efit) for each postcode to a set of cities. Our results indicated that the greatest travel time decreases occur in municipalities that con-tain new roads. With respect to spatial orientation, we find that spillovers are more intense at the end points of the new roads. However, some nearby locations obtain only a marginal benefit be-cause they still have other alternative roads that are more useful for reaching important neighbouring cities. Additionally, we mon-etized the travel time changes by means of values of travel time change and by considering traffic intensities. This resulted in a gen-erally positive effect for the new roads. Within the analysis in this paper, the sum of all trips remained unaltered as a consequence of new road infrastructure. This is a valid assumption on the short run. On the longer term, trip generation may occur because of addi-tional road capacity, which may result in a greater number of trips, but potentially also in additional traffic delays compared to a situ-ation without trip genersitu-ation. In such case, the analysis in mone-tary terms may be a better indicator for assessing spillover effects compared to the travel time indicator, because the former indicator mentioned takes account of both travel time changes and traffic intensity effects. This would give more balanced insight into the spillover effects under conditions of traffic generation.
In our analysis we also distinguished between different spatial and institutional levels: the postcode level, municipalities and provinces. Although the general picture is in accordance with expectations, we found that the magnitude of spillovers decreases as the spatial unit of analysis increase. Spillovers are greater at the postcode level, since neighbouring postcodes are closer to trans-port investments, while with larger spatial units, such as provinces, neighbouring regions are located further away from the actual investment area and local extremes are averaged out.
We conclude that, from a travel time perspective, areas that are closer to where new road infrastructural investments are made generally benefit more. Considering the provincial scale, this logi-cally means that the province of Noord-Brabant will benefit more from the T-structure than other Dutch provinces, although the province of Limburg, which is located to the southeast of Noord-Brabant, also receives important gains due to spillovers.
Spillover effects could shed different light on current infrastruc-ture investments and on where the money streams should come
from. As addressed in Section 3.1, the current plan is that the
national government in the Netherlands, the province of Noord-Brabant and the 21 municipalities located within the ‘cooperation
region Eindhoven’ (SRE) all contribute financially. The T-structure
project is still at the planning stage and currently only the national government’s contribution has been decided upon: EUR 259 mil-lion. The remaining budget has to come from regional partners. The 21 SRE municipalities and the province of Noord-Brabant are those that stand to benefit most according to our travel time spill-over analysis. From this point of view their financial contribution seems logical. However, our analysis also showed that several other regions outside Noord-Brabant benefit. The region to benefit most significantly is Limburg, located southeast of Noord-Brabant. From a travel time ‘fairness’ perspective, Limburg should con-tribute financially to the realisation of the T-structure, given the spillover gains that it gets in return. In practice, however, this may not be so easy to achieve. Other regions or municipalities may not be that willing to contribute to new road infrastructure constructed in another region, because they may want to use their limited financial resources for road projects (or to achieve other policy goals) in their own region. They may for instance also claim, fairly or unfairly, that another region substantially benefits from their road infrastructure as well. However, although the current Table 5
Value of travel time changes (EUR/day) for all municipalities in the Netherlands (Eq.(4)).
Descriptives VOT 5 EUR/h VOT 11 EUR/h VOT 20 EUR/h
Count 443 443 443
Minimum 820 1807 3289
Maximum 983 2167 3944
Sum 2841 6260 11,392
Mean 6 14 26
Standard Deviation 93 205 372
Table 6
Value of travel time changes (EUR/day) by provinces.a
Provinces VOT 5 EUR/h VOT 11 EUR/h VOT 20 EUR/h
Drenthe 1 2 4
Flevoland 17 38 69
Friesland 4 9 17
Gelderland 214 472 858
Groningen 0 1 1
Limburg 1043 2299 4183
Noord-Brabant 2407 5306 9655
Noord-Holland 127 280 509
Overijssel 5 10 19
Utrecht 127 281 511
Zeeland 7 15 27
Zuid-Holland 133 293 534
financing system in the Netherlands, with a prominent role for na-tional government, could be hard to adjust, and, although it may be difficult to have different regional stakeholders to agree on co-financing issues, our spillover analysis at least provides interesting insight into how financial responsibilities could be distributed dif-ferently, and, depending on the perspective taken, more fairly. A notable example of extraordinary financial cooperation is the con-struction of a section of the Bundesautobahn 31 (or A31), which runs between the Ruhr area and the city of Emden in Germany, parallel to and near the Dutch border. A small stretch of this road between Ochtrup and Lingen was completed ahead of schedule be-cause of a regional Dutch financial contribution. The reason for this contribution was that the A31 connects cities in the east and north-east of the Netherlands with the German Ruhr area. Such financial constructions could also be applied in other cases, such as in coun-tries with more decentralized road infrastructure planning, and accessibility spillovers could provide a useful insight into how to shape these constructions.
Arts, J., De Vaan, M., 2010. Infrastructure meets area development. Developments in Dutch planning practice: towards a more balanced finance of development projects? In: Fourth Conference on Planning Law and Property Rights. Dortmund, Germany.
Aschauer, D.A., 1989a. Is public expenditure productive? Journal of Monetary
Economics 23, 177–200.
Aschauer, D.A., 1989b. Does public capital crowd out private capital? Journal of
Monetary Economics 24, 171–188.
Beuthe, M., 2002. Transport evaluation methods: from cost–benefit analysis to multicriteria analysis and the decision framework. In: Giorgi, L., Pearman, A.
(Eds.), Project and Policy Evaluation in Transport. Ashgate, Aldershot.
Beuthe, M., Eeckhoudt, L., Schannella, G., 2000. A practical multicriteria methodology for assessing risky public investments. Socio-Economic Planning
Sciences 34, 121–139.
Bliemer, M.C.J., Versteegt, H.H., Castenmiller, R.J., 2004. INDY: a new analytical multiclass dynamic traffic assignment model. In: Proceedings of the TRISTAN V Conference. Guadeloupe.
Breukelman, J., Brink, G., De Jong, T., Floor, H., 2009. Manual Flowmap 7.3. Faculty of Geographical Sciences, Utrecht University, Utrecht.
Bruinsma, F.R., Rietveld, P., 1997. The Impact of Accessibility on the Valuation of
Cities as Location for Firms. Free University Amsterdam, Amsterdam.
Button, K.J., 1993. Transport Economics. Cambridge University Press, Cambridge.
Cantos, P., Gumbau-Albert, M., Maudos, J., 2005. Transport infrastructures, spillover effects and regional growth: evidence of the Spanish case. Transport Reviews
25, 25–50.
CBS Statistics Netherlands, 2012. <http://statline.cbs.nl>.
Cohen, J.P., 2010. The broader effects of transportation infrastructure: spatial econometrics and productivity approaches. Transportation Research Part E:
Logistics and Transportation Review 46, 317–326.
Commission of the European communities (COM), 2009. Green Paper – TEN-T: A Policy Review – Towards a Better Integrated Trans-European Transport Network at the Service of the Common Transport Policy. 44 Final. Brussels.
Condeço-Melhorado, A., Gutiérrez, J., García-Palomares, J.C., 2011. Spatial impacts of road pricing: accessibility, regional spillovers and territorial cohesion.
Transportation Research Part A 45, 185–203.
Crescenzi, R., Rodríguez-Pose, A., 2008. Infrastructure endowment and investment as determinants of regional growth in the European Union. European
Investment Bank Papers 13 (2), 62–101.
Delgado, M.J., Álvarez, I., 2007. Network infrastructure spillover on private productive sectors: evidence from Spanish high capacity roads. Applied
Economics 39, 1583–1597.
DETR, 1998. A New Deal for Trunk Roads in England: Understanding the New Approach to Appraisal (NATA). Department of the Environment, Transport and
the Regions, London.
Dutch Ministry of Infrastructure and the Environment, 2011. MIRT Projectenboek 2012. Ministry of Infrastructure and the Environment, The Hague, The Netherlands.
Dutch Ministry of Infrastructure and the Environment, 2012. Structuurvisie Infrastructuur en Ruimte (SVIR) -Nederland concurrerend, bereikbaar. leefbaar en veilig [Structure Vision Infrastructure and Space – The Netherlands Competitive, Accessible and Safe]. Ministry of Infrastructure and the Environment, The Hague, The Netherlands.
Dutch Ministry of Transport, Public Works and Water Management, 2005. Nota Mobiliteit, Naar een betrouwbare en voorspelbare bereikbaarheid [National Mobility Plan, Towards a Dependable and Predictable Accessibility], Deel III Kabinetsstandpunt. Ministry of V&W, The Hague, The Netherlands.
Forslund, U.M., Johansson, B., 1995. Assessing road investments: accessibility changes, cost benefit and production effects. Annals of Regional Science 29,
155–174.
García-Milá, T., McGuire, T.J., 1992. The contribution of public provided inputs to
states ‘economies’. Regional Science and Urban Economics 22, 229–241.
Geurs, K.T., Ritsema van Eck, J.R., 2003. Evaluation of accessibility impacts of land-use scenarios: the implications of jobs competition, land-land-use, and infrastructure developments for the Netherlands. Environment and Planning B: Planning and
Design 30, 68–87.
Geurs, K.T., Ritsema van Eck, J.R., 2001. Accessibility Measures: Review and Applications. RIVM Report 408 505 006. <http://www.pbl.nl/en/publications/
2001/Accessibility_measures__review_and_applications>.
Geurs, K.T., Van Wee, B., 2004. Accessibility evaluation of land-use and transport strategies: review and research directions. Journal of Transport Geography 12,
127–140.
Gutiérrez, J., Condeço-Melhorado, A., Martín, J.C., 2010. Using accessibility indicators and GIS to assess spatial spillovers of transport infrastructure
investment. Journal of Transport Geography 18, 141–152.
Handy, S.L., Niemeier, D.A., 1997. Measuring accessibility: an exploration of issues
and alternatives. Environment and Planning A 29, 1175–1194.
Heeres, N., Tillema, T., Arts, J., 2012. Integration in Dutch planning of motorways:
from ‘‘line’’ towards ‘‘area-oriented’’ approaches. Transport Policy 24, 148–158.
Heeres, N., Tillema, T., Arts, J., 2013. Value capture around road infrastructure as an alternative means to promote public–public cooperation? In: PLPR Conference, February 2013, Portland, Oregon, USA.
Holl, A., 2004. Manufacturing location and impacts of road transport infrastructure: empirical evidence from Spain. Regional Science and Urban Economics 34, 341–
363.
Holl, A., 2012. Market potential and firm-level productivity in Spain. Journal of
Economic Geography 12, 1191–1215.
Holtz-Eakin, Schwartz, D., 1995. Spatial productivity spillovers from public infrastructures: evidence from state highways. International Tax and Public
Finance 2, 459–468.
Laird, J.J., Nellthorp, J., Mackie, P.J., 2005. Network effects and total economic impact
in transport appraisal. Transport Policy 12, 537–544.
Lakshmanan, T.R., 2011. The broader economic consequences of transport
infrastructure investments. Journal of Transport Geography 19, 1–12.
López, E., Monzón, A., Ortega, E., Mancebo, S., 2009. Assessment of cross-border spillover effects of national transport infrastructure plans: an accessibility
approach. Transport Reviews 29, 515–536.
Mas, M., Maudos, J., Pérez, F., Uriel, E., 1994. Capital público and productividad en
las regiones españolas. Moneda and Crédito 198, 163–193.
Melo, P., Graham, D., Noland, R., 2010. Impact of transport infrastructure on firm formation. Transportation Research Record: Journal of the Transportation
Research Board 2163, 133–143.
Morris, J.M., Dumble, P.L., Wigan, M.R., 1979. Accessibility indicators for transport
planning. Transportation Research Part A: General 13, 91–109.
Pereira, M.A., Sagalés, O.R., 2003. Spillover effects of public capital formation:
evidence from the Spanish regions. Journal of Urban Economics 53, 238–256.
Rietveld, P., Nijkamp, P., 1993. Transport and regional development. In: Polak, J., Heertje, A. (Eds.), European Transport Economics. European Conference of Ministers of Transport (ECMT), Oxford.
Schürmann, C., Spiekermann, K., Wegener, M., 1997. Accessibility Indicators. Dortmund: Berichte aus dem Institüt für Raumplanung. IRPUD, Report Number, 39.
Van Amelsfort, D.H., Bliemer, M.C.J., 2006. Alternative Specifications of Scheduling Delay Components: The Effect of Travel Time Uncertainty and Departure Time Rescheduling. The 85th TRB Annual Meeting. Washington, DC, USA.
Vickerman, R.W., Spiekermann, K., Wegener, M., 1999. Accessibility and economic
development in Europe. Regional Studies 33, 1–15.
Vreeker, R., Nijkamp, P., Ter Welle, C., 2002. A multicriteria decision support methodology for evaluating airport expansion plans. Transportation Research