1. INTRODUCTION
Sustainability has become a challenge for every city authority. Congestion, pollution, resource consumption, social exclusion, and deterioration of quality of life are some of the problems that authorities must deal with in the coming years due to the intensive and continuous growth of car usage.
There is an increasing range of policy measures available. However, this fact, added to the complexity of the city system as a dynamic environment and the ambitious concept of sustainability—which includes economic, environmental and social targets—has made it difficult to identify the measure or combination of measures that will enhance welfare.
The aim of this work is therefore to explore the possibility of integrating forecasting, analysis and optimization procedures in support of a decision-making process designed to obtain the best achievable scenario. The method is presented by means of the optimization of a simple pricing policy scheme.
Fiscal instruments are currently accepted both as mobility management mea-sures for maintaining traffic at a reasonable level and as a way of internalizing externalities through direct payments (Rich and Nielsen, 2007). In addition, revenues can be ploughed back into transport systems in order to achieve greater efficiency (Ferrari, 2002) to improve the level of service of public transport (PT). The objective of the measure to be optimized is generally proposed to be a mechanism for reducing the congestion existing in the central business district (CBD), as well as a reduction of the impact caused by this congestion (e.g., emissions, noise) on an area which is particularly sensitive due to the pres-ence of a high density of population and commercial activities.
London implemented a congestion charge (zonal scheme) in the center of the city. This measure has succeeded in reducing traffic delays by 30%inside the city center due to a 15% reduction in traffic circulating within the zone, and an 18% reduction in traffic entering the central zone during charging hours (Leape, 2006). However, traffic speeds have now returned to approximately what they were before the scheme was introduced. In Stockholm, a cost–benefit analysis (CBA) based on the measured result of the charging trial in 2006 shows that the toll sys-tem yields a considerable social surplus net of investment and operational costs (Eliasson, 2009). In Norway, road tolling has primarily been considered as a prac-tical measure to secure the necessary funding for roads, including those located in urban areas. Recent amendments to Norwegian law have included public trans-port—both infrastructures and operation—as the destination for funds raised through pricing policies (Lauridsen, 2011). There is also a demand for variable toll schemes depending on the level of congestion (Ramjerdi, Minken, and Østmoe, 2004).
Even though a charging scheme has proven successful for some cites, there is still the general problem of the transferability of experiences from one case to another (Rich and Nielsen, 2007). As a general assumption, the greater the congestion in the toll zone, the higher the benefits to be expected if car use can be reduced.
and the Norwegian toll rings (Lauridsen, 2011) is one that charges a fee for driving a vehicle through the charging zone. The manner in which and how the charges are applied may vary, depending on both policy and available technology.
Traditionally, city center pricing strategies are evaluated using a static CBA (Rich and Nielsen, 2007; Eliasson, 2009; Rotaris et al. 2010). However, this approach does not take into account that these schemes may have long-term impacts on urban activities and the dynamics of the interrelationship between residential and workplace patterns, in addition to the traditional patterns of changes in mobility. As these pricing policies may affect not only traffic flows and traveler behavior, but also various other elements of the urban environment such as hous-ing and business location, traffic accident rate, air quality and greenhouse gas emissions, another kind of impact assessment framework is needed. Moreover, sustainable transport policies must be long term, with policies sustained over time, for lasting and real impact (Buehler and Pucher, 2011).
This article focuses on determining the optimum toll value for entering a defined area according to sustainability targets (maximum social welfare) and land-use and transport dynamics.
It is important to capture the dynamic character of these variables in relation to the target function and their future impact within the urban system. The road pricing policy reduces the effects of congestion, raising revenues for PT improve-ments and encouraging fewer and shorter trips, and the shifting of trips to off-peak periods. The theory of Systems Dynamics (SD) offers a good approach to simulate complex systems in the long term in both land-use and transport modeling. An SD approach helps to identify the ways in which causal mobility structures and travel behavior patterns rely on a formal simulation model to capture the full complexity of the metropolitan mobility situation, and to make more reliable inferences about travelers’ behavior (Sterman, 2000).
There is little research on SD-based optimization in the literature. Some references offer material on the attempt to combine the optimization process with SD (Miller, 1998; Dangerfield and Roberts, 1999; Coyle, 2000; Timms, May, and Shepherd, 2002; Pfaffenbichler and Shepherd, 2003; Shepherd et al. 2006). In order to obtain an understanding of different transportation policies, a number of researchers have used the SD approach for transportation modeling. However, there is very limited research that evaluates the dynamic consequences of conges-tion pricing policies on a pricing area (Liu, Triantis, and Sarangi, 2010). This study provides a modeling framework based on the SD approach by which policy-makers can understand the dynamic and complex nature of traffic congestion within the representation of a socioeconomic transportation system in a metropolitan area.
Haghani, Lee, and Byun (2003a, 2003b) presented a SD model to study the interactions between transportation and land-use. This modeled performance as a policy tool and examined the impacts of highway capacity expansion over time. Qiang, Zhong, and Yuan (2006) used an SD approach to investigate traffic prob-lems in Shanghai, and showed that road congestion will become more severe in the future if only road supply is increased.
on the integrated model of land-use, strategic transport and regional economy, and compared them with the short-term effects obtained from another model. Gupta, Kalmanje, and Kockelman (2006) explored the traffic, land-use and wel-fare impacts of road pricing in the Austin (Texas) region, introducing various road pricing simulations. On the other hand, Zhang et al. (2011) tackle with the problem of congestion pricing in multiple regions where each local admin-istrative region sets its own toll levels using various bi-level models. Five pricing schemes were proposed considering competitive, cooperative, or mixed behaviors of both in regional road pricing and in general networks with two or more regions. None of these studies include an optimization process. However in Li et al. (2012), an optimization problem for designing an environmentally sustain-able toll scheme is formulated. In this case, environmental, externalities are incorporated to the congestion pricing in order to avoid environmentally unsus-tainable urban transportation systems. The method incorporates the effects of uncertain demand and supply into the road toll pricing models for policy assessment.
Once the SD theory is assumed in a Land-Use and Transport Interaction model (LUTI model), the goal is to establish a procedure for long-term optimization, with social welfare as an objective function (OF) and the toll fee as the variable to define. This goal is similar to other studies such as the works by Emberger, Shepherd, and May (2008), and Shepherd et al. (2006), which present optimal transport strategies resulting from the application of a single policy instrument. Madrid Metropolitan Area has been selected as appropriate case study, where implementing such a procedure helps to highlight the main features and impacts of a hypothetical toll ring scheme. It is a city with 5,867,299 million inhabitants (in 2004) with rather complex land-use and mobility patterns.
This article is organized as follows: the proposed methodology is outlined, and the LUTI model is briefly described. Then the optimization process and the OF are detailed. The second part shows the case study description, and the toll ring scheme optimization results are presented based on the case study. Main results obtained are synthesized. Discussions about the efficiency of the pricing policy, impacts generated and main contributor to the social welfare surplus reached are tackled.
2. THE PROPOSED METHODOLOGY
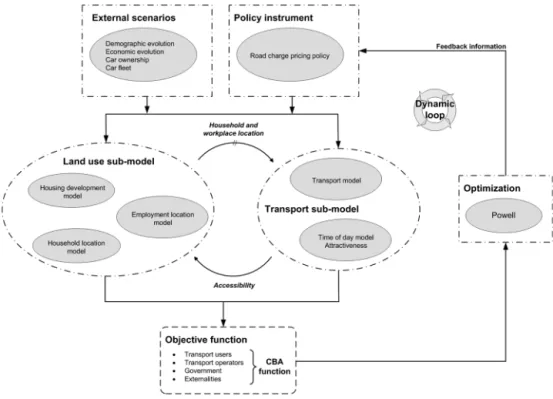
A system is defined as a group of entities which act and interact together towards the achievement of a specific target. This system may represent only a part or a subset of an overall system. This proposed SD approach consists of linking the subsystems of land-use and transport and an optimization procedure.
3. THE LAND-USE AND TRANSPORT MODEL
A system is termed dynamic if its interactions cause changes over time, and is useful in evaluating long-term scenarios where the behavior to be assessed is the consequence of complex interactions.
The methodology is based in the use of a LUTI model. This land-use and transport system is considered to be a long-term SD. In this case a strategic, dynamic, and integrated urban land-use and transport model is used as the frame-work. The LUTI model has been calibrated for the regional and metropolitan area of Madrid. We have selected the MARS model (Metropolitan Activity Relocation Simulator) (Pfaffenbichler, 2008) because it fits quite well with the requirements of the case study and the complexity of the interaction among several transport modes and type of activities.
MARS was developed as a way to investigate strategic issues over a long time period. The average running time of MARS model is less than ten minutes for a 30-year simulation with quarterly time slots. The user is therefore able to test a wide variety of different policy instrument values and=or combinations in a reasonable time, allowing each scenario reached over the 30 years to be mea-sured through a set of indicators. This information is needed to feed the welfare OF to be optimized. A full description of the MARS model is provided in Pfaffenbichler (2008).
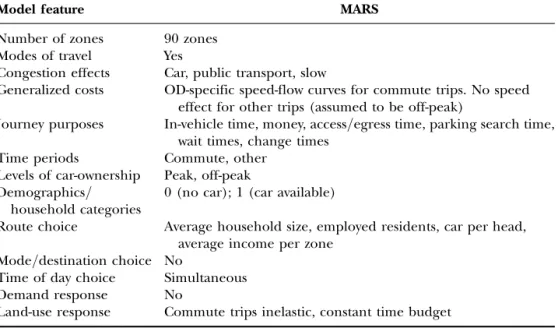
The model includes a transport model, a housing development model, a house-hold location choice model, a workplace development model, and a workplace location choice model, all of which are interrelated through causal-effect relations. MARS also includes a fuel consumption and emission model. Three composite modes are represented: car (driver and passenger), public transport (bus and rail) and slow modes (cycling and walking). This model uses the concept of a constant time budget (Levinson and Kumar, 1994). Commuting trips are assumed to be inelastic, and therefore off-peak journeys increase as peak-time congestion falls (Emberger et al. 2008). Table 1 shows the main characteristics of MARS.
The MARS model structure is based on a concept of causal loop diagrams (CLD) as shown in Figure 2. Each of the diagrams identifies the cause–effect relationship among different variables (e.g., ‘‘car commute trips’’ depends on some variables like ‘‘employed population’’ and ‘‘car attractiveness,’’ and it contri-butes to others as ‘‘car speed’’). There are two types of loops: balancing and rein-forcing. Attractiveness depends on availability, costs, and times, not only for the car but for the other modes of transport as well. But at the same time, attractiveness varies according to the intensity of car usage, as congestion may balance the time used for car trips in relation with the other modes (L1: balancing causal loop). On the other hand, congestion may also affect PT performance which can improve car attractiveness, in this case configuring a reinforcing loop (L3). This must be added to a third loop (balancing loop L2), as fuel consumption is related to travel speed. Similar configurations can be extended through all the subsystems, establishing a complex system of interrelated variables (Pfaffenbichler, Emberger, and Shepherd, 2008).
Table 1. Main characteristics of the metropolitan activity relocation simulator (MARS) model.
Model feature MARS
Number of zones 90 zones Modes of travel Yes
Congestion effects Car, public transport, slow
Generalized costs OD-specific speed-flow curves for commute trips. No speed effect for other trips (assumed to be off-peak)
Journey purposes In-vehicle time, money, access=egress time, parking search time, wait times, change times
Time periods Commute, other Levels of car-ownership Peak, off-peak Demographics=
household categories
0 (no car); 1 (car available)
Route choice Average household size, employed residents, car per head, average income per zone
Mode=destination choice No
Time of day choice Simultaneous Demand response No
In this case, pricing policies may alter this equilibrium reached through the different causal loops as car attractiveness is modified. It is this simple causal loop structure and user-friendly software (Vensim1) that helps improve the trans-parency, and hence the usefulness, of the modeling approaches used.
Furthermore, MARS assumes that land-use is not a constant but is rather part of an SD that is influenced by transport infrastructure (Shepherd et al. 2006). The interaction process is modeled using time-lagged feedback loops between the transport and land-use sub-models over a 30-year period. The basis of the stock-flow diagram for the expanded SD model is reproduced in Pfaffenbichler (2008). Thus accessibility changes in the long term, influencing both residential and workplace locations. The intensity of the change is directly related to the intensity of the measure (de la Hoz et al. 2008).
3.1. The Proposed Optimization Process
The optimization model enables the level of intensity of the application of certain transport policies to be defined.
Optimization techniques have been an important field of research in transpor-tation planning (May, Shepherd, and Timms, 2000; Mayhew and Hyman, 2002; de Palma, Kilani, and Lindsey, 2005; Vold, 2005; Shepherd et al. 2006; Zhang et al. 2006; Emberger et al. 2008; Light, 2009). However, the assessment of these techniques and their successful implementation in real-world transport cases remains to be validated.
In this work Powell’s optimization method (Powell, 1964) will be applied. This method is an algorithm that searches for a local minimum=maximum of objective Figure 2. Causal loop diagram for commute car trips. (Figure appears in color
function for a set of linearly independent direction vectors without calculating the derivatives. A detailed discussion of the algorithm is given in Brent (1973), and the complete algorithm is given in Press et al. (2007).
This method can be applied to optimize several types of transport and land-use policies; however in this case, the optimization process to choose the best transport policy levels is proposed with an application with two variables: a toll-pricing policy (short and long term) for passenger vehicles in Madrid city center. Examples of optimization of transport policies employing other methodologies can be found in Mayhew and Hyman (2002), Shepherd et al. (2006), Zhang et al. (2006), and Li et al. (2012).
3.2. The Objective Function
Traditionally, pricing policies are assessed in a discrete way and analyzed within a single period of time. However, effective planning requires making a long-term evaluation.
The welfare function is defined as the social benefits obtained throughout the complete period of time; however, the objective function must offer a judgment about the strengths of the scenario evaluated. This means that a scenario of refer-ence is needed.
Thus the objective function (OF) showed in Eq. (1) measures the change in social welfare compared to the A0 scenario, (do-nothing, reference scenario). This function is defined by the following elements: the change in consumer surplus (DCSij), which includes both the money costs (or savings) and time savings for the users, resulting from the implementation of strategy X. The operator change benefits (DOij) include gains linked to revenues from fares and charges. The government change benefits (DGij) include fuel tax revenues, and savings on road costs through decreased maintenance. Finally, the externalities change benefits (DEij) include those derived from reductions in the accident rate, as well as lower greenhouse gas emissions and the health benefits of the resulting better air quality (NOx and PM10).
OF ¼X
30
t¼0 X
ij
1 ð1þrÞt
½DCSijðtÞ þDOijðtÞ þDGijðtÞ þDEijðtÞ ð1Þ
The final evaluation includes the analysis of the OF expressed by net present value (NPV) over the full time horizon, and using a discount social rate of
r¼4.8%(Souto Nieves, 2003). The variabletrepresent the period of time. Thei
andjsubscripts refers to origin and destination zones, respectively.
The cost unit values for externalities (and Tables 2 and 3) were obtained from the European Project ‘‘Developing Harmonized European Approaches for Trans-port Costing and Project Assessment’’ (Bickel et al. 2005). As shown in the above equation, the investment costs are not taken into account.
CS) is given by Eq. (2):
DCS¼1 2
X
t
X
ijm
ðTijm0 þTijm1 Þ ðh tijm0 tijm1 Þ þ ððcijm0 þs0ijmÞ ðcijm1 þs1ijmÞÞi ð2Þ
WhereTijmis the demand for trips betweeniandjby modem; tijmis travel time multiplied by the value of time;cijmis operational mode costs (fuelþfixed costs) and finallysijmis the costs corresponding to fares, parking fees and other charges. The superscriptkis used to denote both the do-nothing scenario (k¼0) and the alternative scenario (k¼1).
In the square brackets in Eq. (2), the first term (travel time) is the value of time gains once the charges are in place. The second and third term (operating costs, fares
Table 2. Estimated emissions values and casualties avoided. Estimated emissions value
Year Avg. CO2value Avg. NOx value Avg. PM10value
2004–2009 22
2010–2019 26
2020–2029 32 5.300 2.873
2030–2039 40
2040–2049 55
2050 83
Estimated casualties avoided
Fatality Severe injury Slight injury
1.193.686 147.755 11.171
2004 prices (4=t). 2004 prices (4).
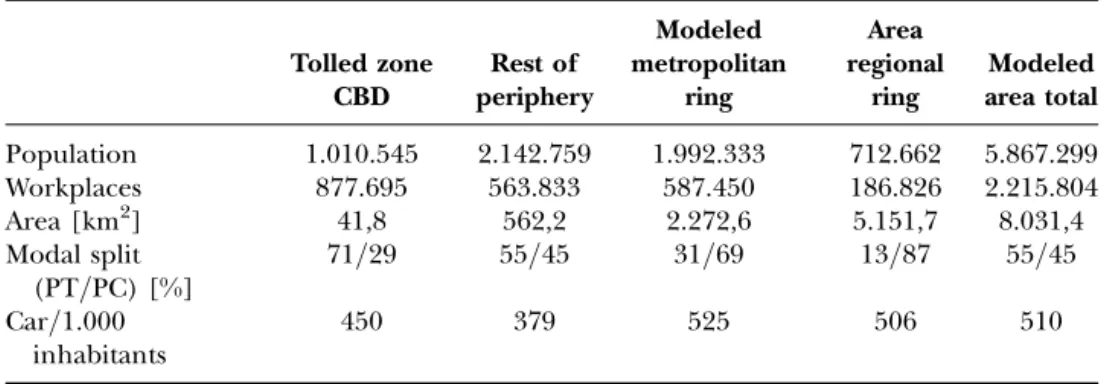
Table 3. Features of Study Zone.
Tolled zone CBD
Rest of periphery
Modeled metropolitan
ring
Area regional
ring
Modeled area total
Population 1.010.545 2.142.759 1.992.333 712.662 5.867.299
Workplaces 877.695 563.833 587.450 186.826 2.215.804
Area [km2] 41,8 562,2 2.272,6 5.151,7 8.031,4
Modal split (PT=PC) [%]
71=29 55=45 31=69 13=87 55=45
Car=1.000 inhabitants
450 379 525 506 510
and charges) provides estimates for the savings on car operating costs, basically the cost of fuel; and shows the revenues from the system. This is the disaggregated function for the transport users. The value of time assumed was 10.454=h for com-muting trips and 5.704=h for other trips (Monzo´n, Fernandez, and Jorda´, 2008). Equation (3) shows the value of net benefits to operators, including PT fares and toll and parking charges, calculated over a 30-year time period, but ignoring initial infrastructure costs. This equation includes the parking operator, the toll operator and the PT operator. Equation (4) represents the government’s benefits or losses resulting from changes in fuel tax revenue (DFij) and changes in the cost of road maintenance (DMij). Finally, equation (5) represents the value of extern-alities, associated with green-house gas emissions (DGHEij), air pollution (DPij) and safety (DSij).
i. Operators benefits: X
t
X
ijm
Tijm1 ðs1ijmþcijm1 Þ Tijm0 ðs0ijmþcijm0 Þ ð3Þ
ii. Government benefits: X
t
X
ijm
ðTijm1 Tijm0 Þ ðFijmþMijmÞ ð4Þ
iii.Externalities benefits: X
t
X
ijm
ðTijm1 Tijm0 Þ ðGHEijmþPijmþSijmÞ ð5Þ
According to our calculations, the value of operating costs (cijm) and travel time (tijm) by mode will depend on each OD pair (distance and travel time). The oper-ating costs by mode could vary depending on the scenario, as the destination zone change may be due to higher travel costs. Accounting for these in operating and travel time costs helps to improve the accuracy of estimates of consumer surplus, since travelers with higher time costs may choose to make shorter trips or use cheaper modes. Therefore, the CS can be rewritten by separating it into these component terms -commuting and other mobility- by modes of transportm. 3.3. Madrid Case Study
Figure 3. Study area – Madrid. (Figure appears in color online.)
Table 4. Surplus A1=A0 of the Madrid road charge scheme for the optimal toll value [NPV M4].
Category Sub-category
Time savings
Operation costs
Other costs
Savings/monetary expenses Total
Car Vehicles
(PH)
þ180,5 þ13,4 911,0 717,1
(VH) þ0,9 0,1 þ0,6
Public transport
Passengers (PH)
þ97,6 þ97,6
(VH) þ0,2 þ0,2
Government Fuel duty 28,6 28,6
Road mainte-nance
þ2,9 þ2,9
Operators Parking revenues
132,7 132,7
Toll revenues þ872,5 þ872,5
Fare revenues
þ22,0 þ22,0
Externalities Accidents 12,2 12,2
CO2 þ5,3 þ5,3
NOx and PM10
þ1,5 þ1,5
Total þ279,2 þ13,3 916,5 þ736,0 þ112,0
and similar number—260,000—that live outside and have their workplaces inside the CBD.
The MADRID MARS model represents the area mentioned above, with 90 zones covering the whole province (modeled area).
The toll scheme modeled presumes that tolls are charged automatically to dri-vers as they pass, without stopping, through several toll barriers located at the con-tours of the charged area (dotted line). It is also assumed that the toll-road user will pay the same toll regardless of the car type or the residential zone in which he or she lives.
Costs of installing and operating the toll scheme in Madrid are not considered in this study because it would be necessary to design the implementation project which is not the scope of this article. However the Madrid toll ring would be imple-mented in the existing motorway that has been fully equipped in 2007 with access control gates, management control center, etc. Therefore the extra costs associa-ted to toll management could be rather low if the system operates with modern electronic tags.
On the other hand, a parking fee is currently imposed in the CBD, including for residents. For the sake of simplicity in the discussion, this fee is maintained con-stant (42.50) and is estimated as an average of the current parking costs assumed by citizens.
Taking as a reference the 1996 and 2004 mobility surveys, it can be seen (Guzma´n and de la Hoz, 2009) that trips inside the Madrid district lose weight in the overall figures: from 57.1%to 48.6% between 1996 and 2004, respectively. At the same time, the outermost trips, radial trips between the external rings, and orbital trips within the rings are those that grow most in relative terms.
However from a global point of view, the relative weight of mobility to the center-radial mobility- has gradually decreased in recent years in Madrid. A significant change can be seen in the period from 1996–2004; the metropolitan ring has grown in importance (see Figure 4), as a result of the dispersal of activities. This has major effects on the modal distribution and efficiency of the system, given that the greatest growth occurs precisely in those relationships where the car is the primary mode of transport.
3.4. Scenarios
The reference scenario (A0) includes only the infrastructures built in 2004 and does not consider any intervention during the 30-year evaluation period (2004– 2034). Under scenario A0, the net social welfare is set to zero. The optimum toll value obtained in the alternative scenario A1 that maximizes the NPV of the OF proposed is the surplus of the social welfare compared to scenario A0.
When the optimization procedure is defined, we assume that in the most gen-eral case the pricing policy can be applied to any time-period of assessment (t¼1, 2. . .30). In this case, for a single instrument there could in theory be 30 different levels in the optimal solution. However, and according to Emberger et al. (2008), we have not attempted to solve this problem as the optimal policy must be easily understood, and easy to present to decision makers.
(2034). We assume the toll increases linearly between the toll level selected for 2010 and 2034. Additionally, the toll ring policy is optimized for two periods of the day: peak and off-peak. The toll scheme is implemented only for passenger vehicles. The base-line year for this study is 2004 and the toll ring scheme is assumed to be implemented in 2010.
External variable projections such as economic and population growth are esti-mated based on data for official statistics (from the Madrid Institute of Statistics; INE, 2010).
4. SUMMARY OF RESULTS
The assessment provides an overview of the effects of the toll ring scheme, and the main results obtained indicate that certain pricing policies (or a combination of them) could be very useful for the city over the long term.
The estimation results for optimal values are reported in Figure 5 and are based on welfare NPV during the whole evaluation 30-year period. As we can see, the toll value optimum for the Madrid Case Study presented is41.0 for the start value in the year 2010, and42.0 for the last value in 2034; for the peak period. However, the fee for the off-peak period is zero.
and Shepherd et al. (2006), optimum road charge value for peak period is 54, but
the off-peak road charges are set at 24(fixed value instead of optimal value).
As shown in, the implementation of a toll policy produce an immediate drop in social welfare. This is due to the period of adaptation of the mobility patterns to the measure implemented. Although the cost of the measure has an immediate effect on the generalized cost—and therefore on citizen behavior—the variations in transport time deriving from the new network situations undergo a different rebalancing process, as they depend on the demand existing in each system.
This means that citizens take a period of time to adapt to the new situation of the system. This period of adaptation is considered to be one year. This has direct implications on the assessment of annual welfare surplus, as the citizens assume the cost immediately but only perceive the benefits deriving from the greater capacity of the transport system after some delay, when the system has once again found a new equilibrium.
As it was expected, car traffic entering the cordon zone is reduced at the end of the time period by 9%, during charging hours. As can be seen in Figure 6, there is a modal shift from car to PT in radial trips (periphery to center) of around 3%. This modal shift results in a PT fare revenue surplus of 22.0 M4. In addition, the
PT services. This produces time savings to PT users of497.6 M4. However, 6% of
radial car trips have changed their destination pattern, intensifying the loss of attractiveness of the CBD (see Figure 6) compared to the rest of the region.
In the case of internal CBD mobility, this scenario produces a reduction of the use of roads in the city center that reduces delays by 3%. The main consequence is more car usage by CBD residents excluded from toll charging. These dynamics may require an adaptation of the tolling scheme (it is not unusual for pricing poli-cies to change over time; Leape, 2006) or it may need to be complemented with other transport policies, such as a new parking scheme.
In Table 5, the net present value from costs and benefits (welfare surplus regard-ing scenario A0) generated by the Madrid city center road charge are presented within the framework described above. It is important to highlight the significant time savings, and even more so compared to the costs of externalities linked to environmental impact (pollution and CO2 emissions). The increase in the accident rate caused by speed increases in the charging area leads to higher accident costs.
Revenues from fuel duties are reduced due to the decrease in car use, even though the average distance traveled by car is higher, but this demand (in vehkm) increase is much less than the vehkm saved with the reduction of Figure 6. Percentage of car and PT trips among all motorized trips entering
trips. Fuel consumption per kilometer decreases because speed increases within the range where fuel consumption is still a decreasing function of speed. Car usage reduction (vehkm saved) implies a lower road maintenance cost (þ2.9 M4), and this, added to the higher fuel consumption efficiency, generates a reduction in fuel duty incomes for Government.
NPV obtained is highly dependent on social discount ratio (4.8%). This ratio is higher to discount ratios assumed in UK (3.5%; Shepherd et al. 2006). This means that long-term potential benefits are underestimated against short-term, which may jeopardize final social welfare surplus if costs of construction and maintenance are included in the analysis with a 4.8%discount rate. The study presented hasn’t opti-mized the objective function with a finance constraint, though this may be possible. Even though main objective of the toll scheme is not to collect money but to reduce car pressure and congestion in the center, the pricing policy generates a significant positive present value of finance (þ736 M4) which may lead to
promote complementary measures. This integrated strategies may generates benefits greater than the sum of their individuals (May et al. 2006).
As this measure has been implemented locally within the Madrid region (0.52% of the total area of Madrid and 25% of the total motorized trips), the impact on land-use patterns (housing and workplace response) is fairly limited, and its impact is almost unnoticeable.
The results obtained show the relatively minor importance of environmental externalities compared to the social costs (accidents) and time-saving benefits using a CBA approach. This approach may therefore not be the most appropriate method for urban transport policy planning under a sustainability framework (Satoh and Lan, 2007). The results obtained from this approach do not lead to a sustainable scenario when the efficiency of the network is a priority.
5. CONCLUSIONS
The proposed method stems from the need of transport policy decision-makers to establish the best strategy to be implemented in order to maximize the city’s wel-fare. The process described involves fixing an appropriate toll charge to be assigned in an urban cordon charge scheme in order to maximize social welfare. The optimal toll charge is estimated in terms of the potential social surplus imposed on users, administration or externalities, compared with the alternative do-nothing scenario over a period of 30 years. Land-use and transport dynamics are also considered.
Powell’s direct optimization method has proved to be an adequate and rapid convergence method for the problem tackled. The benefits of this method are its easy integration with the model, its rapid convergence and the fact that it does not require explicit computation of the function’s gradient (Press et al. 2007), which is unavailable due to the complexity of the OF. The results show that the optimization process is robust and can be applied to different objectives.
Comparison to other CBA results directly is not possible as the models were set up with different study areas and different populations. Pricing policies are there-fore applied to different populations. Added to above, net present value obtained is highly dependent on social discount rate. In this exercise, a rate of 4.8% was implemented, notably higher than other studies where a 3.5% discount rate was taken (Leape, 2006; Shepherd et al. 2006; May et al. 2006). On the other hand, main contribution to positive welfare on a CBA approach is trip time saved. Thus, lower value of time assumed compared to UK’s models may lead to a lower congestion charge.
However, common results are obtained with the introduction of road charging schemes: car users journey times are reduced, public transport users and public transport authority are beneficiaries as well.
Thus, result obtained confirms the objectives pursued by the measure: low car use in sensitive areas such as the CBD. However, in the absence of complementary measures, other impacts should be considered: for example there is an increase in internal mobility by car due to the capacity released by citizens who have ceased to travel by car to the CBD. This effect is largely limited by the fact that these are areas of high accessibility and service by public transport, but in any case it is the substi-tution effect which it would be useful to consider. In the same way, there is zonal redistribution of trips towards the peripheral areas. Transversal and orbital mobility increases compared to radial mobility. This effect, although limited, induces a mobility which -in view of the configuration of the transport system in Madrid- is not susceptible to being captured by the collective transport system.
Another point to highlight is that there is an increase in speed in the road trans-port system due to the reduction in congestion. This not only has an effect on car users but also on public transport users who share the roads with cars.
We have assumed that the location of the toll ring scheme is the best, however other studies have demonstrated that the performance of cordon schemes is critically dependent on cordon location (May et al. 2002); although, this is another optimization problem, that is beyond the scope of this article.
The greatest social benefits appear to be linked mostly to decreased congestion, and to the revenues generated which can be allocated to the improvement of other aspects of transportation. Environmental aspects are not assigned a significant value under the optimum scenario, which may indicate that the assessment method and the CBA-based objective function prioritize the efficiency of the network itself, rather than other aspects of sustainability (social and environmental issues). This suggests that further research should be undertaken in order to define a better OF that will allow for the attainment of scenarios deemed more sustainable.
To achieve this, further research should focus partially on improving the CBA assessment approach for the OF. A multicriteria analysis (MCA) approach appears to represent a step forward in making the optimization model correspond more closely to the sustainability principle, according to the dimensions of socially sustainable urban transportation described in Boschmann and Kwan (2008).
entire period of evaluation, although the measure is defined by a start and ending value. This means that the total social surplus achieved every year is taken into account. Making each period of time independent can generate a different policy configuration than the one currently obtained.
Finally, the results obtained show that other transport and mobility management measures should be coordinated and implemented with the toll scheme in order to obtain higher levels of sustainability, especially when the measures implemented generate an income surplus for the transport operators.
In view of this, the optimization process presented should also be applied to define not just an isolated measure (toll ring scheme) but the optimum level of an entire group of different measures which may generate important synergies for reaching sustainable scenarios. Without questioning the fact that to achieve efficiency, car users should pay for the true costs of their actions (such as pollution or congestion taxes), we have found sufficient evidence in the literature to demon-strate that many other policy instruments can be used in combination with taxes and permits to ensure that the transport needs of the present generation can be met without compromising the ability of future generations to meet any needs of their own (Santos, Behrendt, and Teytelboym, 2010).
ACKNOWLEDGMENTS
We gratefully acknowledge the financial support from the Spanish Ministerio de Ciencia e Innovacio´n (project TRA2008-06682).
REFERENCES
Bickel P, Friedrich R, Burgess A, Fagiani P, Hunt A, De Jong G, Laird J, et al. 2005. Developing Harmonized European Approaches for Transport Costing and Project Assessment. Stuttgart: European Commission, Directorate General Energy and Transport. Boschmann EE, Kwan M. 2008. Toward socially sustainable urban transportation: Progress
and potentials. International Journal of Sustainable Transportation 2:138–157. Brent RP. 1973. Algorithms for Minimization without Derivatives. Toronto: Prentice-Hall. Buehler R, Pucher J. 2011. Sustainable Transport in Freiburg: Lessons from Germany’s
Environmental Capital. International Journal of Sustainable Transportation 5:43–70. Coyle G. 2000. Qualitative and quantitative modeling in system dynamics: Some Research
Questions. System Dynamics Review 16:225–244.
CRTM. 2004. Patterns of Mobility in Metropolitan Madrid. Madrid: Consorcio Regional de Transportes de Madrid.
Dangerfield B, Roberts C. 1999. Optimization as a statistical estimation tool: An example in estimating the AIDS treatment-free incubation period distribution. System Dynamics Review 15:273–291.
de la Hoz D, Guzma´n LA, Pfaffenbichler PC, Shepherd SP. 2008. Fuel tax levels necessary to achieve the agreed reduction targets of CO2 emissions: The case of Madrid. In: Rauch S, Morrison GM, Monzo´n A (ed.), Highway and Urban Environment. Madrid: Springer, pp. 377–386.
Eliasson J. 2009. A cost–benefit analysis of the Stockholm congestion charging system. Transportation Research Part A 43:468–480.
Emberger G, Shepherd SP, May AD. 2008. The effects of appraisal methodology on the specification of optimal urban transport strategies. International Journal of Sustainable Transportation 2:58–75.
Ferrari P. 2002. Road network toll pricing and social welfare. Transportation Research Part B 36:471–483.
Gupta S, Kalmanje S, Kockelman KM. 2006. Road pricing simulations: Traffic, land use and welfare impacts for Austin, Texas. Transportation Planning and Technology 29:1–23. Guzma´n LA, de la Hoz D. 2009. Urban concentration: Towards a new culture of mobility.
Revista Carreteras 167.
Haghani A, Lee SY, Byun JH. 2003a. A system dynamics approach to land use=transportation system performance modeling. Part I: Methodology. Journal of Advanced Transportation 37:1–41.
Haghani A, Lee SY, Byun JH. 2003b. A system dynamics approach to land use=transportation system performance modeling. Part II: Application. Journal of Advanced Transportation 37:43–82.
INE. 2010. Instituto de Estadı´stica de la Comunidad de Madrid Web Site. Madrid: Instituto de Estadı´stica de la Comunidad de Madrid. www.ines.es
Lauridsen H. 2011. The impacts of road tolling: A review of Norwegian experience. Transport Policy 18:85–91.
Leape J. 2006. The London congestion charge. The Journal of Economic Perspectives 20:157–176.
Levinson DM, Kumar A. 1994. The rational locator: Why travel times have remained stable. Journal of the American Planning Association 60:319–332.
Li Z-C, Lam WHK, Wong SC, Sumalee A. 2012. Environmentally sustainable toll design for congested road networks with uncertain demand. International Journal of Sustainable Transportation 63:127–155.
Light T. 2009. Optimal highway design and user welfare under value pricing. Journal of Urban Economics 66:116–124.
Litman T. 2006. London Congestion Pricing, Implications for Other Cities. Victoria: Victoria Transport Policy Institute.
Liu S, Triantis KP, Sarangi S. 2010. A framework for evaluating the dynamic impacts of a congestion pricing policy for a transportation socioeconomic system. Transportation Research Part A 44:596–608.
May AD, Kelly C, Shepherd S. 2006. The principles of integration in urban transport strategies. Transport Policy 13(4):319–327.
May AD, Liu R, Shepherd S, Sumalee A. 2002. The impact of cordon design on the performance of road pricing schemes. Transport Policy 9(3):209–220.
May AD, Shepherd SP, Timms PM. 2000. Optimal transport strategies for European cities. Transportation 27:285–315.
Mayhew L, Hyman G. 2002. Optimizing the benefits of urban road user charging. Transport Policy 9:189–207.
Miller JH. 1998. Active nonlinear tests (ANTs) of complex simulation models. Management Science 44:820–830.
Monzo´n A, Fernandez A, Jorda´ P. 2008. Environmental costs account: A base for measuring sustainability in transport plans. In: Rauch S, Morrison GM, Monzo´n A (ed.), Proceed-ings of the 9th Highway and Urban Environment Symposium. Madrid: Springer, pp. 23–30.
Pfaffenbichler PC, Emberger G, Shepherd SP. 2008. The integrated dynamic land use and transport model MARS. Networks and Spatial Economics 8:183–200.
Pfaffenbichler PC, Shepherd SP. 2003. A dynamic model to appraise strategic land-use and transport policies. European Journal of Transport and Infrastructure Research 2: 255–283.
Powell MJD. 1964. An efficient method for finding the minimum of a function of several variables without calculating derivatives. The Computer Journal 7:155–162.
Press WH, Teukolsky SA, Vetterling WT, Flannery BP. 2007. Numerical recipes: The art of scientific computing. Cambridge, UK: Cambridge University Press.
Qian Y, Zhong Y, Yuan J. 2006. Investigating traffic congestion in Shanghai: A system dynamics approach. International Journal of Services Operations and Informatics 1:363–379.
Ramjerdi F, Minken H, Østmoe K. 2004. Norwegian urban tolls. Road pricing: Theory and evidence. Research in Transportation Economics 9:237–249.
Rich J, Nielsen OA. 2007. A socio-economic assessment of proposed road user charging schemes in Copenhagen. Transport Policy 14:330–345.
Rotaris L, Danielis R, Marcucci E, Massiani J. 2010. The urban road pricing scheme to curb pollution in Milan, Italy: Description, impacts and preliminary cost–benefit analysis assessment. Transportation Research Part A 44:359–375.
Safirova E, Gillingham K, Parry I, Nelson P, Harrington W, Mason D. 2004. Welfare and distributional effects of road pricing schemes for metropolitan Washington DC. Research in Transportation Economics 9:179–206.
Safirova E, Houde S, Lipman DA, Harrington W, Baglino A. 2006. Congestion pricing: Long-term economic and land-use effects. Washington, DC: Resources for the Future. Salling KB Leleur S. 2011. Transport appraisal and Monte Carlo simulation by use of
the CBA-DK model. Transport Policy 18(1):236–245.
Santos G, Behrendt H, Teytelboym A. 2010. Part II: Policy instruments for sustainable road transport. Research in Transportation Economics 28:46–91.
Santos G, Li WW, Koh WTH. 2004. Transport policies in Singapore. Research in Transportation Economics 9:209–235.
Satoh K, Lan LW. 2007. Development and deployment of sustainable transportation. International Journal of Sustainable Transportation 1:69–71.
Shepherd SP, Zhangb X, Emberger G, Huds M, May AD, Paulley N. 2006. Designing optimal urban transport strategies: The role of individual policy instruments and the impact of financial constraints. Transport Policy 13:49–65.
Souto Nieves G. 2003. Discount Rates for the Evaluation of Public Investment: Estimations for Spain. Barcelona: Direccio´n General de Investigacio´n de la Generalitat de Catalunya. Sterman JD. 2000. Business Dynamics: Systems Thinking and Modeling for a Complex
World. Boston: Irwin=McGraw-Hill.
Sugden R. 1999. Developing a Consistent Cost–Benefit Framework for Multimodal Transport Appraisal. Report to the Department of the Environment, Transport and the Regions. London: Department for Transport.
Timms PM, May AD, Shepherd SP. 2002. The sensitivity of optimal transport strategies to specification of objectives. Transportation Research Part A 36:383–401.
Vold A. 2005. Optimal Land Use and Transport Planning for the Greater Oslo Area. Transportation Research Part A 39:548–565.
Zhang X, Paulley N, Hudson M, Glyn R. 2006. A Method for the Design of Optimal Transport Strategies. Transport Policy 13:329–338.
![Table 4. Surplus A1=A0 of the Madrid road charge scheme for the optimal toll value [NPV M4]](https://thumb-us.123doks.com/thumbv2/123dok_es/6796259.832805/11.756.102.645.468.857/table-surplus-madrid-road-charge-scheme-optimal-value.webp)