DESIGN ENERGY SPECTRA FOR TURKEY
F. López-Almansa
Technical University of Catalonia, Barcelona, Spain
A.U. Yazgan
Technical University of Catalonia, Barcelona, Spain
A. Benavent-Climent
University of Granada, Spain
SUMMARY:
This work proposes design energy spectra in terms of velocity, derived through linear dynamic analyses on Turkish registers and intended for regions with design peak acceleration 0.3 g or higher. In the long and mid period ranges the analyses are linear, taking profit of the rather insensitivity of the spectra to the structural parameters other than the fundamental period; in the short period range, the spectra are more sensitive to the structural parameters and nonlinear analyses would be required. The selected records are classified in eight groups according to the design input acceleration, the soil type, the earthquake magnitude and the near-source effects. For each of these groups, median and characteristic spectra are proposed (50% and 95% percentiles). These spectra have an initial linear growing branch in the short period range, a horizontal branch in the mid period range and a descending branch in the long period range.
Keywords: design energy spectra, input energy, linear time history analysis, Turkey
1. INTRODUCTION
In conventional earthquake-resistant design of buildings (and other constructions) the dynamic effect of the input is represented by static equivalent forces, which are obtained from acceleration response spectra defined as the ratio between the peak ground acceleration (PGA) and the maximum absolute acceleration in the top of the building. This approach presents several drawbacks: (i) these equivalent forces are strongly coupled to the elastic and hysteretic characteristics of the structure, thus making the seismic design cumbersome, (ii) after the onset of yielding, the correlation between the design forces and the structural damage is rather low, and (iii) the damage caused by the cumulative inelastic excursions is not accounted for. More recently, the displacement-based design procedures have been proposed [Priestley, Calvi, Kowalsky, 2007]; in these strategies, the dynamic effect of the input is represented by imposed displacements, that are obtained from displacement response spectra relating the PGA to the maximum relative displacement in the top of the building. This formulation uncouples partially the input effect in terms of displacement from the characteristics of the structure and allows a satisfactory correlation between the imposed displacement and the structural damage. Conversely, the cumulative component of damage cannot be appropriately considered. A more rational seismic design approach, which overcomes also this difficulty, is to express the dynamic input effect through energy response spectra. This approach has three major advantages: (i) the input effect in terms of energy and the structural resistance are basically uncoupled, (ii) except in the short period range, the input energy, EI, introduced by a given
between the energy absorption capacity of the structure (i.e. its seismic resistance) and the input energy (i.e. the effect of the ground motion). It is then necessary to establish the input energy spectrum corresponding to the expected earthquake, i.e. design input energy spectrum.
This work consists of proposing energy spectra for earthquake-resistant design based on accelerograms registered in high seismicity regions of Turkey. The spectra have been derived through linear dynamic analyses on the selected Turkish accelerograms. In the long and mid period ranges the analyses are linear, taking profit of the rather low sensitivity of the spectra to the structural parameters other than the mass and the fundamental period. Conversely, in the short period range, the spectra are more sensitive to the structural parameters and, hence, the analyses should to be nonlinear.
The considered registers are selected among those available in Turkey. The chosen records are treated (base-line correction and filtering) and classified according to the design input acceleration (e.g. the seismic zone), the soil type of the seismic station (following the classification of the Eurocode 8), the magnitude of the earthquake and the relevance of the near-source effects, namely the velocity pulses. The design energy spectra are envelopes of the actual spectra, in terms of (relative) velocity, corresponding to each input (pair of horizontal components); the influence of the vertical components has been disregarded. These derived spectra have an initial growing branch (starting from zero) in the short period range, a horizontal branch in the mid period range and a descending branch in the long period range. Median and characteristic spectra are proposed; regardless of the statistical distribution of the spectral ordinates, such levels are intended to correspond to 50% and to 95% percentiles, respectively.
2. SEISMIC DESIGN BASED ON INPUT ENERGY SPECTRA
The equation of motion of a SDOF system subjected to a horizontal ground motion is given by:
g )
(y m z
Q y c y
m+ + =− (1)
In equation (1) m is the mass, c is the damping coefficient, Q(y) is the restoring force, y is the relative displacement, and zgis the ground acceleration. Multiplying equation (1) by dy= ydt
and integrating along the duration of the earthquake gives the energy balance equation
I a ζ
k
E
E
E
E
+
+
=
(2)In equation (2), Ek is the relative kinetic energy, Eζ is the energy dissipated by the inherent
damping, Ea is the energy absorbed by the spring, and EI is the relative input energy:
2
k ymydt ½my
E =
∫
= E
ζ=
∫
c
y
2dt
Ea=∫
Q(y)ydtE
I=
−
∫
m
z
gy
dt
(3)EI can be normalized by the mass m and expressed in terms of equivalent velocities VE:
m
E
V
E=
2
I/
(4)For a given ground motion, the relationship between the input energy EI expressed in terms of
the equivalent pseudo-velocity VE and the natural period of the system, T, is defined as the
design energy input spectrum for a given region from the individual energy input spectra obtained for each available ground motion record:
1. Calculate the energy input spectrum, VEvs. T corresponding to an elastic SDOF system with
10% damping (ζ = 0.10) for each ground motion recorded in the region, by quadratic combination of the energy input, in terms of pseudo-velocity, obtained for the north-south,
VE,NS, and east-west, VE,EW, horizontal components through linear dynamic response
analyses, according to equation (3).
2. Draw a two piecewise bilinear envelope of the VE vs. T curves. The first line goes through
the origin and envelops the energy input spectra in the short period. The second line is horizontal and represents the energy input in the medium/high period range.
3. Multiply the slope of the first line by 1.20 to take into account the fact that in the short period range, the lengthening of the vibration period associated with the plastification of the structure tends to increase the input energy.
It is worth emphasizing that the energy input spectrum obtained elastically is also valid for inelastic systems because the total energy input is scarcely affected by the strength and plastification level of the system, as pointed out in the Introduction. This work considers a similar approach for proposing design input energy spectra. It consists of performing the linear analyses of the first step of the Akiyama’s approach while the second and third steps are modified. In the second step there are two major modifications: (i) two envelopes are proposed, corresponding to median and characteristic values, respectively, and (ii) the envelopes are not bilinear but contain also a descending branch in the long period range.
3. TURKISH REGISTERS
A dataset from 1976 to 2006 [Akkar et al. 2010] constitutes the main base for this work. It covers 4203 registers from 2818 seismic events; such accelerograms have been recorded in 327 stations. Within the aforementioned 4203 registers, 1320 ones corresponding to earthquakes with Mw > 4 are selected; among them, 540 high quality waveform registers from 131
earthquakes are kept. Among them, 149 registers with PGA ≥ 0.01 g corresponding to 80 earthquakes have been finally kept for this study. The highest moment magnitude is 7.6, Kocaeli earthquake (17/08/1999). The latest earthquakes of Kütahya-Simav (19/05/2011) and Van-Muradiye-Merkez (23/10/2011) have been also incorporated; from the Kütahya-Simav 17 registers have PGA ≥ 0.01 g are kept while from the Van-Muradiye-Merkez 4 registers with PGA ≥ 0.01 g have been also added. Finally, 169 registers corresponding to 82 seismic events and being recorded in 90 stations are considered in this study. Every register contains horizontal (NS and EW) and vertical accelerograms; vertical components are disregarded.
The severity of the earthquakes is characterized by the local, moment and surface magnitudes, denoted by ML, MW, and MS, respectively. The soil is classified in: soft soil, stiff soil and rock.
When the shear wave velocity averaged in thetop 30 m (vs,30) is available (in 175 stations), the
classification is based on that parameter; soft soil, stiff soil, and rock sites correspond to 180 m/s < vs,30 < 360 m/s, 360 m/s < vs,30 < 800 m/s and vs,30 > 800 m/s, respectively. In the EC-8 [EN
1998 2004], these three categories correspond to ground types C, B and A, respectively; no stations with vs,30 < 180 m/s exist, hence, this study does not cover soil types D and E. In 5
stations the soil classification is not based on vs,30 and in 13 stations (corresponding to 13
max g max g
2 g D
z z
dt z I
∫
= (5)
The integral extends to the ground motion bracket duration. Impulsive ground motions show typically low values of ID (say, less than 10) whereas non-impulsive ground motions exhibit
large ID (say, greater than 10).
The registers are treated with baseline correction and with bi-directional, zero-shift (“acausal”), 4th-order Butterworth filtering. The purpose of the band-pass filtering is to remove long-period and short-period noise. The low and high-cut frequencies are decided case by case by an iterative procedure, carried out on the Fourier spectra, until the resulting velocity and displacement traces are considered as visually acceptable. The low-cut frequency ranges generally in between 0.05 and 0.5 Hz (2 and 20 s) and the high-cut frequency ranges in between 15 and 40 Hz (0.067 and 0.025 s).
For the proposal of design energy spectra, the registers are classified in 12 groups according to the following issues:
Soil type. The three aforementioned soil types (rock / stiff soil / soft soil) are considered.
Magnitude of the earthquake. The Eurocode 8 [EN 1998 2004] proposes two different design spectra, termed as Type 1 and Type 2; since they correspond to registers from earthquakes with surface magnitude higher and smaller than 5.5, respectively, the registers are classified in those arising from earthquakes with Ms > 5.5 and Ms≤ 5.5.
Near-fault effects. Impulsive and vibratory registers are separately considered; as discussed after equation (5), such categories correspond to ID≤ 10 and to ID > 10, respectively.
Given the scarcity of results corresponding to rock, only stiff soil and soft soil are considered; therefore, 8 groups of registers are finally analysed: stiff soil / soft soil, Ms > 5.5 / Ms≤ 5.5 and
impulsive / vibratory. However, for rock, some incomplete results about design spectra are also proposed; the lack of seismic information for Turkey is partially compensated by the one provided by other sources.
4. PROPOSAL OF DESIGN INPUT ENERGY SPECTRA
This section describes the proposal of linear design input energy spectra in terms of velocity, VE.
These spectra are derived from linear dynamic analyses for the considered registers. As indicated in the Introduction, in the mid and long period ranges the input energy is a rather stable quantity that is primarily governed by the total mass and fundamental period T of the structure, being scarcely affected by its strength or hysteretic properties; therefore, in these period ranges the linear spectra can be also used for nonlinear design. Conversely, in the short period range the energy spectral ordinates are not as clearly independent on the resistance and the hysteretic behavior; therefore, nonlinear dynamic analyses should be carried out. The spectra are proposed for each of the aforementioned eight groups (stiff soil / soft soil, impulsive / vibratory, Ms > 5.5 / Ms≤ 5.5); given the scarcity of registers out of the seismic zone 1 (see
Given the proportionality between the relative velocity spectra and the VE spectra, the proposed
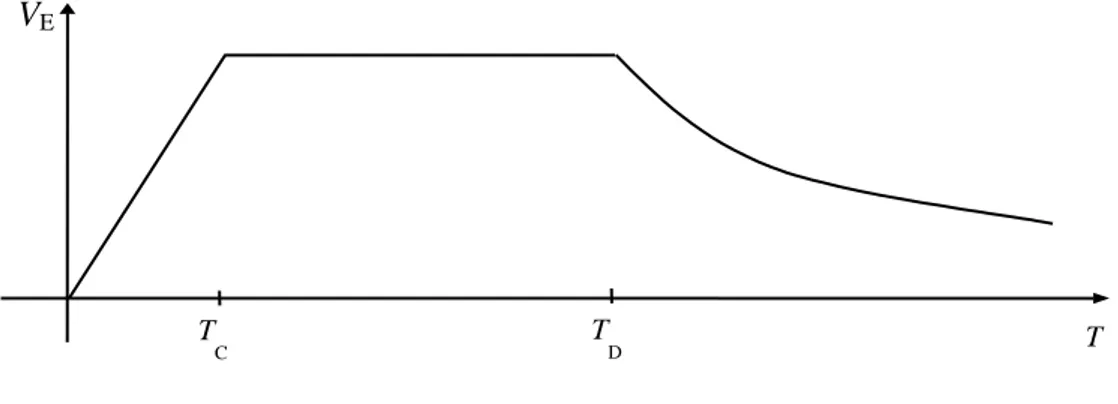
spectra are expected to be basically shaped as the result of multiplying the design acceleration spectra proposed by the Eurocode 8 [EN 1998 2004] by factor T / 2 π. Therefore, these spectra have three branches, corresponding roughly to the short, medium and long period ranges, respectively; the first branch is linear starting from zero, the second branch is constant, and the third branch is decreasing. Figure 1 shows a sketch of such a spectrum; TC and TD are the corner
periods separating the aforementioned three branches.
Figure 1. Proposed linear VE design spectra
In Figure 1 the descending branch (for T≥TD) follows the equation
a
T
T
V
V
=
max DE
E (6)
In equation (6),
V
Emax is the spectral ordinate of the plateau and a is an exponent. Figure 1 and equation (6) show that every linear proposed spectrum is characterized by the periods TC and TD,by the plateau ordinate
V
Emax and by theexponent a.The proposal of the linear design input energy spectra in terms of velocity (VE) in the range of
periods 0 – T consists of deriving separately normalized spectra (VE / ǁVEǁT) and spectral factors
(ǁVEǁT); the proposed VE design spectra are obtained by multiplying the normalized spectra by
the spectral factors. The norm ǁVEǁT is defined as the integral of the VE spectrum:
∫
=
TV
dT
V
0 E T
E (7)
The normalized spectra are obtained from the linear analyses carried out on the considered Turkish registers. However, given the scarcity of available strong inputs, the spectral factors are obtained from the Turkish recordings only in the group where the inputs are more demanding (“Soft Soil / Ms > 5.5/ Impulsive”); in the other groups the available registers are too small, and
this lack of seismic information is complemented with the information provided by other studies [Decanini, Mollaioli 1998] and by some of the major design codes [EN 1998 2004; BSL 2009; UBC 1997]. The linear analyses consist of determining the value of EI in equation (3) for SDOF
systems with damping factor ζ = 0.10 and for natural periods T ranging in between 0.02 and 8 s.
V
ET
C
T
The criteria for estimating, for each of the aforementioned eight groups (section 3), the values of the parameters TC, TD, max(VE / ǁVEǁT) and a that characterize every normalized spectrum are
described next.
Period TC. For each of the aforementioned eight groups, the procedure to estimate the median and characteristic values of the corner period TC consists of the following
consecutive steps: (i) for each individual normalized spectrum, TC is initially defined as the
intersection between their initial (linear, starting from the origin) and maximum (horizontal) envelopes; (ii) for all the individual normalized spectra considered in this group, the median and characteristic values of such TC periods are determined; (iii) the initial median and
characteristic branches are finally obtained by joining the origin and the points of the abovementioned maximum linear envelopes that correspond to the median and characteristic values of TC, respectively.
Period TD. Given that the Eurocode 8 proposes separate design spectra for registers corresponding to Ms > 5.5 and to Ms≤ 5.5 (Type 1 and Type 2, respectively) and that in
both cases the values of TD do not depend on the soil type, we have tried to preserve these
features in this study. Eurocode 8 states TD = 2 s and TD = 1.2 s for Type 1 and Type 2
spectra, respectively; in this study values TD = 1.6 s and TD = 0.9 s have provided better fits
and are adopted for registers corresponding to Ms > 5.5 and to Ms≤ 5.5, respectively.
Remarkably, these values are considered regardless of the soil type and the near-source effects; as well, no distinction is made between median and characteristic spectra.
Plateau ordinate max(VE / ǁVEǁT). For each of the aforementioned eight groups (section 3), the maximum normalized spectral ordinates are estimated, in the range TC– TD, as the
average of the median and characteristic values of the normalized spectra. In this operation the spectra that came from individual spectra with smallest norms have been disregarded.
Exponent a. For each of the aforementioned eight groups (section 3), the exponent a is determined as providing the best fit, in the range TD– T.
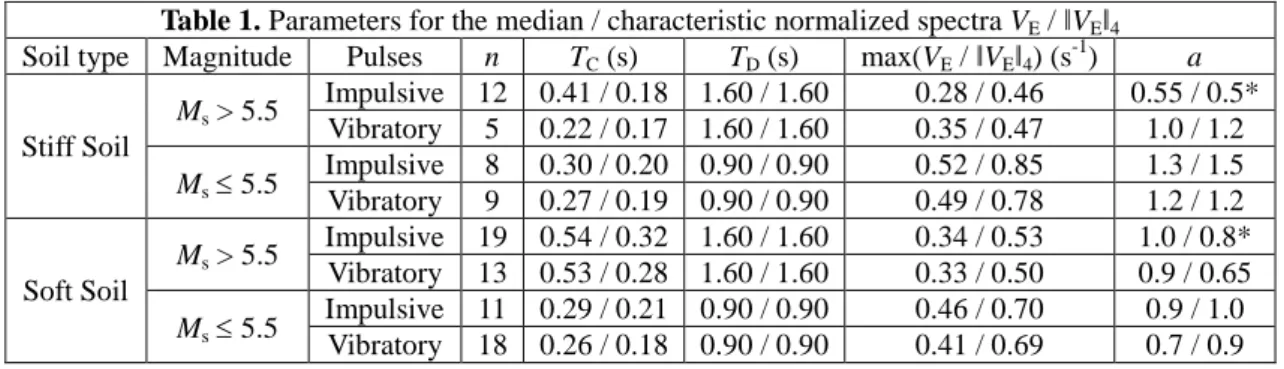
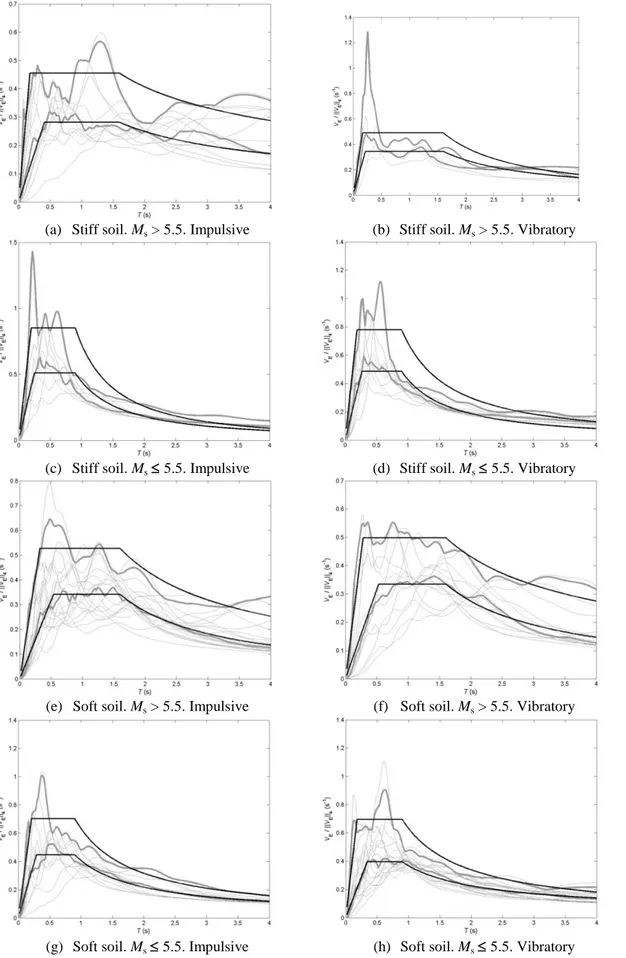
Since most of the civil engineering constructions correspond to periods not exceeding 4 s, in this study T = 4 s, i.e. the proposed design spectra are limited to the range 0 – 4 seconds. However, the linear dynamic analyses have been carried out along the interval 0 – 8 seconds; when relevant peaks have been detected for periods 4 < T < 8 seconds, this information has been considered for modifying the descending branch. For each of the aforementioned eight groups (section 3),Table 1 shows the actual number of the considered registers (n) and the values of the parameters TC, TD, max(VE / ǁVEǁT) and a for the median / characteristic VE / ǁVEǁ4 normalized
spectra; Figure 2 displays those spectra. Each of the eight groups of plots inside Figure 2 contains the individual normalized spectra, the median and characteristic ones and the proposed (smoothed) median and characteristic normalized spectra.
Table 1. Parameters for the median / characteristic normalized spectra VE / ǁVEǁ4
Soil type Magnitude Pulses n TC (s) TD (s) max(VE / ǁVEǁ4) (s-1) a
Stiff Soil
Ms > 5.5
Impulsive 12 0.41 / 0.18 1.60 / 1.60 0.28 / 0.46 0.55 / 0.5* Vibratory 5 0.22 / 0.17 1.60 / 1.60 0.35 / 0.47 1.0 / 1.2
Ms≤ 5.5
Impulsive 8 0.30 / 0.20 0.90 / 0.90 0.52 / 0.85 1.3 / 1.5 Vibratory 9 0.27 / 0.19 0.90 / 0.90 0.49 / 0.78 1.2 / 1.2
Soft Soil
Ms > 5.5
Impulsive 19 0.54 / 0.32 1.60 / 1.60 0.34 / 0.53 1.0 / 0.8* Vibratory 13 0.53 / 0.28 1.60 / 1.60 0.33 / 0.50 0.9 / 0.65
Ms≤ 5.5
Impulsive 11 0.29 / 0.21 0.90 / 0.90 0.46 / 0.70 0.9 / 1.0 Vibratory 18 0.26 / 0.18 0.90 / 0.90 0.41 / 0.69 0.7 / 0.9
(a) Stiff soil. Ms > 5.5. Impulsive (b) Stiff soil. Ms > 5.5. Vibratory
(c) Stiff soil. Ms≤ 5.5. Impulsive (d) Stiff soil. Ms≤ 5.5. Vibratory
(e) Soft soil. Ms > 5.5. Impulsive (f) Soft soil. Ms > 5.5. Vibratory
(g) Soft soil. Ms≤ 5.5. Impulsive (h) Soft soil. Ms≤ 5.5. Vibratory
Figure 2. Proposed normalized VE / ǁVEǁ4 design spectra
As discussed previously, the proposed VE design linear spectra are obtained by multiplying the
smoothed (three-branched) normalized spectra shown in Figure 2 by the spectral factors ǁVEǁ4.
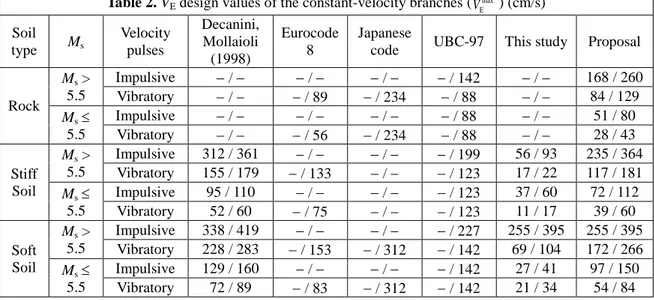
To obtain such factors, Table 2 displays the plateau ordinates
V
Emax of several VE spectra. Firstcolumn contains the spectral values described in the reference [Decanini, Mollaioli 1998] and second, third and fourth columns contain the design quantities according to the Eurocode 8 [EN 1998 2004], the Japanese code [BSL 2009] and the UBC-97 [UBC 1997], respectively; in all these codes, the design ground acceleration is 0.4 g. Last two columns exhibit the values obtained in this study and the proposed ones, respectively. Deeper descriptions of the criteria considered to select the figures shown in the first four columns in Table 2 are listed next.
Decanini, Mollaioli 1998. Those spectra were proposed after linear analyses on registers classified according to soil conditions, earthquake magnitude and source-to-site distance. Values in Table 2 have been selected to correspond to conditions similar to those in this study [Yazgan 2012]. In Table 2, left / right figures correspond to mean and to mean + standard deviation values, respectively.
Eurocode 8. The Eurocode 8 does not propose energy spectra, the VE values have been
estimated as discussed in [Yazgan 202]. The cases for magnitude higher and smaller than 5.5 correspond to Type 1 and to Type 2 spectra, respectively. The obtained quantities have been assigned to vibratory registers and to characteristic values.
BSL 2009. The spectral ordinates have been derived from the input energy design spectra proposed by the Japanese code.
UBC 1997. The input energy has been determined following the same approach than in the Eurocode 8. For earthquakes with Ms > 5.5 the values for impulsive registers are obtained
by multiplying those from the vibratory ones by factor Nv; it is assumed that Nv = 1.6.
Table 2. VE design values of the constant-velocity branches (VEmax) (cm/s)
Soil type Ms
Velocity pulses Decanini, Mollaioli (1998) Eurocode 8 Japanese
code UBC-97 This study Proposal
Rock
Ms >
5.5
Impulsive − / − − / − − / − − / 142 − / − 168 / 260 Vibratory − / − − / 89 − / 234 − / 88 − / − 84 / 129
Ms≤
5.5
Impulsive − / − − / − − / − − / 88 − / − 51 / 80 Vibratory − / − − / 56 − / 234 − / 88 − / − 28 / 43
Stiff Soil
Ms >
5.5
Impulsive 312 / 361 − / − − / − − / 199 56 / 93 235 / 364 Vibratory 155 / 179 − / 133 − / − − / 123 17 / 22 117 / 181
Ms≤
5.5
Impulsive 95 / 110 − / − − / − − / 123 37 / 60 72 / 112 Vibratory 52 / 60 − / 75 − / − − / 123 11 / 17 39 / 60
Soft Soil
Ms >
5.5
Impulsive 338 / 419 − / − − / − − / 227 255 / 395 255 / 395 Vibratory 228 / 283 − / 153 − / 312 − / 142 69 / 104 172 / 266
Ms≤
5.5
Impulsive 129 / 160 − / − − / − − / 142 27 / 41 97 / 150 Vibratory 72 / 89 − / 83 − / 312 − / 142 21 / 34 54 / 84
Fifth column in Table 2 contains the constant-velocity spectral ordinates obtained in this study for seismic zone 1 in Turkey (design ground acceleration 0.4 g); left / right figures correspond to median / characteristic values, respectively. Comparison among these quantities and the figures indicated in the previous four columns shows that only in the group “Soft Soil / Ms > 5.5
by assuming that the median / characteristic ratios are the same than in the group “Soft Soil / Ms
> 5.5/ Impulsive”. For stiff and soft soil the median values are determined according to the mean values obtained by Decanini and Mollaioli; for rock, such values are estimated by dividing those for stiff soil by 1.4 as indicated by the UBC-97 (fourth column) for earthquakes with Ms > 5.5. The proposed VE design linear spectra are shaped like the normalized spectra
shown in Figure 2 but the plateau ordinates max E
V are taken from Table 2; in other words, the
corner periods TC and TD and the exponent a are selected from Table 1 while the norm ǁVEǁ4 is
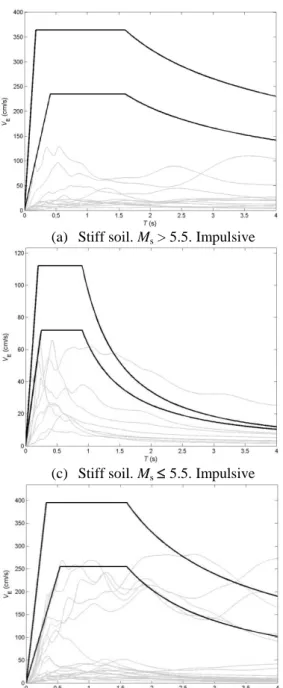
chosen according to the figures in Table 2. Figure 3 displays the proposed VE linear spectra
corresponding to stiff soil and to soft soil; for comparison, the unscaled individual spectra that have been used to derive the design ones are also plotted. For rock, the lack of available information does not allow deriving VE design spectra apart from the plateau ordinates indicated
in Table 2. The spectra drawn in Figure 3 correspond to seismic zone 1 in Turkey, whose design input acceleration is 0.4 g; in the other seismic zones of Turkey and of other countries, the design spectra can be obtained by multiplying the spectral ordinates by the ratio among the actual design acceleration and 0.4 g.
5. CONCLUSIONS
This paper presents design input energy spectra in terms of velocity obtained from linear analyses of Turkish registers. The proposed spectra have three branches: for short periods the initial branch is linear starting from zero, for intermediate periods the mid branch is constant and for long periods a descending branch is proposed. Further studies will involve nonlinear analyses leading to the proposal of nonlinear spectra and of approximate criteria for estimating the ratio between the hysteretic and the input energy.
AKCNOWLEDGEMENT
This work has received financial support from the Spanish Government under projects CGL2008-00869/BTE, CGL2011-23621, BIA2008-00050 and BIA2011-26816 and from the European Union (Feder).
REFERENCES
Akiyama H. (1985). Earthquake-resistant limit-state design for buildings, University of Tokyo Press, Tokyo.
Akkar, S., Çagnan, Z., Yenier, E., Erdogan, Ö., Sandıkkaya, M.A., Gülkan, P. (2010). The recently compiled Turkish strong motion database: preliminary investigation for seismological parameters. Journal of Seismology 14(3), 457-479.
BSL. The Building Standard Law of Japan. (2009). The Building Center of Japan, Tokyo. (English version on CD available in http://118.82.115.195/en/services/publication.html).
Decanini, L.D., Mollaioli, F. (1998). Formulation of Elastic Earthquake Input Energy Spectra, Earthquake Engineering and Structural Dynamics, 27 1503-1522.
EN 1998. (2004). Eurocode 8. Design of structures for earthquake resistance. European Committee for Standarization.
Manfredi, G. (2001). Evaluation of seismic energy demand, Earthquake Engineering and Structural Dynamics, 30 485-499.
Priestley, M.J.N., Calvi, G.M.,. Kowalsky, M.J (2007). Displacement-Based Seismic Design of Structures, IUSS Press.
TSC 2007. (2007). Turkish Seismic Code. Specification for Buildings to be constructed in Seismic Zones. Ministry of Public Works and Settlement Turkey.
UBC (1997). Uniform Building Code. International Council of Building Officials.
(a) Stiff soil. Ms > 5.5. Impulsive (b) Stiff soil. Ms > 5.5. Vibratory
(c) Stiff soil. Ms≤ 5.5. Impulsive (d) Stiff soil. Ms≤ 5.5. Vibratory
(e) Soft soil. Ms > 5.5. Impulsive (f) Soft soil. Ms > 5.5. Vibratory
(g) Soft soil. Ms≤ 5.5. Impulsive (h) Soft soil. Ms≤ 5.5. Vibratory