Experimental Rotordynamics and
Flow
Visualization Approach for Periodically Reversed
Flows
of a Francis-Type Pump-Turbine in
Generating Mode at Off-Design Operating
Conditions
PROYECTO DE GRADO
PARA LA OBTENCIÓN DEL TÍTULO DE MAGISTER EN
INGENIERÍA
POR
Sebastián Guzmán Díaz
Introduction
The flow instability phenomena in the turbo machinery are a long standing problem of widely research and application. There are several sources of flow disturbances that might cause flow instabilities found in the rotor vibration signals resulting in several responses of rotor to different kinds of excitation. These instabilities, in this case rotating-stall (RS), can cause critical operating conditions with strong dynamic loading on the machines. Earlier investigations point out that RS phenomenon is still obscure and that further research is necessary to reveal its flow dynamics.
This project presents a series of experiments designed to investigate the fluid mechanism and behavior of RS phenomenon. This unsteady stalling behavior was studied in a reduced scale pump-turbine model in generating mode instrumented with flow pressure measurements, proximity probes, keyphasor signal, and high speed tuft visualization; also, specific image processing techniques were performed to investigate the flow and rotor dynamic at operating points under RS condition.
Notations
Latin
Greek
̃ Pressure fluctuation coefficient [-] Reference diameter of the impeller [m]
Specific hydraulic energy [J/kg]
Gravitational acceleration [m/s2]
Hydraulic head [m]
Number of impeller blades [-]
Pump-turbine speed factor [-]
Number of guide vanes [-]
Discharge [m3/s]
Discharge factor [-]
Torque [Nm]
Torque factor [-]
Guide vanes opening [deg]
Γ Coherence [-]
Impeller rotational velocity [rad/s]
Flow Visualization Approach for Periodically
Reversed Flows
Francisco Botero1, Sebastian Guzmán1, Vlad Hasmatuchi2, Steven Roth2, Mohamed Farhat2
1 EAFIT University
Carrera 49 N° 7 Sur - 50, Medellín, Colombia
2 Laboratory for Hydraulic Machines École Polytechnique Fédérale de Lausanne
Avenue de Cour 33 bis, CH-1007 Lausanne, Switzerland
Abstract: Anon-conventional tufting visualization method along with an image processing development and specific applied technique adapted to the flow conditions is proposed and implemented on a reduced scale model of a Francis-type reversible pump-turbine in three different turbine stages such as turbine mode, runaway mode and turbine break mode, in order to visualize rotating stall phenomenon. Fluorescent monofilament wires along with high speed image processing and pressure sensors were installed in the narrow and vane less gap between the impeller blades and guide vanes. Pressure fluctuations were analyzed along with tuft visualization to describe the flow with and without rotating stall.
Keywords: Rotating-Stall, Francis-type pump-turbine, Tuft Visualization.
1
Introduction
The flow visualization techniques have been employed in the last 500 years as an experimental study tool of the flow behavior and the phenomena taking place in the interior of the hydraulic machines [1] , e.g. turbines, pumps, compressors, to name just a few. Despite it is one of the many available tools in experimental fluid mechanics, is one of the most used because it renders many of the flow field properties directly available to visual perception [2]. Now days a wide variety of techniques to visualize fluid flows are well known and employed in diverse hydraulic machines. Zobeiri [3] performed a velocity survey via Particle Image Velocimetry (PIV) and Laser Doppler Velocimetry (LDV) to study the effect of a hydrofoil trailing edge shape. Sinha et al [4] used PIV to investigate the onset and development of rotating-stall within a centrifugal pump. Navæi [5] developed an experimental Acoustic PIV, measuring the temporal variation in the velocities of particles within some common sound fields. Qian [6] made use of PIV to measure unsteady flows in Francis turbines while Hasmatuchi et al [7] achieved high speed flow visualization with air bubbles injection in a pump turbine under off-design operating conditions.
behavior of the machine, besides the external noise and vibration which often affect experimental results.
In recent years a new research and investigations field has emerged, well-known as Computational Fluid Dynamics (CFD) thanks to the enhance of computational power which has led to an increasing exploit of computers for numerical simulations. In fluid dynamics, computers are broadly employed to calculate velocity fields and other flow quantities using numerical techniques to solve the governing Navier-Stokes equations. This has led into the growth of a relatively new technique known as computer-aided visualization [8]. However, computational studies in hydrodynamic remain limited primarily due to the difficulties in modeling turbulent separated flows in complex geometries that involve interaction between rotating and stationary components [9]. Truthful computational forecast in dependant on user-specified input such as boundary conditions [10], transition and turbulence modeling [11], computational domains that need to be defined for a realistic representation of the specific configuration [12], among others, often depend upon details that often can be obtained only by conducting experiments. Numerical simulations are still under development; approximations of flow patterns despite are sometimes achieved, its results do not fulfill the expectations of fluid engineer community [13]. Reliable visualization of flow phenomena can be based on actual experimental measurements [9], main reason why experimental visualization is still highly employed.
One particular study case in which CFD does not clearly describe the undergoing phenomena is the rotating-stall (RS) [12]. Fringe et al [14] have defined RS as the unsteady flow phenomenon that leads to the incidence of synchronous rotating velocity fluctuations; this is a highly dynamic phenomenon which often occurs in Francis-type reversible pump-turbine. Due to its intrinsic attributes, such as periodicity, flow transition and turbulence, recirculation, stalls, back-flow, swirling flow, among others; the RS is an ideal study case phenomenon which defies the accuracy and adequate evaluation of new flow visualization techniques.
The accuracy of this novel tuft technique is evaluated under the rotating-stall phenomenon in a Francis-type reversible pump-turbine in generating mode accompanied with pressure sensors carefully installed in the region where the phenomenon manifests. Pressure measurements and other techniques found in the literature for instance Hasmatuchi in [21] were took as reference to validate the results obtained.
2
Experimental setup
The flow visualization experimental researches under rotating-stall conditions were accomplished on a reduced scale model of a Francis-type reversible pump-turbine. The center of attention is put on off-design operation regimes: runaway and turbine break modes. Such operation is frequently experienced by pump turbines during the start up process.
A set of 3 test rigs were disposed for testing purposes, performed according to IEC60193 standards [22] within an accuracy of 0.2%. Characteristic curves are traced in terms of the dimensionless factors expressed by equations (1) to (3) describing speed, discharge and torque factor, respectively.
√ (1)
√ (2)
(3)
Where
is the discharge [m3/s]
is the torque [Nm]
is the specific hydraulic energy [J/kg] is the gravitational acceleration [m/s2]
is the hydraulic head [m]
is the density of the fluid [kg/m3]
is the impeller rotational velocity [rad/s] is the reference diameter of the impeller [m]
Technical characteristics of the Francis type reversible pump turbine tested are shown in Table 1.
Parameter Description Value
Number of impeller blades 9
Number of guide vanes 20
Impeller inlet diameter 523.5 mm
̅ Impeller outlet diameter 250 mm
Nominal guide vanes opening 18
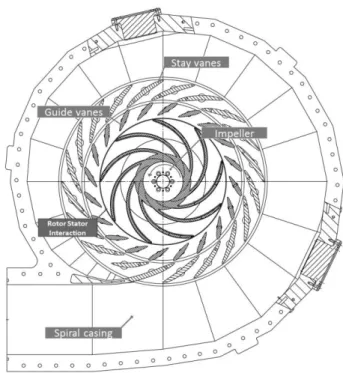
This study case reduced model is a low specific speed pump turbine featuring 9 impeller blades, 20 guide vanes and 20 stay vanes (Figure 1).
Figure 1.Case study reduced model.
The test head is set to 20m which corresponds to 200 J/Kg specific energy. The guide vanes opening is set to in order to replicate normal startup conditions. Rotational speed is progressively increased from a calm flow operating point to the turbine brake region, via runaway where torque is .
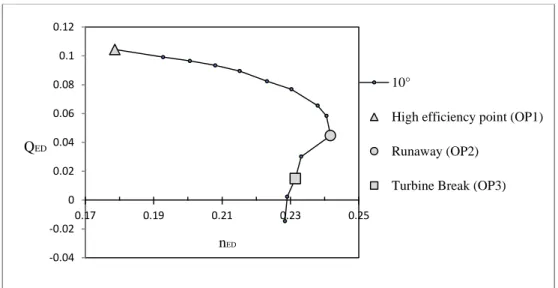
A specific procedure commonly used in model testing of pump turbines[23]is implemented to stabilize the operating point: once at runaway, the butterfly valve located in the main pipe upstream is closed. A by-pass valve equipped with an iris diaphragm is used for fine adjustment of the head valve. Then, the turbine break mode is explored until a fully developed rotating stall is reached. An unstable characteristics curve is obtained (Figure 2).
Figure 2. curve of the pump-turbine reduced scale model and analyzed operating points. Different markers are used to indicate the reference operating points (Table 2), OP1 (high efficiencyturbine mode), OP2 (runaway mode) and OP3 (turbine break mode)
-0.04 -0.02 0 0.02 0.04 0.06 0.08 0.1 0.12
0.17 0.19 0.21 0.23 0.25
QED
nED
10°
High efficiency point (OP1)
Runaway (OP2)
Point Description
OP1 High efficiency point: calm flow 0.0995 0.1933 OP2 Runaway 0.0449 0.2421 OP3 Turbine-brake 0.0148 0.2324
Table 2. Reference points in the turbine.
3
Instrumentation
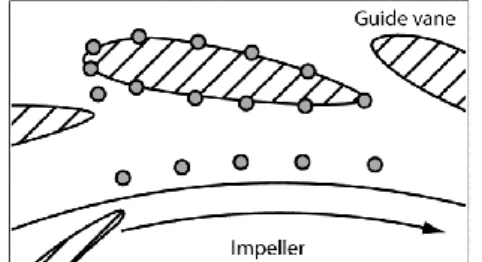
Fluorescent monofilament wires 15mm long and 0.14mm diameter are installed at the upper wall of two consecutive guide vanes, whereas on the midspan of the involved guide vanes (Figure 3).
Figure 3.Tufts locations indicated as grey circles
A special technique to attach the wires at the wall surface has been developed by Hasmatuchi in [21]. Holes of 0.5mm diameter and 2mm deep are initially drilled. Anaerobic glue with capillarity properties is injected in the holes with the help of a needle syringe. After, a monofilament wire knotted at one end is introduced into an activator to promote the curing speed of the glue. Finally the attached wires are cut at 15mm length from the wall surface (Figure 4).
Figure 4.Installation of fluorescent wires for tuft visualization [21].
In no-flow condition the wires are oriented perpendicular to the support surface, while in flow circumstances they are attached to the wall in the direction imposed by the flow. It is assumed that the wires fairly follow the streamlines with no effect on the flow itself [21].
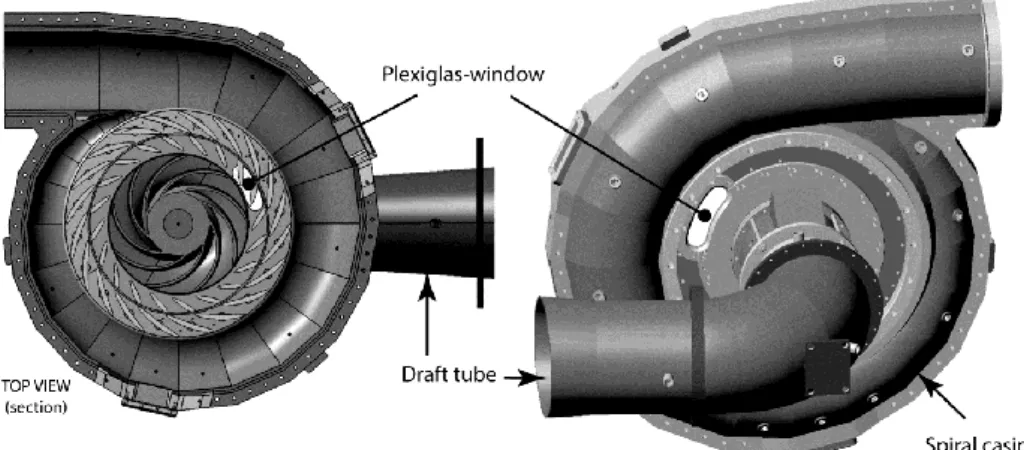
Figure 5. Plexiglas window available in the pump-turbine model, for flow visualization.
To visualize regions of unsteady flow a high speed imaging Photron Fastcam SA1.1 digital camera is used, triggered by the keyphasor and synchronized with pressure measurements. Images of 256x576 pixels are taken at a rate of 10000 fps. Two Cosmobeam 800W sources equipped with linear tungsten halogen bulb provides the lighting of the stage. Ultraviolet components of these bulbs render the fluorescent wires (tufts) visible.Figure 6 shows the experimental setup of the pump-turbine reduced scale model.
Figure 6. Experimental setup of reduced scale model.
installed in the narrow and vaneless gap between the impeller blades and guide vanes, where the rotor-stator interaction befall.
4
Image processing
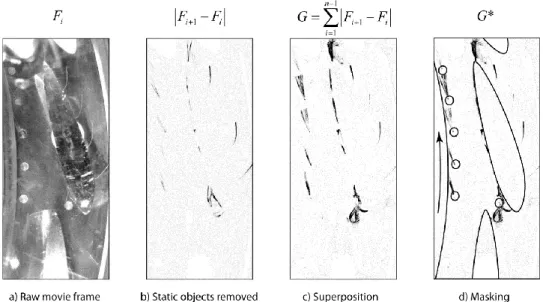
Unprocessed images hold a lot of information that is not relevant in the case of flow description difficulting the analysis of the movement of the tufts. Therefore an image processing procedure is introduced in order to obtain better analysis results: movie frames were converted to gray scale images. To remove the static objects and get better contrast, consecutive frames are substracted together. Eventually, the sampling rate is so high or the wires motion so slow that the differences from one frame to the next are neglible, hence, depending on the frame rate, the difference step can be increased to improve the quality of the results.
The projected result is a gray scale image with half of the wires in white and the other half in black, to put them in the same color (white) the absolute value of the resulting frame is calculated, then the color value is inverted in order to have black wires on a white background. This procedure is made for the movie duration so the product is a series of frames that can be superimposed to achieve a final image with the tracks of the wire. A mask containing the guide vane geometry and tuft location is imposed because of the substraction of all the static objects. Finally, supplementary quality operations may consist in contrast improving, rotation, translation and perspective corrections. Figure 7 summarize the steps followed.
Figure 7. Implemented image processing for tuft visualization. a) Typical frame from high speed movie. b) Consecutive images are subtracted to remove static objects. Moving wires became visible in black by calculating the absolute value. c) The process is repeated for n images; the n-1 resulting pictures are
superposed in order to track the wires positions. d) Guide vanes mask is imposed.
Iterative nested cycles cover several RS revolutions and several guide vane channels. At the end, one treated image per guide vane channel is obtained.
∑| |
(4)
Where
is the current video frame.
is the processed image for distributor channel .
⌊
⌋ is the number of frames per passage of RS by distributor channel.
is the number of frames to complete one revolution of rotating stall. is the number of channels.
To ensure the Nyquist–Shannon sampling criterion an anti-aliasing low-pass filter is applied to reduce the bandwidth of the movie before it is downsampled.
The cutoff frequency of the filtering process is given by the expression
(5)
Where
is the angular frequency of the reference tone.
is the final number of samples per oscillation of the reference tone.
If is replaced by the RS frequency and by the number of guide vanes, convenient
sequence of averaged image scan be obtained, each one describing the phenomenon in a different guide vanes channel. Assuming and , the cut-off frequency
is it means that the blade passing frequency and following harmonics for the
model under test ( ) are filtered.
5
Results
To describe the flow, along with tuft visualization Pressure fluctuations were analyzed with and without RS. Dimensionless pressure fluctuation coefficient is defined as
̃ ̅ (6) Where
is the measured pressure [Pa].
̅ is the average pressure [Pa].
is the density of the fluid [kg/m³].
is the specific hydraulic energy [J/kg].
per guide vane channel) which are prepared in alpha-color layer appended to each image in order to get a transparent background. Then, the tufts are extracted and the resulting reduced image is rotated ⁄ ⁄ . Finally, it is translated to the corresponding position according to the polar pattern of the machine geometry. This can be interpreted as RS arrangement.
5.1
Rotating stall inception
The machine is driven from a high efficiency and rotating stall free operating point (OP1), to runaway where the rotating-stall beginning is expected. Pressure and processed images at OP1 are shown in Figure 8.
Figure 8.OP1. Tuft visualization and pressure fluctuation over 10 impeller revolutions.
Tufts keep their mean position aligned with the flow with a slight oscillation induced by the impeller blades passage due to a calm flow attached to the hydrofoils. It is complemented by the time and frequency graphics of the pressure coefficient in P4.
Welch's method [24] is employed to estimate the spectrum which is dominated by the impeller blades passing frequency and its harmonics (i.e and . A subsynchronous peak at is attributed to a vortex rope in the draft tube, results obtained for turbine
mode at OP1 suggests that flow flows relatively orderly revealing pressure fluctuating at the blade passing frequency ( ) along with an unaccented vortex rope.
Flow separation and recirculation is observed when OP2 is reached, causing sporadic blockages into the guide vanes channels (Figure 9).Tufts in the superior plane close to the leading edge shows more activity and most likely flow detachments.
around ten times stronger than at OP1. In the frequency domain this behaviour is not easily identified; some components take place in the subsynchronous band (from 0 to ) but they are minor compared with the impeller blade passing component.
Figure 9. OP2. Tuft visualization and pressure fluctuations in time and frequency domains.
5.2
Fully developed rotating-stall
As the machine goes near to the turbine brake mode, flow becomes more disturbed with an increased rotating speed but reduced discharge; this rough flow involving flow separation, vortex formation and back flow among others, converges to a harmonically arranged pattern, the rotating stall is completely developed in OP3. Two different instants, half period apart, are shown in Figure 10 due to the complex flow obtained. The image on the top presents a relative straight flow with the peculiarity that on the bottom side of the guide vanes the fluid seems to flow faster and attached to the surface, however on the opposite side it is not the case.
Figure 10.OP3. Tuft visualization and pressure fluctuation from P4, over 10 impeller revolutions. Undergoing rotating-stall becomes evident in time domain as well as in frequency domain. a) Summed images
over the 1st half passage of the instability. b) Summed images over the 2nd half of passage of the instability.
The low frequency and quasi-harmonic RS cycle is clearly evident in the pressure coefficient behaviour. Straight flow illustrated on the top image, corresponds to the regions where pressure increases while disturbed flow is experienced during decreasing pressure. The spectrum shows a sharp component arising at as important as the bladed passing pulse,
i.e. pressure fluctuations close to 10% of the testing head. A small RS harmonic is also distinguished at and attributed to the shape printed by the passage of the phenomenon:
pressure rises rapidly but falls slower.
5.3
Neglible Influence of the Tufts
Figure 11. Comparison between pressure fluctuations measured with and without tufts at OP1 and OP3.
6
Conclusions
A reduced scale model of a Francis-type pump-turbine was tested under several operating conditions with and without RS. Pressure sensors and tufting with high-speed flow visualization technique was employed to visualize and characterize the RS phenomenon. The implemented tuft visualization method gives an adjusted qualitative description of the undergoing RS phenomena, making evident different flow behaviours such as back-flow, high turbulences, recirculation, among others, attributes that make RS an ideal study case not only in Francis-type pump-turbine but in other turbomachines. The developed visualization method is considered as a non-complicated one, and a feasible experiment technique that can be easily adapted to scientific and industrial communities. By means of specific image processing a panoramic representation of RS was achieved based on the same time-spatial symmetry of the pressure fluctuations. In particular, the RS period is found to consist of four well-define episodes: straight flow with rapidly increasing pressure, flow stagnation, highly disordered flow with decreasing pressure and sudden organization of the flow. The fully developed RS performs at with a single cell. It was recovered from pressure signals and described in by the high-speed tufting visualization.
7
Acknowledgments
for their involvement and support. A special expression of gratitude is conveyed to LMH-EPFL and EAFIT University for their unconditional support.
8
References
1. Cheng, K. C. A History Of Flow Visualization: Chronology. Journal of Flow Visualization and Image Processing. s.l. : Begell House Inc. Publishers, 1997. Vol. 4, 1. ISSN: 1940-4336.
2. Merzkirch, Wolfgang. Flow Visualization. s.l. : Academic Press, 2nd Edition, 1987. ISBN: 9780124913516.
3. Zobeiri, Amirreza. Effect of Hydrofoil Trailing Edge Geometry on the Wake Dynamics.
PhD Thesis. Lausanne : École Polytechnique Fédérale de Lausanne, 2012.
4. Sinha, Manish, Pinarbasi, Ali and Katz, Joseph. The Flow Structure During Onset and Developed States of Rotating Stall Within a Vaned Diffuser of a Centrifugal Pump. Journal of Fluids Engineering. s.l. : ASME, 2001. Vol. 123, pp. 490-499. DOI: 10.1115/1.1374213.
5. Navæi, Ali Tonddast. Acoustic Particle-Image Velocimetry Development and Applications. PhD Thesis. Buckinghamshire : The Open University, 2005.
6. Qian, Ruixia. Flow Field Measurements In A Stator Of A Hydraulic Turbine. PhD Thesis.
Québec : Faculté des études supérieures de l'Université Laval, 2008.
7. Hasmatuchi, V., et al. High-speed flow visualization in a pump-turbine under off-design operating conditions. IOP Conference Series: Earth and Environmental Science. s.l. : IOP Publishing, 2010. Vol. 12, 1. doi:10.1088/1755-1315/12/1/012059.
8. Post, Frits H. and van Walsum, Theo. Fluid Flow Visualization. Proceedings of Focus on Scientific Visualization. London, UK : Springer-Verlag, 1993. pp. 1-40. ISBN:3-540-54940-4.
9. Ullum, Ulrik, et al. Prediction of rotating stall within an impeller of a centrifugal pump based on spectral analysis of pressure and velocity data. Journal of Physics: Conference Series 52. s.l. : Institute of Physics Publishing, 2006. Vols. 36-45. doi:10.1088/1742-6596/52/1/004.
10. Backman, Alf Gunnar. CFD Validation of Pressure Fluctuations in a Pump Turbine. Msc Thesis. Luleå, Sweden : Luleå University of Technology, 2008. ISSN: 1402-1617.
11. Sardar, Asad M., et al. Flow visualization study of an HVAC module operated in water.
2001 Vehicle Thermal Management Systems Conference and Exhibition. s.l. : Society of Automotive Engineers, Inc, 2001. VTMS-082.
12. Gourdain, Nicolas, et al. Simulation of Rotating Stall in a Whole Stage of an Axial Compressor. Computers & Fluids. s.l. : Elsevier, 2010. Vol. 39, 9, pp. 1644–1655.
13. Hasmatuchi, Vlad, et al. Experimental Evidence of Rotating Stall in a Pump-Turbine at Off-Design Conditions in Generating Mode. Transactions- American Society of Mechanical Engineers- Journal of Fluids Engineering. s.l. : American Society of Mechanical Engineers, 2011. Vol. 133, 5. ISSN: 0098-2202.
15. Ristić, Slavica. Flow Visualisation Techniques in Wind Tunnels Part I – Non optical Methods. Scientific Technical Review. 2007. Vol. 62, 1, pp. 39-50.
16. Myose, Roy Y., Hayashibara, Shigeo and Heron, Ismael. Flow Visualization Study on the Effect of a Gurney Flap in a Low Reynolds Number Compressor Cascade. 6th AIAA Aviation Technology, Integration and Operations Conference (ATIO). Wichita : American Institute of Aeronautics and Astronautics Inc, 2006.
17. Thiam, Aicha H, et al. Corner Separation and the onset of stall in an axial compressor.
American Physical Society, 60th Annual Meeting of the Divison of Fluid Dynamics. s.l. : American Institute of Aeronautics and Astronautics Inc, 2008.
18. Denz, Thomas, Smith, Stephanie and Shrestha, Rajeev. Multi-hull Flow Visualization: An investigation of flow visualization techniques for trimaran hulls. Final rept. 21 May-10 Aug 2007. West Bethesda, MD : Naval Surface Warfare Center Carderock Div., 2007.
19. Bhattacharyya, Abhijit, et al. Observations On Off-Design Flows In Non-Cavitating Axial Flow Inducers. ASME Symposium on Pumping Machinery. Fluids Engineering Division, FED-154 (FED-154). New York : American Society of Mechnical Engineers, 1993. pp. 135-141.
20. Yadoiwa, A., et al. rotating stall in mixed-flow turbomachines. Twelfth Australasian Fluid Mechanics Conference. Sydney : The University of Sydney, 1995. pp. 69-72.
21. Hasmatuchi, Vlad. Hydrodynamics of a Pump-Turbine Operating at Off-Design Conditions in Generating Mode. PhD Thesis. s.l. : École Polytechnique Fédérale de Lausanne, 2012.
22. International Electrotechnical Committee . Hydraulic Turbines, Storage Pumps and Pump-Turbines – Model Acceptance Tests. International Standard IEC 60193. 2006. BS EN 60193:1999.
23. Dörfler, P.K, et al. Stable Operation Achieved on a Single-Stage Reversible Pump-Turbine Showing Instability at No-Load. Proceedings of the 19th IAHR Symposium on Hydraulic Machinery and Cavitation, Singapore. 1998. pp. 431-440.
Experimental Rotordynamics of a
Francis-Type Pump-Turbine in Generating Mode at
Off-Design Operating Conditions
Sebastian Guzmán1, Francisco Botero1, Vlad Hasmatuchi2, Steven Roth2, Mohamed
Farhat2
1 EAFIT University
Carrera 49 N° 7 Sur - 50, Medellín, Colombia
2 Laboratory for Hydraulic Machines École Polytechnique Fédérale de Lausanne
Avenue de Cour 33 bis, CH-1007 Lausanne, Switzerland
Abstract: A reduced scale models of a Francis-type reversible pump-turbine in generating mode was investigated in three different stages such as turbine mode, runaway mode and turbine break mode, in order to identify and detect rotating stall phenomenon from rotordynamics standpoint. Two proximity probes were orthogonally embedded into the main bearing along with a keyphasor allowing positive results detecting the rotating stall in the particular analyzed case. Pressure measurements were analyzed along with proximity probes to correlate the shaft precession with the induced sub-synchronous flow instability.
Keywords: Rotating-Stall, Francis-type pump-turbine, Rotordynamics in turbine.
1
Introduction
Pump turbines technology is widely seen as having a great potential in storing large amounts of electrical energy [1]. This kind of turbo machinery provides a way in which control power grid because gives an efficient manner to stabilize the electricity by moving water forth and back between upstream and downstream reservoirs to attain both the energy supply and demand [2]; it combines both axial and radial flow concepts to take energy from or to add energy to a fluid, therefore, is subjected to frequent switching between pumping and turbine modes with extensive periods under off-design conditions. Five main operating regimes can be distinguished: pump mode, pump brake, turbine mode, turbine break and reverse pump; a deeper description of the phenomena involved of each region mode can be found in Amblard et al. [3]. Due to this different regimes, during the operation at any operating point, the relative motion between the impeller blades and guide vanes induces pressure fluctuations that propagate through the entire machine [4] giving raise to severe oscillations at off-design conditions [5], further under specific conditions, a stationary separation zone may begin to progress known as rotating-stall (RS).
region of lower speed flow through the machine around the machine with a sub-synchronous precession with rotative speed dependant frequency at a speed lower than the rotor speed [8].
The interest in radial flow instabilities, such as this sub-synchronous phenomenon has been widely studied, found to be in general at 0.10x-0.20x rotating speed when action occurs in the diffuser and at 0.60x-0.80x rotating speed when action takes place in the impeller [9] also simulations of RS cell propagation [10] as well as control stabilization of flow at the inception of RS [11] have been developed. Furthermore, diverse techniques have been employed in RS detection, Yadoiwa et al. [12] used flow visualization tufts to study RS at impeller inlet while Shina et al. [13] employed particle image velocimetry (PIV) and pressure fluctuation measurements for investigate the onset and development of RS inside a centrifugal pump. Nonetheless, approximations of flow patterns surrounded by RS have been achieved with the development of numerical simulations [14], although, the obtained results are not entirely accepted among the fluid engineering community [15]; besides, the understanding of the steady and unsteady forces and the related rotordynamic behavior is requisite to model turbo machines effectively [16].
Even though, the broadly employment of diverse techniques, the advances in understanding of rotordynamics through the non contact probes for observing shaft motion directly [17] has evolved into the study of rotordynamic forces in turbo machinery. Bentley et al. [18] and [19] discuss RS in centrifugal compressors from vibration diagnostics and rotordynamics stand points concluding that during RS the rotordynamic stability margin is reduced and usually results in the appearance of a low sub-synchronous rotor vibration level caused by a RS at the design stage of centrifugal compressor. Also, they conclude that the emphasis on rotor behavior does not allow for details of particular flow patterns, but treats the fluid “in average” which falls in the scale of rotor motion. Despite this, the literature survey shows insufficient understanding of rotordynamic implications of RS, especially in Francis-type reversible pump-turbines were no publications are found; being that scope of this work.
2
Experimental Setup
The experimental investigations for the detection of rotating stall were accomplished on a reduced scale model of a Francis type reversible pump turbine. The center of attention is put on off-design operation regimes: runaway and turbine break modes. Such operation is frequently experienced by pump turbines during the start up process.
Figure 1.EPFL-LMH experimental test rigs (courtesy: EPFL-LMH, 2011)
Technical characteristics of the Francis type reversible pump turbine tested are shown in Table 1.
Parameter Description Value
Number of impeller blade 9 Number of guide vanes 20 Impeller inlet diameter 523.5 mm
̅ Impeller outlet diameter 250 mm
Nominal guide vanes opening 18 Table 1. Technical parameters of the case study pump-turbine model
Characteristic curves in function of discharge , torque , specific hydraulic energy , gravitational acceleration , hydraulic head , density , impeller rotational velocity
and reference diameter of the impeller are traced in terms of the dimensionless factors expressed by equations (1) to (3) describing speed, discharge and torque factor, respectively.
√
(1)
√
(2)
(3)
Figure 2.Case study reduced model.
The test head is set to 20m which corresponds to 200 J/Kg specific energy. The guide vanes opening are set to in order to replicate normal startup conditions. Rotational speed is progressively increased from a calm flow operating point to the turbine brake region, through runaway where torque is .
A specific procedure commonly used in model testing of pump turbines [21] is implemented to stabilize the operating point: once at runaway, the butterfly valve located in the main pipe upstream is closed. A by-pass valve equipped with an iris diaphragm is used for fine adjustment of the head valve. Then, the turbine break mode is explored until a fully developed rotating stall is reached. An unstable characteristics curve is obtained (Figure 3).
Figure 3. Curve of the pump-turbine reduced scale model and analyzed operating points. -0.02
0 0.02 0.04 0.06 0.08 0.1
0.15 0.17 0.19 0.21 0.23 0.25
[-] QED
η
ED[-] 10° OP1
Pressure sensors were installed in the narrow and vaneless gap between the impeller blades and guide vanes, were the rotor-stator interaction befall. A zero phase reference (known as keyphasor) is resultant from a point on the shaft. An optic sensor observing a rotating hurdle is used to generate a once-per-revolution occurrence.
Two non-contact, eddy-current proximity probes are used to reconstruct shaft orbits; both of the proximity probes are orthogonally arranged in order to allow a simple reconstruction of the shaft orbits, mounted in the bearing housing of the main journal bearing (Figure 4).
Figure 4. Experimental setup
Berten in [7] showed that, for centrifugal pumps, the shaft position is affected by the balance between the mechanical and hydraulic forces wield on the impeller, thus any variation in such forces results in a displacement of the shaft.
3
Results
Figure 5. Shaft Orbits and S-shaped characteristics. The orbit plot shows the dynamic motion of the centre of the rotating impeller with signals from proximity probes X and Y.
Samples are taken at different operating points, from OP1 and going up to the reverse pump mode. Figure 5 shows an overview of the rotordynamics for positive rotation quadrants. Scaled versions of the orbits and the respective keyphasor marks (pulse per revolution) are depicted on the performance characteristics. For each operating point, an orbit is a two-dimensional image of the shaft center motion. Proximity signals are lowpass filtered in order to preserve the subsynchronous band ⁄ , the region of where RS manifest.
Figure 6. Shaft precession for OP1, OP2 and OP3, during few revolutions.
Spectral estimations are given for both of the proximity signals used to build the orbits. Synchronous lateral vibrations are always observed. The component rising at 0.37x is related to a vortex rope developed in the draft tube at OP1. Likewise, at OP2 the energy concentrated around 0.68x is attributed to the onset of RS which becomes sharper and dominant at OP3. At that point, consecutive keyphasor marks are separated by an angle of about 252°, i.e. 70%.
3.1
OP1
Figure 7. Vortex Rope.Coherence estimated between signals from the proximity probe x and the pressure monitoring point located in the draft tube.
3.2
OP2 (Runaway)
A less stable behaviour than OP1 is observed due to the amplitude of the shaft orbits, which despite of being concentric, its shape begins to distort as well as the location of the keyphasor marks. Sudden changes and small loops can be seen as shaft’s reaction to sporadic blockages because of the RS inception that appears in guide vanes or impeller channels.
The uneven flow developed can create numerous kinds of hydrodynamic instabilities as local vortices or eventual stalls that may or not rotate. This subsynchronous perturbation is rather linked to hydrodynamic events, but to differentiate it from other perturbation sources like mechanical faults, proximity signals are compared together with the pressure signals taken from the distributor channels employing coherence function (Figure 8).
Figure 8. RS inception. Coherence estimated between signals from the proximity probe x and the pressure monitoring point P4, located in the vaneless gap between the impeller and guide vanes.
3.3
OP3 (fully developed RS)
It can be said that irregularly distributed pressure around the impeller produces an intense unbalance perceived by the shaft and altering its precession; the system behaves like a rotating cantilever beam, which explains the resulting orbits as can be seen in Figure 9.
Figure 9. Pressure fluctuation and shaft motion.
Synchronized signals from pressure sensor P4 and proximity probes X and Y are used to show the coherence of the RS related pressure and shaft eccentricity. Low pass (LP) filtered signals are also included to facilitate understanding. Vertical dashed lines indicates synchronization between P4 and X; i.e. the higher the pressure, the further the center of the shaft.
4
Discussion
The coherence between the hydrodynamic parameters such as pressure measurements and the signals of the mechanical parameters such as proximity probes shows that frequency component described by the precession of the shaft is highly coherent with the observed pressure fluctuations, thus it indicates that the precession of the shaft is due to the undergoing RS rather than unrelated mechanical behaviors. For the obtained pattern, both the orbits and the spectrum, evidence the manifestation of the studied phenomenon especially notorious in OP3 in which the component rising at 0.7x is linked with RS that becomes sharper, dominant and where consecutive keyphasor marks are equally separated.
subsynchronous frequency. Therefore diagnose this kind of hydraulic phenomena based on mechanical elements is plausible and accurate without the interference of any additional mechanical phenomena for the study case developed.
As these sensors are already installed in most turbo machinery since several years ago, this method could become a practical low-cost solution and almost implementation-free for the detection of RS. However, one specific case where this method might not work is when RS develops in more than one cell symmetrically because they tend to redistribute the pressure around the axis as reported by Braun in [24], causing the system to equilibrate making detection procedures more complicated. In that case, the low frequency can be still detectable, but the number of cells, probably not; in contrast with the occasion of a single cell or non-symmetrical arrangements which yields to a high and a low pressure zones around the impeller usually half circumference apart, whose generate significant unbalance affecting the precession of the shaft. Even so, according to literature Francis-type pump-turbines in generating mode, the RS is prone to occur in one single cell, different to the pump mode, where this phenomenon may be deeper explored.
Figure 10. Expected shaft loads caused by pressure distribution around the impeller in the case of: a) single-cell RS, or b) 3-cells RS.
5
Conclusions
However, If RS develops in more than one cell symmetrically, the expected distribution of the pressure tends to equilibrate the hydrodynamic loads in the impeller and therefore in the shaft. The present characteristic pattern revealing a strong unbalance is no longer respected making the detection complicated. Even so, in Francis-type pump-turbines in generating mode the RS is susceptible to occur in one single cell.
6
Acknowledgments
The present investigation was carried out in the frame work of HYDRODYNA II research project (Eureka N° 4150), in a partnership with ALSTOM Hydro, ANDRITZ Hydro, VOITH Hydro and UPC-CDIF. The authors would like to thank the Swiss Federal Commission for the Technology and Innovation (CTI), Swisselectric Research and Swiss Competence Center of Energy and Mobility (CCEM) for their financial support, as well the HYDRODYNA II partners for their involvement and support. A special expression of gratitude is conveyed to LMH-EPFL and EAFIT University for their unconditional support.
7
References
1. Hasmatuchi, Vlad, Farhat, Mohamed and Avellan, François. Hydrodynamics of a Pump-Turbine under Off-Design Operating Conditions in Generating Mode. Proceedings of the 1st EPFL Doctoral Conference in Mechanics. Lausanne : EPFL Doctoral Conference in Mechanics - EDCM2010, 2010. págs. p. 111-114.
2. Hasmatuchi, V., et al. High-speed flow visualization in a pump-turbine under off-design operating conditions. IOP Conference Series: Earth and Environmental Science. s.l. : IOP Publishing, 2010. Vol. 12, 1. doi:10.1088/1755-1315/12/1/012059.
3. Amblard, H, et al. Behavior of Francis Turbines and Pump-Turbines at Partial Flow. La Houille Blanche. 1985. 5, págs. 435-440. DOI: 10.1051/lhb/1985031.
4. Zobeiri, Amirreza. Effect of Hydrofoil Trailing Edge Geometry on the Wake Dynamics.
PhD Thesis. Lausanne : École Polytechnique Fédérale de Lausanne, 2012.
5. Drtina, P and Sallaberger, M. Hydraulic turbines—basic principles and state-of-the-art computational fluid dynamics applications. Proceedings of the Institution of Mechanical Engineers, Part C: Journal of Mechanical Engineering Science. 1999. Vol. 213, 1, págs. 85-102. doi: 10.1243/0954406991522202.
6. Fringe, P and Van Den Braembussche, R. Distinction Between Different Types of Impeller and Diffuser Rotating Stall in a Centrifugal Compressor with Vaneless Diffuser. Journal of Engineering for Gas Turbines and Power, Transactions. s.l. : American Society of Mechanical Engineerings, 1984. Vol. 106, 2, págs. 468-474.
8. Thiam, Aicha H, et al. Corner Separation and the onset of stall in an axial compressor.
American Physical Society, 60th Annual Meeting of the Divison of Fluid Dynamics. s.l. : American Institute of Aeronautics and Astronautics Inc, 2008.
9. Teeling, Sebastiaan. Using data manager 2000 to remotely diagnose gas compressor rotating stall. Orbit. 1998. Vol. 19, 4, págs. 26-29.
10. Lewis, Ivan R. Study of blade to blade flows and circumferential stall propagation in radial diffusers and radial fans by vortex cloud analysis. Journal of Computational and Applied Mechanics. 2004. Vol. 5, 2, págs. 323-335.
11. Belta, Calin, et al. Rotating stall control for axial flow compressors. Automatica. s.l. : Elsevier Science Ltd, 2001. Vol. 37, págs. 921-931.
12. Yadoiwa, A., et al. rotating stall in mixed-flow turbomachines. Twelfth Australasian Fluid Mechanics Conference. Sydney : The University of Sydney, 1995. págs. 69-72.
13. Sinha, Manish, Pinarbasi, Ali and Katz, Joseph. The Flow Structure During Onset and Developed States of Rotating Stall Within a Vaned Diffuser of a Centrifugal Pump. Journal of Fluids Engineering. s.l. : ASME, 2001. Vol. 123, págs. 490-499. DOI: 10.1115/1.1374213.
14. Gourdain, Nicolas, et al. Simulation of Rotating Stall in a Whole Stage of an Axial Compressor. Computers & Fluids. s.l. : Elsevier, 2010. Vol. 39, 9, págs. 1644–1655.
15. Hasmatuchi, Vlad, et al. Experimental Evidence of Rotating Stall in a Pump-Turbine at Off-Design conditions in Generating Mode. Journal of Fluids Engineering, Transactions of the ASME. s.l. : American Society of Mechanical Engineers, 2011. Vol. 135, 5. ISSN: 0098-2202.
16. Guinzburg, A, et al. Rotordynamic forces generated by discharge-to-suction leakage flows in centrifugal pumps. Proceedings 1990 conference on advance Earth-to-Orbit propulsion technology. Huntsville, Alabama : NASA, 1990.
17. Gunter, Edgar J. Understanding amplitude and phase in rotating machinery. Vibration institute 33rd annual meeting. Harrisburg, Pa : s.n., 2009.
18. Bently, Donald E., Goldman, Paul and Yuan, Jing. Rotor Dynamics of Centrifugal Compressors in Rotating Stall. Orbit. 2001. Vol. 22, págs. 40-50.
19. Bently, Donald E. and Goldman, Paul. Vibrational Diagnostics of Rotating Stall in Centrifugal Compressors. Orbit. s.l. : Bently Nevada Corporation, 2000. Vol. 21, 1.
20 International Electrotechnical Committee Hydraulic Turbines, Storage Pumps and Pump-Turbines – Model Acceptance TestsInternational Standard IEC 60193 BS EN 60193:1999
21. Dörfler, P.K, et al. Stable Operation Achieved on a Single-Stage Reversible Pump-Turbine Showing Instability at No-Load. Proceedings of the 19th IAHR Symposium on Hydraulic Machinery and Cavitation, Singapore. 1998. págs. 431-440.
22. Muszynska, Agnes. whirl and whip-rotor/bearing stability problems. Journal of sound and vibration. 1986. Vol. 110, 3, págs. 443-462.
23. Fan, Chen-Chao, et al. Study ofstart-up vibration response for oil whirl, oil whip and dry whip. Mechanical Systems and Signal Processing. s.l. : Elsevier Ltd, 2011. 25, págs. 3102-3115. doi:10.1016/j.ymssp.2011.04.012.