Os A Web-based Application for the Management
and Evaluation of Tutoring Requests in PBL-based
Massive Laboratories
Luis Fernando D'Haro , Fernando Fernández-Martinez , Juan Manuel Montero , Ricardo de Córdoba Herralde
Abstract— One important steps in a successful project-based-learning methodology (PBL) is the process of providing the students with a convenient feedback that allows them to keep on developing their projects or to improve them. However, this task is more difficult in massive courses, especially when the project deadline is close. Besides, the continuous evaluation methodology makes necessary to find ways to objectively and continuously measure students' performance without increasing excessively instructors' work load In order to alleviate these problems, we have developed a web service that allows students to request personal tutoring assistance during the laboratory sessions by specifying the kind of problem they have and the person who could help them to solve it. This service provides tools for the staff to manage the laboratory, for performing continuous evaluation for all students and for the student collaborators, and to prioritize tutoring according to the progress of the student's project. Additionally, the application provides objective metrics which can be used at the end of the subject during the evaluation process in order to support some students' final scores. Different usability statistics and the results of a subjective evaluation with more than 330 students confirm the success of the proposed application.
Keywords— Continuous evaluation, Electronic learning, Software tools, Tutoring management
I. INTRODUCTION
One important step when using the project-based-learning methodology (PBL) is to provide students with a convenient feedback that allows them to keep on developing their projects or to improve them This task, although relevant, takes a lot of time from teachers especially in massive courses and even more when the project deadlines are close. Moreover, the continuous evaluation methodology proposed in the Bologna methodology makes necessary to find ways to objectively and continuously measure students' performance without increasing excessively the instructors' work load. In order to solve and alleviate these problems, we have developed a low-cost web application that uses open-source code to allow students to dynamically request, in an organized and fair way, personal tutoring assistance during the laboratory sessions by
specifying the kind of problem they have and the best person they consider that could help them to solve it.
The immediate advantage of this service is that it provides the tools that make easy for the staff to manage the laboratory in terms of personnel, or to know the number of students attending extra turns, but also to find the kind of problems that students face along the sessions. With this information, the staff could then increase the number of teachers who supervise a given session, or send general advises about how to overcome the most common problems. On the other hand, with this application we have gone one step beyond from these evident advantages by using it as an additional direct and indirect mechanism for performing continuous evaluation for the students but especially for the collaborators, and as a mechanism to prioritize tutoring according to the progress of the student's project in case there are too many requests in a given session. Finally, the application provides objective metrics which can be used during the evaluation process in order to support the students' final scores.
In the paper, we will provide a detailed description of the application architecture, u s e r s ' forms and usability statistics for the last courses where it has been used. Besides, we will provide the results of a subjective evaluation with more than 330 students where we requested students to qualify the usability, the negative aspects of the application, and ideas to improve the application. The results of this evaluation confirmed the success of the proposed application and provided a set of improvements for future releases.
A. Main goals
We can summarize the main goals of this research as follow:
1) Develop a clear, easy to use and organized mechanism for the students to request help in order to solve the problems that may arise when developing the PBL project.
2) Provide instructors with additional mechanisms for performing continuous evaluation and monitoring the students' learning progress.
performance and effectiveness of the work done by the student collaborators.
B. Paper organization
This paper is organized as follows: section II provides information about other projects we have used as inspiration to develop the current application, as well as information about the subjects where the proposed system is currently being used. In section III, we present a detailed description of the system and its implementation requirements; in section IV we will show the results of a subjective evaluation carried out with the students, as well as usability metrics of the proposed system. Finally, sections V and VI show the conclusions and future work respectively.
II. BACKGROUND
A. Related research projects
Reference [1] describes a web-based application for monitoring learning activities and predicting the students’ achievement based on the use of an online platform for developing programming projects. The student’s score is estimated based on several information such as how long the students use the application, the number of times they use the different tools, the activities they do, etc. Our platform a lready includes an automatic system that estimates the qualit y of the software programmed by the students [2][3] which can be seen as a direct measure of the final result instead of considering the usage of the platform tools. However, the new system allo ws us now to evaluate the collaborators’ work thanks to the information provided by the assisted students, objective measures of their pro-activity, and comparing them with the work carried out by the other collaborators. Besides, the new system provides tools for instructors to continuously evaluate the students at the end of the assistance.
Reference [4] describes a mobile application that helps teachers to monitor and coordinate an online forum. This work is also a very time-consuming task since it is not possible to know in advance when new messages will be posted or when problems will arise. This situation forces the mediator to continuously log in into the forum to check the hot topics and to intervene if necessary. In order to alleviate this problem, the authors propose an application that is available to mediators and users through a PDA screen or SMS notifications. Similar to our case, the application is used to detect and promote user’s participation and to provide information about the general problems; as in our case, the use of PDAs makes easy to the staff to access the information. In our case, we allow students to make the request through the use of mobile devices or desktop computers, while the teachers use the PDAs to access to the queue of requests and to perform the evaluation. The use of the mobile devices allows teachers to move along the laboratory room with total freedom and without wasting time to consult the information in a desktop PC.
Finally, we also want to refer previously developed tools
and capabilities of our platform. In [2], [5]and [6] we describe automatic tools to measure the quality of the student’s code in assembler and C language; in [7], [8] and [9] we describe different kind of 24/7 remote access to real prototyping platforms for the teaching of hardware design laboratories. Lastly, in [10] we describe additional tools that we use for the management of the laboratories, e.g. request of extra-turns, collection of statistics about project progress and attendance to the laboratory, extraction of evaluation statistics, etc.
B. Laboratory subjects
Our current system has been implemented to be used mainly in two courses: Laboratory of Electronic Circuits (LCEL) and Laboratory of Digital Electronic Systems (LSED), which are mandatory laboratory courses that students must take in their 5th and 6th semester respectively. There are about 250 students taking these courses every year, and it involves a number of student collaborators typically ranging fro m 7 to 15. The students, grouped in teams of two, have to design, build, test, and document a complete multidisciplinary electronic circuit and a microprocessor-based system (combining both hardware and software in case of LSED), and different analog and digital circuits (in case of LCEL). In both courses, every year a different project is proposed to the students whose starting point is a written description including the functional specifications and minimum requirements of the system and main subsystems, as well as some guidelines for the implementation and a tentative planning schedule.
Then, students must complete the analysis of the system (the initial specification is always incomplete) and they must do the design, implementation, tests and documentation. Some of the specifications are open to students’ creativity in order to achieve the maximum grade. The evaluation is continuously done mainly through two intermediate oral examinations (around sessions 4 and 7) that include a written report on the current state of the project, and a final evaluation (at the end of session 10) based on the final project, complete documentation of the system, and an oral examination. For further details about these subjects and proposed projects please refer to [11] and [6], and to the corresponding homepage of the courses:
(http://lcel.die.upm.es/) and (http://lsed.die.upm.es/). C. Roles
Before explaining the system, it is important to briefly define the roles and profiles of the system users:
Students: This group corresponds to the users who are
officially registered in the course and must assist to the sessions to complete the proposed project.
Student collaborators: This is a group of students who
of their assistance. Until now, the ma in information to evaluate them came from anonymous polls among students, and information fro m the instructors. The new application provides additional mechanisms and objective metrics to evaluate them.
Instructors: help students to understand the different parts
of the development, answer theoretical/practical questions, laboratory equipment, software tools, and evaluate the progress of the students and collaborators.
III. SYSTEM DESCRIPTION
A. System Requirements
From the beginning, one of our goals for this platform was to make the service available to instructors and students without imposing special hardware or software requirements (e.g. specific operating systems or devices), keeping maintenance costs low, and providing a continuous service. Therefore, we decided to implement our proposed application using web technologies that could be accessed by both the students and the staff through the workstation computers or different kind of mobile devices (e.g. cell-phones, tablets, laptops, etc.).
In order to achieve these objectives, we created a local network where the workstation computers and hand-held devices could connect via wireless or Ethernet with the local server. In this case, the wireless access in the lab allows all students and instructors to connect for free to the service without requiring the use of the mobile data. In addition, we assigned a known IP address to each workstation computer to automatically complete information about the requests making easy for the student to complete the initial forms and to instructors or collaborators to find the students requesting the assistance. In case students use a mobile device, the form will require the workstation number as input.
Regarding the server, we have chosen the use of only open-source applications. In this case, we installed a Linux-based system running Apache allowing PHP/CGI web services and MySQL/phpmyadmin for accessing and managing the database. Finally, all the forms and web pages were created using PHP/HTML and using CSS style sheets, AJAX, and Javascript functions in order to guarantee platform independency and to take advantage of asynchronous web pages updates to reduce the amount of data traffic. Finally, there are available hand-held devices with Wi-Fi connection capabilities which can be given to any person requiring access to the service during the time of the laboratory session. These devices and others were used during the platform tests, so we guarantee that the service runs on them without problems.
B. Student’s forms
Figure 1 shows the first web form that allo ws students access to the system by simp ly specifying the kind of problem they have. As mentioned before, we tried to simplify as much as possible this user interface in order to avoid mistakes when
introducing information that could ma ke it difficult to assis t the students or to obtain the right statistics. For instance, we automatically detect the workstation number and students IDs in order to know where to go and to see an historical record about the students requiring assistance (e.g. kind of problem, number of requests, pending requests of assistance, etc). In addition, the form includes a list of typical problems that the students can choose or complement with further details. This information is also useful to detect generalized problems allo wing the course coordinators to send clarification emails with indications about how to solve them.
Figure 1. Aspect of the initial students’ form for requesting assistance
Finally, the system automatically shows the names of the available instructors/collaborators in that session allowing students to choose specifically one of them. This information is useful because: a) students can choose the same person that assisted them before avoiding to explain the problem again to a new person; and b) it allo ws to obtain different statistics on the performance of the person providing the assistance. Although students can request either a specific or generic person, the request is shown to all instructors and student collaborators so that anyone can assist the request in case there is a high occupancy at the laboratory or to allow students to be assisted in case the requested person is busy for too long. The information about the person that finally handled the request is stored in the database and used to provide additional points in the final score to the student collaborators that are more proactive (see section III.D).
Figure 2. Queue screen for students who have requested assistance
highlight that showing the students the number of pending requests allows achieving the following three goals:
a) To let students to know that their request is included in the queue but also how many people are also requesting help at the same time.
b) This information allows them to be ready (e.g. to prepare in advance the questions or setup required to show the problem) when the requested person is near to come.
c) Finally, students could know whether their request will be in time to be assisted within the current session or whether they will need to request additional tutoring outside of the laboratory with one of the instructors. The system registers the non-attended requests to give the couple a high priority in the assistance the next time they attend the laboratory.
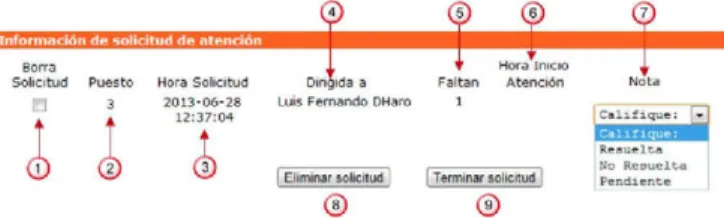
Once the students have been assisted, the interface allows them to qualify the received assistance by using a combo box in the web form (see number 7) and clicking on the submit button (number 9). Three different scores are allowed: solved, unsolved, and pending. This grade is used to generate statistics about the work done by the student collaborators.
Finally, whenever the students are able to solve the problem before receiving the assistance, they have the possibility of deleting the request by first setting the checkbox (number 1) and clicking the accept button (number 8). The purpose of this two-step process is to avoid deleting a request by mistake.
C. Web form for instructors and student collaborators
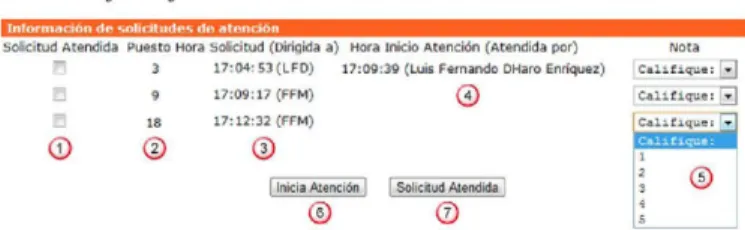
Figure 3. Web form for instructors showing the queue sorted by time .
Figure 3 shows the web form that instructors and student collaborators use to see the pending requests. The queue includes relevant information about the request, for instance:
• Workstation number (number 2)
• The time when the request was made (number 3)
• The name or abbreviation of the person to whom the
request is specifically addressed (name/abbreviation inside the parentheses in number 3)
• The starting time in case the request is being handled and
the person who is handling it (number 4)
• Only in the instructors’ form, there is an additional drop
down menu (number 5) to score the student progress for continuous evaluation purposes.
Once the assistance is finished, the request is removed from the queue list and the time required to complete the assistance is recorded. In case the attention is done by an instructor, the
system also requests them to score the student progress by using a drop down menu in the form (number 5) and using a scale from 1 to 5, where 5 means that the student is up to date according to the proposed schedule. This information provides additional information to score the students’ performance at the end of the semester, but also to prioritize the students requests in the following sessions (see section III. E).
D. Collaborators’ statistics
In order to assess the performance of the collaborators, we created a web page where the collaborator students can login in to compare their assistance performance with respect to the others collaborators. In this page, see Figure 4, we show the following statistics: 1) the collaborator id , 2) total number of requests they have assisted, 3) the number of sessions they have been assisting students, 4) the average number of ass is tances per s ess ion, 5) the average time of the ass istance, 6) the average time to start an assistance, 7) the average number of unassisted requests, and 8) the average students’ score about their assistance. Regarding (7), we count the number of requests where the student collaborator is specifically requested but it is another person that finally assists the students. And regarding (8), at the end of the assistance, students have the possibility of providing a grade qualifying the assistance (number 7 in Figure 2). In this case, the higher the grade is , the better the assistance is .
Since the student collaborators can continuously check these statistics, they could improve their scores throughout the different sessions. Finally, these statistics are also analyzed during special meetings with the collaborators once per month, where we analyze and discuss issues such as the general behavior of the students, the upcoming developments, the ma in detected problems, as well as the projects developed by the collaborators themselves. During the meeting, the coordinators provide additional feedback to the collaborators regarding their o wn projects mainly to help them to acquire sufficient knowledge and skills to be able to solve their own problems but also to let them provide a better assistance.
E. Prioritization mechanism
Figure 4. Screen capture showing the statistics about the work done by collaborators
I V. EVALUATIONS
A. Objective Evaluation: Usability statistics
In this subsection, we will provide and analyze some statistics that we have collected using the proposed system on both courses along the last two academic years. The goal is to provide objective metrics that could prove the advantage of using the developed application, the importance of the work done by the instructors and collaborator students, and the students’ needs.
Item
No. of requests
No. of requests assisted by collaborators No. of requests assisted by instructors No. of requests that were not assisted in the session
Av. time and std. dev. of the collaborator’s assistance
Av. time and std. dev. of the instructor’s assistance
Av. time and std. dev. to start the assistance
Total
6900 4563 2337 916
Avg. Per session
24.64 16.30 8.35 3.27
05.55 ± 07:26
07:14 ± 11:04
17:47 ± 21:59
Table 1. Global statistics obtained for both laboratories.
Table 1 shows usage statistics of the service; here, the time values are given in terms of minutes and seconds. As we can see, there was a high number of requests (~7000) demonstrating the amount of work that collaborators (66.1%) and instructors do (33.9%). These percentages are explained considering that: a) the average an d standard deviation of the assistance time given by instructors and collaborators are different, b) students request assistance from the instructors when they have complex problems, therefore the duration is longer, and c) there are in average two collaborators and one instructor per session. On the other hand, we can see that 916 requests were not attended during the session and remained as
pending until the next session. Checking the log files, we found that most of these pending requests happened during the critical sessions, but also during the first three weeks (25.5%) when the new collaborators and instructors needed to get used to the application interface, and so they did not finish correctly the request. Therefore, some clear guidelines will be provided for the next years to avoid these initial problems. Finally, the table shows the average time required for starting the assistance. This statistic is important since it could allow students to take advantage of that time to continue working on their projects without stopping it until the requested person comes.
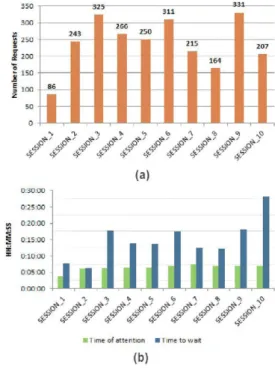
Figure 5. Usability statistics for a) average number of requests per session, b) the average time to wait for an attention and the
duration of the attention
the weeks before the intermediate evaluation sessions (i.e. students are urged to comply with the performance and functionality requirements scheduled for those control sessions) as well as in session 9 (i.e . students try to finish one week before the deadline to be able to ma ke basic improvements and to prepare the oral examination). On the bottom figure, we can see the length of the assistance and the time the students waited to be assisted. The figure shows that the duration of the assistance is almost constant which means that instructors and collaborators managed to keep the same level of assistance all the time; however, since the number of requests grows, the waiting time is inevitably increased. This result confirms some students’ complaints about waiting too much to be assisted and requiring new mechanisms to manage the number of available persons during those critical sessions. Although this information could be considered as evident, the objective information provided by the application allows the coordinators of the subjects to anticipate these problems and to justify the redistribution of collaborators or instructors for some sessions and specific turns.
B. Subjective Evaluation
At the end of each semester, and for the last two academic years, we requested all the students from each subject to fill in an optional and anonymous short survey (the same reported in [11]) consisting of ~25 questions about the proposed project, the available hardware/software equipment, to score and provide feedback about the work of the collaborators and professors, etc. Our main goal with the survey is to get a subjective vision about the laboratories and the ways to improve them. On the other hand, the information about who the students considered was the best collaborator along the semester allowed us to score them in combination with our other metrics. This time, we have included three optional questions about the proposed system. In the next paragraphs, we will describe each question and the obtained results.
1) Mark the utility of the online system for requesting assistance. The range is from 0 to 10, where 0 means that the system is completely useless and 10 completely useful.
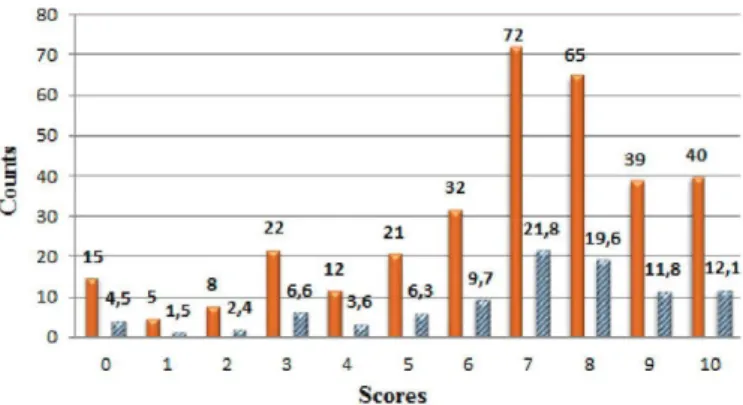
Figure 6 shows the statistics of this question that was answered by a total of 331 students. The mean value is 6.67 and the mode 7.0. Here, we highlight that almost 80 students (~24% of the students that answered the question) considered the system as very good since they provided a score ranging from 9 to 10. Regarding the students that scored the system between 0 and 4, they were 62 students that accumulate up to 18.6%. An explanation for this mark, as we will see when describing the results of the next question, is that students were not happy about the number of available instructors and collaborators that they could request, especially during the critical sessions, thus showing their disapproval with this fact rather than evaluating the system itself.
Figure 6. Results about the utility of the application. The left bar (orange) is the number of students that marked the same score, and the right bar (in blue with diagonal lines) the percentage of students whose mark falls in the same category.
2) Comment only the issues that you consider negative of the system for requesting assistance.
The total number of students that answered this question was 144 (43.5% over the total that answered the survey). Observe that the question was formulated to request only for the negative aspects of the system; however, 31 students used this question to mention that it was very good and no change was necessary. In Table 2, we have summarized the most frequent negative comments and the number of students that had the same opinion.
No. Answer Total
1 2 3 4
The number of available persons was low The time waiting to start the assistance was too long
The person that finally assisted the request was different to the one initially requested The online system is not necessary. It is better and easier to make the request directly to the instructor/collaborator
38 38
17
13
Table 2. Most frequent negative comments about the application.
When analyzing these results and the objective statistics, we detected that complaints 1, 2 and 3 were related to each other, since they are related with problems that mostly happen during the critical sessions of the subjects, and because typically the same person mentioned both complaints in the survey at the same time.
that although the average number of instructors and collaborators per session is three, in the last sessions the process of solving questions could take more time since instructors need to go through a complete system where many modules and components are involved, or to debug large software programs that execute a multithreaded application. On the other hand, the third complaint refers to a situation where the requested person does not come on time since she/he could be solving other students’ problems , then a different person to the one requested came in an attempt to guarantee the attention; however, students complain because this increases the attention time since they need to explain the problem to the new assistant from the beginning. One solution we have included for the next year is the possibility of requesting the assistant with a specific or a generic instructor or collaborator; therefore, the queue will show only the specific requests plus the generic ones, instead of showing the requests to all other instructors or collaborators.
The fourth complaint is that some students show their preference to go back to the traditional approach of students standing up from their workstation and start looking for the instructor/collaborator to directly ma ke the request. Unfortunately, this mechanism had many drawbacks, for instance: a) if the instructor is occupied with other students, he/she will need to pay attention to the person making the new request interrupting the current attention (in comparison, the online system allo ws an uninterrupted attention). b) students would need to go to all the other instructors/collaborators to ma ke the same request, or to wait for a specific one when others are available, besides, if the students made the same request to different persons all of them could try to come to assist (the new system avoids these problems and optimize the distribution of the requests), and c) In case the instructor forgets the request, the students will not receive the attention on time (the new system minimizes this problem).
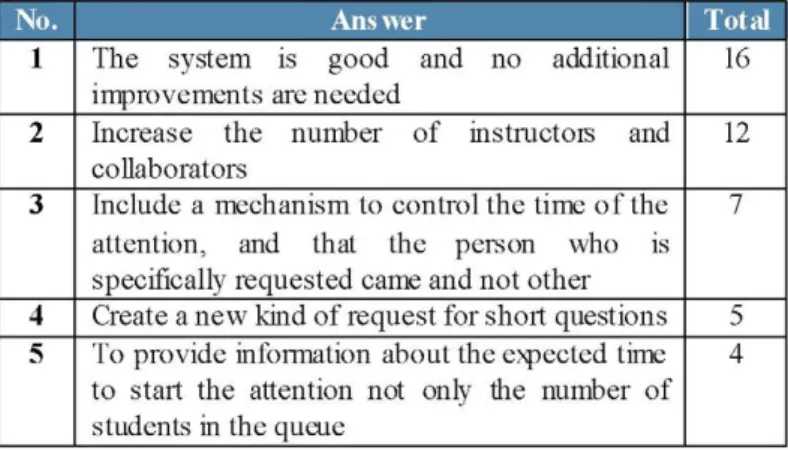
3) Comment how you would improve the online system for requesting assistance.
62 students answered this question and their co mments are summarized in Table 3. From this question, we want to highlight again that 12 students considered that the system was good and not additional improvements were needed. In addition, many of them added that they considered it as a clean and fair mechanism for requesting help at the laboratory. The second idea is not related with the application itself, although for the third idea we could include some kind of warning messages in the instructors and collaborators forms to display their attention time and to indicate them if their last attention was too long. Regarding the fourth item, some students suggested the creation of a special kind of request to solve short questions and that can be set on the queue on the first positions for a fast attention. This is a functionality we could add in addition to our current prioritization mechanism including new rules for controlling the number of requests of
this kind that a couple can do in order to try to guarantee an optima l use of this feature.
No.
1 2 3
4 5
Answer
The system is good and no additional improvements are needed
Total
16
Increase the number of instructors and 12 collaborators
Include a mechanism to control the time of the attention, and that the person who is specifically requested came and not other
7
Create a new kind of request for short questions 5 To provide information about the expected time
to start the attention not only the number of students in the queue
4
Table 3. Statistics about how to improve the system
Finally, some students requested the possibility of providing an estimated time about how much students would have to wait for the requested person to come. Although this information is difficult to estimate, an approximated value could be provided taking into account the usage statistics per session provided in Table 1 and Figure 5, as well as the average duration of the assistances during the current session.
V. CONCLUSIONS
In this paper, we have described a complete web-based system that allows students from two massive laboratory courses to request help from instructors or collaborators using an ordered and transparent mechanism. This system has the advantage that it can be accessed using any kind of hand-held device (PDA) or PC through an Internet connection. The system includes different kind of forms that allow students, instructors and student collaborators to access to the online request service and organize the process of providing the assistance. Moreover, the system includes additional tools for performing continuous evaluation allowing instructors to follow better the students’ work. In addition, objective usage statistics are shown to the collaborators allowing them to improve their assistance and to instructors to evaluate them.
VI. FUTUREWORK
Considering the results obtained from the objective and subjective evaluations, as well as comments from collaborators and instructors, we propose the following ideas as relevant improvements for the system. First, in order to reduce the waiting time , we propose the inclusion of colorful messages to the instructors and collaborators at the end of the assistance in case that the attention was too long.
Second, in [12] it is described an online forum monitored by the instructors, where the students can propose, discuss or answer to information related with the subject. The metrics extracted from the participation in the forum allow the instructors to predict the final students’ scores. We plan to follow a simila r approach here taking the usability metrics as a predictor of the students’ and collaborator students’ scores. Our goal would be to provide additional tutoring over the potential students which could not succeed in their project but also to help the best students to achieve better scores.
Finally, [13] describe and analyze a complete list of web-based interactive programming environments and tools that can be used to simplify the learning of programming languages and concepts. These applications are analyzed and classified according to their capabilities and focus. In our case, the idea would be to use similar URLs and display them through the queue form of the students, in order to provide dynamic help in case students mention that they have a specific problem with the programming language or about how to use a given electronic component. Since this information is displayed in the form during the time they are waiting for the attention to start, the students can take advantage of that time to check this proposed information.
VII. ACKNOWLEDGEMENT
We want to specially thank to Luis García, Francisco Romero, José Miguel Jiménez, and Victor Iglesias for their administrative support at the laboratory and all the members of GRIDS innovation group in the Electronic Engineering Department at UPM; we also thank Prof. Javier Macias and Ignacio Shyri Villar for their important software contributions. Finally, we want to thank Álvaro de Guzmán Fernández González and Roberto Barra Chicote for their support as course coordinators for LCEL and LSED subjects respectively, as well as to all instructors and student
collaborators for using the system.
This work has been supported by I N A P R A project (DPI2010-21247-C02-02) and for the U P M innovative project No. IE12_13-09004 leaded by Pedro José Malagón Marzo.
REFERENCES
[I] V. - A . Romero-Zaldivara, A . Pardo, D . Burgos, C . Delgado. 2012. "Monitoring student p rogress u sing virtua l applian ces: A ca se study". Computers & Education. Vol. 58(4), May 2012, Pages 1058–1067. [2] R . San-Segundo, J . M . Montero, J . Macías-Guarasa, R . Cordoba, J .
Ferreiros. 2005. “Automatic Tools for Diagnosis And Feedback In A Project Based Learning Course”, in Proceedings of the 35th Annual Conference Frontiers in Education, FI E '05, pp. S2D-17.
[3] J . M . Montero, R . San-Segundo, R . Cordoba, A . Marin de la Barcena, A . Zlotnik. 2009. "Automatic Tools for Software Quality Analysis in a Project-Based-Learning Course". International Conference on Education an d New Learning Technologies, Barcelona, Spain.
[4] M . A . Gerosa, D . Filippo, M . Pimentel,H. Fuks, and C.J.P. Lucenad. 2010. "Is th e unfo lding of the group discussion off-pattern ? Improving coordination support in educational forum s usin g mobile d evices", Computers & Education, Vol. 54 (2), February 2010, Pages 528–544 [5] J . M . Montero, R . San-Segundo, R . Córdoba, A . M . de la Bacerna,
Zlotnik, A. 2009. “Strengthening Web Based Learning th ro ugh Software Quality Analysis”. Advances in Web-based Learning-ICWL 2009, Vol. 5686 pp. 277-286.
[6] J . M . Montero, R . San-Segundo, J . Macías-Guarasa, R . Cordoba, J . Ferreiros. 2006. “Meth odology for the Analysis of Instructors´ Grading Discrepancies in a Laboratory Course”. International Journal of Engineering Education vol.22(5), part . I I pp. 1053-1062.
[7] Zlotn ik , an d J. M. Mont ero . 20 07. “DRAC (Distrib uted Remo te ACess system ) An On-line Open Source P roject-based Learning Tool”, Conference ICL2007, September 26 -28, 2007, Villach, Austria. [8] F . Fernández; J . M . Montero, A . Zlotnik, R . Cordoba, R . San-Se gundo,
L.F. D'Haro. 2011. “New teaching methodolog y fo r electronics a nd its adaptation to th e European space for h igher education” FINTDI, Zaragoza, Spain pp.1-7.
[9] M . López-Vallejo, Á . Fernández, P . Ituero, and G . Caffarena. 2008. “Acceso Remoto al Laboratorio de Diseño Microelectrónico como complemento a la s Asignatura s Teóricas Relacionadas”. II Jornadas Internacionales U.P . M sobre Innovación Educativa y Convergencia Europea (INECE'08). Madrid, Spain 9-11 December 2008.
[10] J . Macías-Guarasa, J . M . Montero, J . D . Romeral, J . Ferreiros, R . de Córdoba. 2003. "Herramienta s web de a yu da pa ra la gestión automática de laboratorio s masivos", X I Congreso Universitario de Innovación Educativa en las Enseñanzas Técnicas 1(1). ISBN:84-688-2216-7. [ I I ] Macías-Guarasa, R . San - Segundo, J . M . Montero, Á . Araujo, O .
Nieto-Taladriz. 2006. “A Project-Based Learning Approach to Design Electronic System s Cu rricula”. I E E E Transaction on Education, vol. 49, nº 3, pp 389-397.
[12] C . Romero, M . I . López, J . M . Luna, S. Ventura, “Predicting students' final performance from participatio n in on-line discussion forum s”, Computers & Education, Volume 68, October 2013, Pages 458-472. [13] F . P . Deeka, K . - W . Hoa, H . Ramadhan. 2000. "A critical analysis and