Slowdown intracranial glioma progression
by optical hyperthermia therapy: study on a
CT-2A mouse astrocytoma model
Oscar Casanova-Carvajal Ana Lorena Urbano-Bojorge
Milagros Ramos José Javier Serrano-Olmedo and
R Martinez-Murillo
Abstract
Metallic nanorods are promising agents for a wide range of biomedical applications. We report
an optical hyperthermia method capable of inducing slowdown tumor progression of an
experimental in vivo CT-2A glioblastoma tumor. The tumor model used in this research is based
on the transplantation of mouse astrocytoma CT-2A cells in the striatum of mice by intracranial
stereotaxic surgery. Two weeks after cell implant, the resulting tumor is treated by irradiating
intratumoral injected gold nanorods, biofunctionalized with CD 133 antibody (B-GNRs), using a
continuous wave laser. Nanoparticles convert the absorbed light into localized heat (reaching up
to 44 °C) due to the effect of surface plasmon resonance. A significant slowdown in CT-2A
tumor progression is evident, by histology and magnetic resonance imaging, at one (p = 0.03)
and two weeks (p = 0.008) after irradiation treatment. A notable deceleration in tumor size
(15%—75%) as compared to the control untreated groups, it is observed. Thus, laser irradiation of
B-GNRs is found to be effective for the treatment of CT-2A tumor progression. Similarities
between the pre-clinical CT-2A tumor model and the human astrocytoma disease, in terms of
anatomy, metastatic behavior and histopathology, suggest that hyperthermic treatment by laser
irradiation of B-GNRs administered into high-grade human astrocytoma might constitute a
promising alternative treatment to limit the progression of this deadly disease.
Keywords: CT-2A cells, glioblastoma, gold nanorods, hyperthermia, syngeneic mouse
(Some figures may appear in colour only in the online journal)
1. Introduction (GBM) are the most aggressive type of primary brain tumor
and despite medical intervention the median survival is only
Cancer is the second leading cause of death in the world; in 12-15 months and 5 year survival is less than 5% GMB
2015 caused 8.8 million deaths. According to the World [2-4]. Infiltrating cancer cells beyond the boundaries of the
Health Organization [1] nearly one out of six deaths in the tumor edge are responsible for tumor recurrence as well as
world is due to this disease. Primary brain tumors represent radiation and chemotherapy resistance [5-7].
in the nanometric scale range for a specific diagnostic or
therapeutic purpose. These advances in nanotechnology have
allowed the development of gold nanostructures with optical
properties that are useful in biomedical applications like drug
delivery, hyperthermia therapy, and image contrast agents due
to their biocompatibility and optical tenability [8-11]. Gold
nanoparticles are highly appealing for cancer diagnostics and
therapy because gold is almost an inert material (high
resistance to corrosion), it has low toxicity and it is easy to
anchor biocompatible ligands to its surface [12].
Biofunctionalization of gold nanoparticles techniques are
well-known procedures for biomedical technologies both
in vitro and in vivo
[13, 14]. Gold nanoparticles conjugates
with specific antibodies for breast cancer have been recently
used for hyperthermia in order to increase the specificity in
anticancer treatments [8, 14-16]. Experimental
neuro-oncol-ogy demands the creation of appropriate animal models to
assess the efficacy of innovate approaches for the treatment of
human tumors. This is the case of CT-2A astrocytoma model,
this cellular model has advantages compared to cellular lines
such as U87, where the high proliferation of CT2A was
evidenced, being these more invasive [14-18]. CT-2A
astrocytoma model was used for therapeutic screening in
preclinical trials in this study. Imaging technologies in the
CT-2A model measuring tumor growth would provide
insights on gold nanorods (GNRs), biofunctionalized with
CD 133 antibody (B-GNRs), efficacy (see section 4.5). The
CT-2A cell line overexpresses the membrane receptor
CD 133. Recently, CD 133 antibodies have been employed in
nanomedicine, oriented towards hepatocellular carcinoma
[19]. Experimental neuro-oncology demands the creation of
appropriate animal models to assess the efficacy of innovate
approaches for the treatment of primary human brain tumors
[20, 21]. Due to similarity of the CT-2A tumor model to
human astrocytoma disease in terms of anatomy, metastatic
behavior and histopathology [17, 18], this mouse model
becomes an excellent candidate to assay new anticancer
procedures.
Based on using B-GNRs, together with laser irradiation
(808 nm wavelength continuous wave laser source), we
pre-sent here evidence that our hyperthermia procedure provides
basis for a new anti GBM therapy. This paper reports for the
first time beneficious effects of this technology limiting
intracranial CT-2A mouse astrocytoma tumor progression.
The B-GNRs used in the present study showed high
cyto-compatibility, as previously reported in vitro [19, 22]. The
tumor biology of the CT-2A immunocompetent glioblastoma
murine model, derived from a malignant astrocytoma
ori-ginally formed after the intracerebral implantation of
20-methylcholanthrene pellets into C57/BL6 mice [23], shows
close similarities with the human glioblastoma disease thus
becoming an excellent candidate to assay new anticancer
procedures.
In this study, C57BL/6 mice were stereotaxically
inoculated with CT-2A glioblastoma cells, administered
directly in the striatum. After two weeks, the resulting tumors
were treated with the optical hyperthermia technique
descri-bed below and the tumor volumes analyzed by in vivo MRI.
The data show arresting in tumor growth in treated mice as
compared with their respective controls.
Glioblastoma is highly infiltrative, thus resection is
pro-blematic and recurrence frequent. The photothermal treatment
would complement the resection surgery of the solid tumor
mass by treating infiltrated tumor cells within tumor
environment. Essays combining surgical resection of tumors
and optical hyperthermia treatment, are also in course.
2. Results and discussion
The experiments have been performed in a characterized
CT-2A orthotopic model of malignant mouse astrocytoma[17, 18]
as result of intracerebral injection of the cell line CT-2A [23]
into the caudateputamen (CP). The resulting CT-2A
malig-nant tumor exhibited characteristics of human high-grade
astrocytoma, as shown by anatomy, histopathology, and
non-invasive imaging procedures (MRI) (figures 3 and 4 and 6,
and 8). Tumor-host Interactions are a far-reaching relationship
and extend well beyond the local tissue microenvironment,
thus mouse models should be orthotopic to better reproduce
tumor biology and should also consider the contribution of
the immune system. For these reasons, the chosen CT-2A
tumor model in this study was orthotopic and accomplished in
immunocompetent syngeneic mice.
2.1. Tumor growth
MRI
O
&
J?
£ &
"V
•H-Two Weeks
¿6
0 ¿?
T^
Week 1
after AT
J
<<?Weeks 2
after AT
¿f
**
Weeks 3
after AT
¿6
/
Weeks 4
after AT
f
/
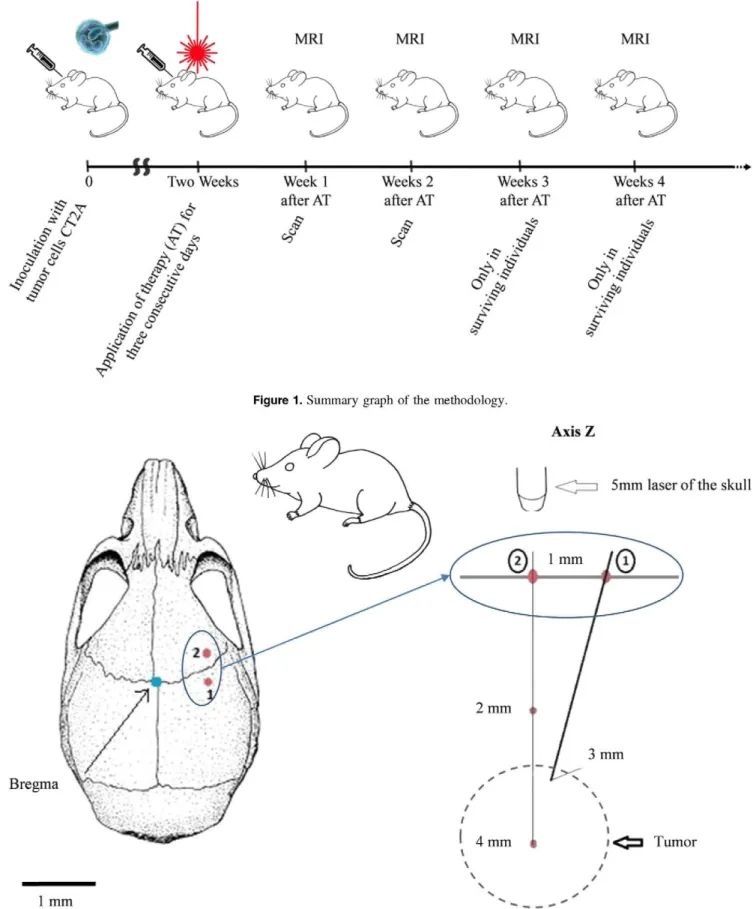
Figure 1. Summary graph of the methodology.
Axis Z
Bregma
5 mm laser of the skull
Tumor
1 mm
Figure 2. Methodology of hyperthermic temperature measurements.
2.2. MRI analysis
obtain precise images of the tumor vascularity, with a
reso-MRI is the most commonly used diagnostic tool for glio- lution limit of 0.8-1 mm
3. This information is needed to
.
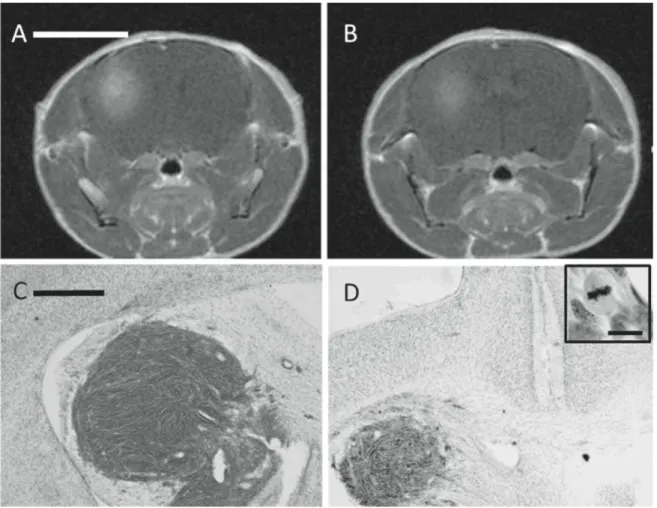
Figure 3. Cell proliferation as seen by MRI and H&E staining. Panels (A), (B), represent Tl-weighted (Gadolinium postcontrast) images
corresponding to the same experimental CT-2A tumor depicted in (C), (D), respectively, showing the tumor progression at different rostro-caudal levels, two weeks following cell implant. Notice that in (A) and (B) the hyperintense signal is restricted to the CP in the right hemisphere. Inset in (D) shows a mitotic image nearby a neoformed blood vessel. Scale bars: A, B — 5 mm; C, D — 1 mm, inset in
D — 15 fim.
Figure 4. Characterization of CT-2A induced brain tumors. (A) Coronal 1 mm thick coronal sections through the same mouse brain with a
hemorrhagic CT-2A tumor mass lying in the right cerebral hemisphere, 28 d following CT-2A cell injection. The photograph was taken after
in vivo MRI (B) and removal of the brain at the time of necropsy for histology. (B) Panels represent Tl-weighted (Gadolinium postcontrast)
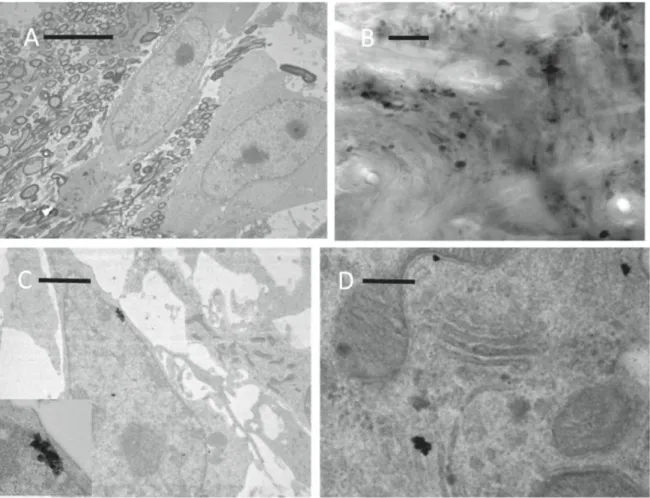
Figure 5. (A) Electron microscopic image of osmium-stained CT-2A tumor cells illustrating the ultrastructural appearance of tumor cells in
the transition zone with the striatum. Tumor cells show cytological pleomorphism with prominent nucleoli, slender processes and characteristic heterochromatin. Notice adjacent myelinic fibers of the striatum in the surrounding neuropil and apparent edema, suggesting inflammation of the tissue. (B) Light micrograph showing intratumoral B-GNRs deposition attached to tumor cells, mainly nearby capillaries, as revealed by immunohistochemical staining. (C) and (D), Illustrate deposition of the intratumoral injected B-GNRs. B-GNRs are detected as electron-dense complexes that are attached to the nuclear membrane (C) and also dispersed in the cytoplasm (D). Inset in (C), is a higher power magnification of the electron-dense product shown in (C). Scale bars: A — 15 /mi; B — 10 /mi; C — 5 /mi; D — 0, 25 /mi.
(B), and 4(B) and 7, and 8). Evaluation by MRI of tumor limits correlated accurately with the histopathological loca-tion of CT-2A cells (figures 3 and 4). Characteristically, T l -weighted images marked the increase of angiogenesis in the tumor limits which helps to delineate precisely the tumor margins (figure 4(B)). Tl-weighted imaging to verify tumor growth and location was routinely processed every week (figures 7 and 8). MRI images revealed that the tumor mass arose initially in the CP (figures 3(A), (B) and 7(A)), spreading over time rostro-caudally, eventually involving surrounding areas of the CP, including cerebral cortex and hippocampus (figures 4(B) and 8(B), (D)). Tumor mass was barely detectable one week post-transplant, reaching an unbearable status at 4 weeks (figures 4(B) and 7(B)). At this time post implantation, the tumor growth resulted in marked deformation of surrounding brain structures in mice showing signs of intracranial pressure and neurological complications. Hypointense areas in the center on Tl-weighted enhanced images, suggesting central necrosis, were frequently seen (figures 4(B) and 8(B), (D)), that were confirmed by histo-pathology in all cases. Experimental animals were sacrificed when signs of motor dysfunction arise or exhibited symptoms
consistent with failure to thrive, as per animal care protocols that advised its sacrifice.
2.3. Immunohistochemistry
IS
A'- *.-v
Figure 6. Immunocytochemical characterization of induced brain tumors in C57BL/6 mice, 21 d following CT-2A cell line implantation.
Light micrographs (A)-(C), illustrate Ki67 (A), (B) and CD133 (C) positive cells in the tumor mass. Notice in (A) that numerous intratumoral blood vessels (asterisks) are seen in the tumor mass. Also in (B) that ki67-positive cells exhibit immunoreaction product in the cell nucleus of cells that characteristically arranged around a capillary. In addition, see in (C) puncta of CD133-immunoreaction product restricted to tumor cells. The yellow color at the bottom of the left hand side in (C) represents a hemorrhagic region. (D) Illustrates tumor-associated neo-angiogenesis by double immunofluorescence staining for BrdU (cell nucleus, red) and Nestin (prolifetarive endothelium, green). As previously reported for human gliomas, Nestin-immunoreactivity was found as a marker in this study for proliferative endothelium in the CT-2A model. Inset in (D), shows details of an anomalous proliferating capillary. Scaler bars: A — 500 /an; B — 200 fim ; C — 50 fim; D — 100 fim; Inset in D — 50 fim.
mimics the human high-grade astrocytoma disease in terms of anatomy, metastatic behavior and histopathology.
2.4. Efficacy of biofunctionalization
To test the efficacy of B-GNRs as a tool to bound tumor cells, we examined by immunohistochemistry the cellular location of B-GNRs in tissue sections (see section 4.5). For this, tissue sections were processed to detect endogenous CD 133 using the sample resuspension of B-GNRs compound as primary antibody. Immunohistochemistry was carried out as shown for CD133 immunohistochemistry in section 4.4. (Immuno-histochemistry). For this, resuspended B-GNRs compound, diluted 1:100 in PBS containing 0.2% Triton X-100 was used as primary antibody. Tumor sections, 40 /im thick, were incubated overnight at 4 °C with continuous stirring. Then, tissue sections were thoroughly washed and processed as for
CD133 immunohistochemistry in section 4.4. By light microscopy, we found the reaction-end product labeling exclusively proliferating CT-2A cells, following the same cellular distribution as that observed for CD 133 immunohis-tochemistry (figure 5(B)). The latter suggesting that GNRs consistently bear anti-CD 133 antibodies.
2.5. Electron microscopy
30-, 0s U
•125-tí '§ .O 2 20 -4-> O u2
15-5
o >q
5-l ^ ^ 5-l CD133-GNRs
^ C o n t r o l
Weekl Week 2
The size of the tumor after treatment
Figure 7. Tumor volume, expressed as a percentage of total brain
volume, in control mice and B-GNRs + Laser (CD133-GNRs), at
Week 1 and Week 2 (time periods after laser irradiation). The data
represent the mean ± SD of n — 3 independent experiments.
Student-t test revealed a significant difference (p — 0.03) between
Control and CD133-GNRs at Week 1. The CD133-GNRs group
reached higher significance benefit** at Week 2 (p — 0.008).
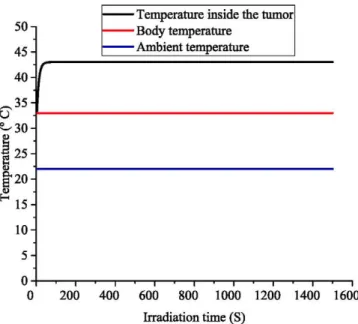
2.6. Temperature measurements
in order to corroborate the generation of an adequate
increase in temperature to eliminate cells by hyperthermia,
changes in temperature were determined in situ, after the
injection of the B-GNRs as described in section 4.8. The
results shown a temperature increase up to 40.0 °C ±
0.5 °C in the control group (figure 9). In contrast, a increase
of the temperature up to 43.0 °C ± 1.0 °C was evidenced in
the group injected with B-GNRs and irradiated with laser,
using the same methodology in all the variables the
dose-metric was 25CEM43. The measurements were made for a
time of 25 min. These values were in agreement with results
inprevious reports [25, 26].
2.7. Photothermal therapy
Tumor growth was analyzed at two time points: one week
after laser irradiation, that is to say, threeweeks after cell
implant (Week 1), and two weeks after laser irradiation, that
means, four weeks after cell implant (Week 2). In other
words, 168 h and 336 h, after laser irradiation of
endogen-ously administered B-GNRs (CD133-GNR, 18 animals) and
control PBS + Laser (Control, 9 animals). Figure 7 shows
differences in tumor volume ratios between the CD133-GNRs
and control groups which provide information about the
tumor evolution as a percentage of the tumor volume with
respect to the total brain volume. The tumor volume was
measured by MRI at different post-treatment times:'Week 1'
and 'Week 2', following control (PBS + Laser) and
B-GNRs + Laser (CD133-GNRs) post-treatments (figure 8).
At Week 1, CD133-GNRs group showed a significant
reduction in tumor volume with regard to control (p = 0.03):
1.8% versus 4.7%, with respect to the brain size. It is
note-worthy that differences in tumor progression between these
group became highly significant (p = 0.008) at Week 2: 8.1%
versus 22.9 with respect to the brain size. These data support
the idea that intratumoral CD133-GNRs+Laser treatment
exerts a potent tumoricidal effect in the CT-2A mouse
astrocytoma model. Interestingly, two mice survived for more
than 3 weeks after treatment, in separate experiments.
In this study, B-GNRs+laser treated mice showed a clear
behavior of tumor reduction. Tumors were analyzed in
con-secutive weeks 1 (three weeks after CT-2A implant) and 2
(four weeks after CT-2A implant), after the initiation of
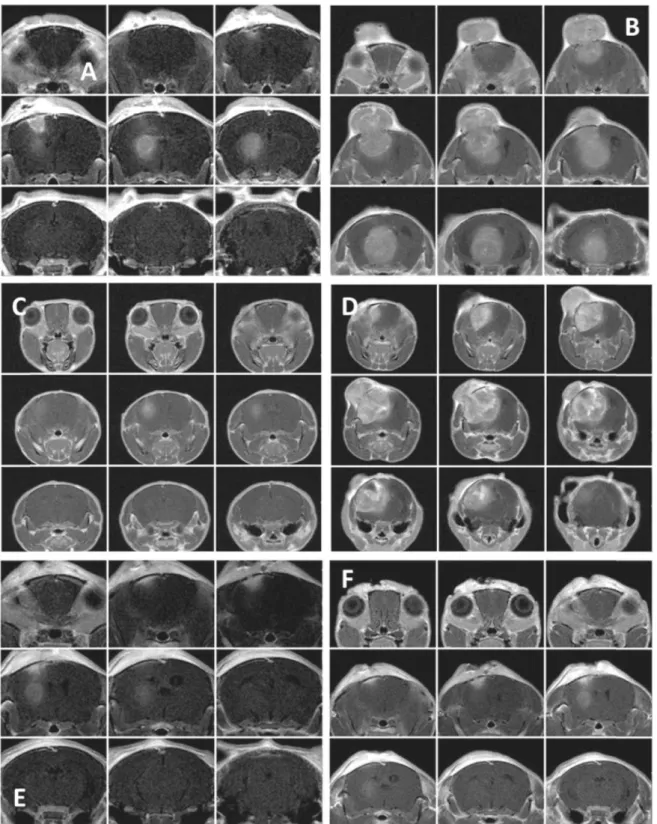
hyperthermia treatment (figure 8). Panels in figure 8
corre-spond to MRI of the same brain sections of three
repre-sentative mice: control PBS+laser irradiation (figures 8(A),
(B)), B-GNRs without laser irradiation (figures 8(C), (D)) and
B-GNRs+laser irradiation (figures 8(E), (F)), acquired in
weeks 1 (figures 8(A), (C), (E); three weeks after CT-2A
implant), and 2 (figures 8(B), (D), (F); four weeks after
CT-2A implant). The initial tumor mass in the striatum was faint
one week after B-GNRs+laser irradiation (figure 8(E))
comparing to controls (figures 8(A), (C)). In the B-GNRs
+laser group (figures 8(E), (F)) the tumor mass showed a
progressive decline, from 0.68% in 'Week 1' (3 mm
3), to
0.37% in 'Week 2' (2 mm
3) and 0.22% in 'Week 3'
(0.99 mm
3), comparing the total brain size, reaching a
mini-mum value of 0.17%, four weeks after treatment.
3. Conclusions
This study shows the efficacy of B-GNRs +Laser treatment
promoting the tumoricidal effect of the optical hyperthermia
on an in vivo CT-2A astrocytoma model. This treatment
constitutes a promising alternative choice to treat intracranial
neoplasms in humans. Reduction of intracranial tumor
volume following this procedure can be considered as an
outstanding achievement in the treatment of this deadly
can-cer that opens new avenues in the comprehension and
treat-ment of primary brain cancer, supporting future research in
this field.
4. Materials and methods
4.1. Cell culture
Figure 8. Shows MRI images of mice randomly chosen from groups: control (PBS + Laser) (A), (B), B-GNRs without laser (C), (D) and
B-GNRs +Laser, for 'Week 1' (A), (C), (E) three weeks after CT-2A implant) and 'Week 2' (B), (D), (F) four weeks after CT-2A implant) post-treatments, respectively. These images show an apparent deceleration in tumor progression in the CD133-GNRs (B-GNRs) + Laser group.
monolayer attached to the substrate. The attachment of CT-2A cells is essential for their proliferation. Upon reaching confluency, the cells were trypsinized and collected. The pellet was resuspended in RPMI 1640 medium and the cell suspension was adjusted to obtain an appropriate concentra-tion of cells for injecconcentra-tion ( 8 x 1 0 cells in 4 /A) [27].
4.2. CT-2A tumor model
A total of three experiments were conducted using adult
50
45 4
40 H .35
- Temperature inside the tumor
- Body temperature
- Ambient temperature
Í
S-30-^25-1 H 20- 15- 10- 5-00 200 400 600 800 1000 1200 1400 1600
Irradiation time (S)
Figure 9. Hyperthermic temperature measurements.
and treated with laser, and 6 animals only injected with B-GNRs without laser (see figure 8). No statistically sig-nificant differences were detected between the control groups. It is worth noting that, it was merged into a single group. The animals were housed with free access to food and water in an animal room with a controlled temperature and a natural light cycle. Daily routines were performed between 7 a.m. and 4 p. m. by authorized personnel. CT-2A cells were implanted into the right CP by stereotaxic assistance (David Kopf Instru-ments, Tujunga, CA, USA). While under deep anesthesia, twenty-seven animals were operated following a previously reported procedure [17]. The tumor cells were injected in a volume of 0.15 ¡A for a time frame of 15 min, this amount was equivalent to approximately 3.000 cells. Two weeks after CT-2A cell implant, cell proliferation was confirmed in vivo by Tl-weighted gadolinium MRI, and postmortem by H&E staining (figure 3). Surgical procedures were carried out by using a thermal blanket to keep under control the corporal temperature of the experimental animals to prevent the temperature from failing due to anesthesia. All procedures were performed under Spain and Spanish National Research Council (CSIC) Regulations for animal care (laws 53/2013 and ECC/566/2015).
4.3. Histopathology
Histopathology was performed on coronal tissue sections through the same rostro-caudal levels from fixed brains that were previously inspected by MRI as exhibiting tumor growth (figure 3). Deeply anesthetized mice were perfused transcardially through a blunt cannula with 20 ml phosphate-buffered saline from Gibco (PBS) followed by 40 ml of 4% paraformaldehyde (PF) in 0.1 M phosphate buffer (PB), pH 7, 4. Brains were then dissected-out and immersed for 4 h in the same fixative, at room temperature. For H and E stain, tissue blocks were paraffin embedded and then cut coronally in
5 /im thick sections (figures 3(B), (C)) with a microtome Leica Jung RM 2045.
4.4. Immunohistochemistry
For light microscopy immunohistochemistry, fixed brains were cryoprotected with 30% sucrose for 1 d. After the brains sink, histological sections 40 /im thick were then obtained in the coronal plane with the aid of cryostat (Leica CM1950). Endogenous CD133 protein expression in the CT-2A tumor was evinced by using polyclonal antibodies (St John's laboratories, STJ201168). To evaluate cell proliferation, Ki67 immunostaining was also carried out [28] by using polyclonal antibodies (abl5580 abecam). Immunohistochemistry was performed in free floating sections following the avidin-bio-tin-peroxidase complex (ABC) method [29]. After endogen-ous peroxidase blockade by preincubating tissue sections in 1% H2O2 in PBS for one hour, the sections were incubated with 3 % normal serum diluted in PBS containing for 1 h at room temperature (RT, and then incubated overnight at 4 °C in the primary antibodies diluted in PBS containing 0.2% Triton X-100. Antibodies dilutions were: (i) CD133, 1:500 and (ii) Ki67. Tissue sections were then washed in PBS and later processed for the (ABC) method [29] (Vector Labora-tories, Burlingame, CA, USA) Peroxidase activity was developed by nickel enhanced 3,3'-diaminobenzidine tetra-hydrochloride (DAB) procedure as described elsewhere [30].
Stained sections were later washed, mounted and dehydrated for light microscopy visualization with the help of a Zeiss Axiophot II microscope (Zeiss Ibérica, Madrid, Spain) and images captured with a digital camera (DMC le, Polaroid, Cambridge, MA, USA). The method of BrdU labeling was also used for in vivo tumor cellular proliferation studies, following a procedure previously published by our laboratory [31]. As nestin was found as a marker for proliferative endothelium in gliomas [24], we combined nestin immuno-histochemistry with BdrU immunostainig to test co-localizations of both antigens in the tumor model by immunofluorescence staining. Immunofluorescence staining was performed by incu-bating tissue sections in the specific antibodies for BrdU (rat,
4.5. Biofunctionalization of gold nanoparticles with CD133 antibody
GNRs coated with protein G were used in this study.
Cur-rently, the GNR is being extensively used in biomedical
applications [13, 32, 33]. The Nanorod type, versus sphere,
has been the gold nanoparticle of choice as its synthesis is
relatively simple and reproducible, and are routinely used in
biomedicine for cancer imaging and therapy. GNRs
(10 x 40 nm C12-10-808-TPG-50, NANoPARTz, OD/ml:
50) were tuned to the laser source, with a surface plasmon
resonance peak (longitudinal band) at 808 nm. Protein G
captures a wide range of Ig's, including rabbit IgG, via the
IgG Fc-region. Thus, GNRs were coupled to protein G to
facilitate the biofunctionalization with CD 133 antibodies.
Commercial GNRs-protein G were resuspended thoroughly in
PBS to obtain a homogeneous suspension. For the Ig capture,
100 ¡A of GNRs-protein G solution was transferred to a tube
at RT and washed in PBS several times by centrifugation
5 min at 14.5 rpm, at RT. Then, polyclonal antibodies against
CD133 (St John's laboratory, STJ 20168) were added at a
1:500 final dilution in a solution made of 100 ¡A of washed
nanoparticles-protein G in 500 ¡A 3% BSA. The mixture was
incubated for 1 h with gentle rotative agitation, at 4 °C. The
mixture was then washed three times in 600 ¡A 3% BSA by
centrifugation 5 min at 14.5 x 1000 rpm, at RT. After the last
centrifugation, B-GNRs (GNRs-protein G-CD133 compound)
were resuspended in 100 ¡A PBS.
4.6. Optical hyperthermia device
A continuous laser wave (MDL H808, PSU-H-LED power
source; Changchung New Industries, Changchun Jilin, China)
working at 808 nm, with a maximum output power of 5 W, a
beam height from base of 29 mm, a beam diameter with an
aperture of 5-8 mm
3, and a laser head dimensions of
155 x 77 x 60 mm
3was used in this study. The laser was
connected to the system via a multimode optical fiber with a
core diameter of 600 /im, a length of 1.5 m, and a power
transmission of 90%-99% (600 ¡im MM fiber; Changchung
New Industries). The optical fiber was fixed to the stereotaxic
device, suspended vertically through a collimation lens
(78382, Newport, Irvine, CA) with the downward facing at
power density of 3.55 watts cm~ , using a Newport power
meter model 843-R with a Newport 818-SL photodetector.
4.7. Photothermal therapy
Two weeks after of tumor cell implantation, mice were
weighed and then anesthetized with 1% isofluorane.
Ran-domly selected animals were processed for photothermal
therapy. Using the same surgery protocol as in section 2.2
(Mouse tumor model), 2 ¡A of B-GNRs were injected at 4 mm
depth, the same place where the tumor cells were previously
injected two weeks before, at a rate of 0.5/ilmin
_1. After
5 min, a second dosage of 2 ¡A was then injected at 2 mm
depth by raising the needle appropriately. 10 min following
the second injection, the needle was withdrawn. In summary,
a total of 4 ¡A of B-GNRs were injected. The laser was
focused through the same burr hole previously used to inject
the tumor cells and the B-GNRs. The radiation process was
carried out for 25 continuous minutes. The procedure was
replicated for three consecutive days to eighteen mice called a
treated group, six mice per group (figure 1).
4.8. Temperature measurements
A thermal probe (Luxtron Corporation) was introduced into
the brain tissue through an additional 1 mm burr hole
(figure 2) in order to analyze the magnitude of the temperature
increase following laser irradiation of the B-GNRs particles
detected as described in section 4.7. The experiment was
carried out in three animals subjected to the same nanoparticle
injection protocol and illuminated with a laser for 25 min
Samples were recorded every second using the software
supplied by the manufacturer in software Lab View 2011
(figure 9).
4.9. MRI acquisition
MRI was performed at the Nuclear Magnetic Resonance
(NMR) and Electronic Spin Center of the Universidad
Complutence de Madrid (UCM) using 1 Tesla benchtop MRI
scanner [Icon (1T-MRI); Bruker BioSpin GmbH, Ettlingen,
Germany]. The system consists of a 1 T permanent magnet
(without extra cooling required for the magnet) with a
gra-dient coil that provides a gragra-dient strength of 450 m T m
- 1.
4.10. Ultrastructural studies
References
Experimental tumors treated in vivo by intratumoral injection with gold nanoparticles activated with CD 133 (B-GNRs), were processed following a correlated light and electron microscopic procedure [17] to examine the subcellular loca-tion of administered gold nanoparticles. For this, animals were fixed as for light microscopy except that the fixative was a mix of 4% PF and 0, 1% glutaraldehyde in PBS. The brain was then dissected out, post-fixed in 4% PF for 4 h., and then washed in PB 0.1 M. After fixation, tissue frontal sections 40 /im thick were obtained using a vibratome (Leica VT1000 S vibrating blade microtome) and processed for the ultra-structural analysis [17]. Ultrathin sections were obtained with the aid of a Reichert OM U3 ultramicrotome (Reichert, Germany), mounted on formwar-coated grids, stained with lead citrate, and examined under a Jeol 1200 electron microscope (Jeol, Tokyo, Japan) at 80 Kv.
4.11. Statistical analysis
Statistical Package for the Social Sciences software was used for all statistical tests. When applicable, results are displayed as the mean ± standard deviation of 3 experiments indepen-dent performed. Statistical significance was calculated using the Student's t-test with/? ^ 0.05.
Acknowledgments
We thank Ms Soledad Martinez (cell culture experiments), Centre for Biomedical Technology (CTB) for technical help. Also, PhD Teresa López de Mora for critical reading of the manuscript. The authors are thankful to their grant supporters, Universidad Nacional Experimental del Táchira (UNET)— Venezuela to Oscar Casanova-Carvajal. This study was also financially supported in part by CIBER-BBN (Spain) and NEUROCENTRO-CM (B2017/BMD-3760) consortium. Characterization of the MNPs has been performed by the ICTS 'NANBIOSIS', Unit 15 (Functional Characterization of Magnetic Nanoparticles) of the CIBER in Bioengineering, Biomaterials & Nanomedicine (CIBER-BBN) at the Center for Biomedical Technology (CTB) of the 'Universidad Poli-técnica de Madrid' (UPM). This work was carried out as part of Project PGC2018-097531-B-I00, funded by the Ministry of Science of Spain.
[1] Stewart B W K P and Wild C P 2014 World Cancer Report
2014 Irvine, California
[2] Gladson C L, Prayson R A and Liu W M 2010 The pathobiology of glioma tumors Annu. Rev. Pathol. Mech.
Dis. 5 33-50
[3] Wen P Y and Kesari S 2008 Malignant gliomas in adults New
Engl. J. Med. 359 492-507
[4] Method R 1969 Grading of astrocytomas Cancer 62 2152-65 [5] Mair D B, Ames H M and Li R 2018 Mechanisms of invasion and motility of high-grade gliomas in the brain Mol. Biol.
Cell 29 2509-15
[6] Kim E H, Song H S, Yoo S H and Yoon M 2016 Tumor treating fields inhibit glioblastoma cell migration, invasion and angiogenesis Oncotarget 7 65125
[7] Demuth T and Berens M E 2004 Molecular mechanisms of glioma cell migration and invasion J. Neurooncol. 70 217-28
[8] Kalantari M, Salouti M, Parivar K, Hamidi M and Emadi S 2018 The use of Gold nanorods conjugated with herceptin in breast cancer treatment by photothermal therapy method in mouse model Int. J. Nano Dimens. 9 123-33
[9] Dickerson E B, Dreaden E C, Huang X, El-Sayed I H, Chu H, Pushpanketh S, McDonald J F and El-Sayed M A 2008 Gold nanorod assisted near-infrared plasmonic photothermal therapy (PPTT) of squamous cell carcinoma in mice Cancer
Lett. 269 57-66
[10] Heidari Z, Salouti M and Sariri R 2015 Breast cancer photothermal therapy based on gold nanorods targeted by covalently-coupled bombesin peptide Nanotechnology 26
195101
[11] Fernandez Cabada T, Sanchez Lopez de Pablo C, Martinez Serrano A, del Pozo Guerrero F,
Serrano Olmedo J J and Ramos Gomez M 2012 Induction of cell death in a glioblastoma line by hyperthermic therapy based on gold nanorods Int. J. Nanomed. 7 1511-23 [12] Makkouk A R and Madsen S J 2013 Nanoparticle-mediated
photothermal therapy of brain tumors Optical Methods and
Instrumentation in Brain Imaging and Therapy ed
S J Madsen (New York: Springer) pp 235-51 [13] Fernández-Cabada T, Pablo C S-L, de, Pisarchyk L,
Serrano-Olmedo J J and Ramos-Gómez M 2016 Optical Hyperthermia using anti-epidermal growth factor receptor-conjugated gold nanorods to induce cell death in
glioblastoma cell lines J. Nanosci. Nanotechnol. 16 7689-95
[14] Yao C, Zhang L, Wang J, He Y, Xin J, Wang S, Xu H and Zhang Z 2016 Gold nanoparticle mediated phototherapy for cancer J. Nanomater. 2016 1-29
[15] Pourgholi F, Hajivalili M, Farhad J, Kafil H S and Yousefi M 2016 Nanoparticles: Novel vehicles in treatment of glioblastoma Biomed. Pharmacother. 11 98-107
[16] Day E S, Thompson P A, Zhang L, Lewinski N A, Ahmed N, Drezek R A, Blaney S M and West J L 2011 Nanoshell-mediated photothermal therapy improves survival in a murine glioma model J. Neurooncol. 104 55-63
[17] Martinez-Murillo R and Martinez A 2007 Standardization of an orthotopic mouse brain tumor model following
transplantation of CT-2A astrocytoma cells Histol.
Histopathol. 22 1309-26
[18] Binello E, Qadeer Z A, Kothari H P, Emdad L and Germano I M 2012 Sternness of the CT-2A immunocompetent mouse brain tumor model: characterization in vitro J. Cancer 3 166-74
and CD133 aptamers conjugation by PLGA nanoparticles
Nanomedicine 10 1863-79
[20] Piktel E, Niemirowicz K, Watek M, Wollny T, Deptula P and Bucki R 2016 Recent insights in nanotechnology-based drugs and formulations designed for effective anti-cancer therapy J. Nanobiotechnol. 14 1-23
[21] Abadeer N S and Murphy C J 2016 Recent progress in cancer thermal therapy using gold nanoparticles J. Phys. Chem. C
120 4691-716
[22] Jain P K, Huang X, El-Sayed I H and El-Sayed M A 2008 Noble metals on the nanoscale: optical and photothermal properties and some applications in imaging, sensing, biology, and medicine Ace. Chem. Res. 41 1578-86
[23] Zimmerman H M and Arnold H 1943 Experimental brain tumors: II. Tumors produced with benzpyrene Am. J. Pathol. 19 939-55
[24] Sugawara K I, Kurihara H, Negishi M, Saito N, Nakazato Y, Sasaki T and Takeuchi T 2002 Nestin as a marker for proliferative endothelium in gliomas Lab. Invest. 82 345-51
[25] Le Févre R et al 2017 Enhanced antitumor efficacy of biocompatible magnetosomes for the magnetic hyperthermia treatment of glioblastoma Theranostics 7 4618-31
[26] Thrall D E, Rosner G L, Azuma C, Larue S M, Case B C, Samulski T and Dewhirst M W 2000 Using units of CEM 43 °C T 90, local hyperthermia thermal dose can be delivered as prescribed Int. J. Hyperth. 16 415-28
[27] Abate L E, Mukherjee P and Seyfried T N 2006 Gene-linked shift in ganglioside distribution influences growth and
vascularity in a mouse astrocytoma J. Neurochem. 98 1973-84
[28] Lu G, Wai S M, Poon W S and Yew D T 2005 Ki67 and doublecortin positive cells in the human prefrontal cortices of normal aging and vascular dementia Microsc. Res. Tech.
68 255-7
[29] Hsu S M, Raine L and Fanger H 1981 The use of antiavidin antibody and avidin-biotin-peroxidase complex in
immunoperoxidase technics Am. J. Clin. Pathol. 75 816-21
[30] Rodrigo J, Springall D R, Uttenthal O, Bentura M L, Abadia-Molina F, Riveros-Moreno V,
Martinez-Murillo R and Polak S M J M 1994 Localization of nitric oxide synthase in the adult rat brain Phil. Trans. R.
Soc. B 345 175-221
[31] Muñetón-Gómez V C, Doncel-Pérez E, Fernandez A P, Serrano J, Pozo-Rodrigálvarez A, Vellosillo-Huerta L, Taylor J S, Cardona-Gómez G P, Nieto-Sampedro M and Martinez-Murillo R 2012 Neural differentiation of transplanted neural stem cells in a rat model of striatal lacunar infarction: light and electron microscopic observations Front. Cell. Neurosci. 6 1-19
[32] Kim D-H, Kim K-N, Kim K-M and Lee Y-K 2009 Targeting to carcinoma cells with chitosan- and starch-coated magnetic nanoparticles for magnetic hyperthermia J. Biomed. Mater.
Res. A88A 1-11
[33] Avvakumova S, Colombo M, Tortora P and Prosperi D 2014 Biotechnological approaches toward nanoparticle