TESIS DOCTORAL:
SIZING AND ENERGY MANAGEMENT FOR
PHOTOVOLTAIC PUMPING
Presentada por Imene Yahyaoui para optar al
grado de
doctora por la Universidad de Valladolid
Dirigida por:
Summary
Over the last few decades, photovoltaic energy has become an effective source to produce electricity that will be used either in isolated sites or injected into the grid. In isolated areas in particular, photovoltaic installations are already being used for pumping water for agriculture or human purposes, since photovoltaic installations are easy to install and, after installation, the maintenance cost is low. However, the inherent variability of the sources means that the installation has to be carefully sized so as to provide an adequate energy management algorithm.
So, this thesis focuses on the sizing and energy management of an autonomous photovoltaic installation used to pump water for irrigation in an isolated site. Typically, this type of installation is widely used in arid and semi-arid regions, such as the Maghreb and the South of Europe, where in addition, there is an important availability of solar radiation. The correct operation of these installations is needed, not only to fulfil the water demand, but also to optimize the use of the photovoltaic energy and to extend the life of the components. These objectives can be ensured by a good sizing of the components and an optimum energy management, which represents the two main contributions of this thesis.
power extraction have been studied. Then, the sizing algorithm has been validated using measured data of the target area (Medjez El Beb, Northern Tunisia).
The second part of the thesis deals with the energy management of the photovoltaic irrigation installation. Hence, a fuzzy logic based algorithm has been established, to manage the energy generated by the panels and stored in the battery bank. Fuzzy logic has been used, since it is easy to implement and our study is based on the knowledge of the user. The main idea behind the algorithm is as follows: depending on the photovoltaic power generated, the battery depth of discharge, the water level in the reservoir and the water flux, the connection and disconnection of the components is deduced by using some proposed fuzzy rules. The algorithm’s efficiency has been firstly evaluated by simulation and validated secondly in a plant installed in the laboratory, with satisfactory results.
Contents
Summary v
Contents ... vii
Acknowledgments xii
Chapter 1 :Introduction 1
1.1 Motivation ... 3
1.2 Renewable Energies ... 4
1.2.1Photovoltaic Energy ... 5
1.2.2Thermal Energy ... 12
1.2.3Wind Energy ... 13
1.2.4 Wave Energy ... 14
1.2.5 Hydraulic Energy ... 14
1.2.6 Biomass Energy ... 15
1.3 Objectives of the Thesis ... 15
1.4 Contributions of the Thesis ... 16
1.5 Organization of the Thesis ... 16
1.6 Conclusion ... 18
1.7 References ... 19
Chapter 2: Sizing of the Photovoltaic Irrigation Components 25
2.1 Introduction ... 28
2.2.1 Renewable Energies for Irrigation ... 28
2.2.2 Irrigation Methods for Tomatoes ... 30
2.3 Target System ... 30
2.4 A Review on Sizing Algorithms ... 32
2.5 System Modelling and Validation ... 34
2.5.1 System Models ... 34
2.5.2 Experimental Validation ... 50
2.6System Components Sizing... 61
2.6.1 Algorithm Proposal ... 61
2.6.2 Application to a Case Study ... 69
2.6.3 Economic Study of the Optimized Installation Size ... 89
2.7 Conclusion ... 92
2.8 References ... 93
Chapter 3: Energy Management of the Photovoltaic Irrigation Installation 102 3.1 Motivation ... 105
3.2 Review of Renewable Energy Management in Irrigation ... 106
3.2.1 Review of Energy Management Methods ... 106
3.2.2 Fuzzy Logic for Energy Management ... 107
3.3 Problem Formulation ... 108
3.4 Proposed Energy Management Algorithm ... 109
3.4.1 Energy Management Strategy ... 109
3.4.2 Relays Switching Modes ... 112
3.4.3 Fuzzy Energy Management Algorithm ... 113
3.5 Application to a Case Study ... 121
3.5.1 Algorithm Parameterization ... 121
3.6 Experimental Validation... 130
3.6.1 Installation Description ... 131
3.6.2 Cases Study Validation ... 132
3.7 Conclusion ... 136
3.8 References ... 137
Chapter 4: Conclusions and Future Works 143
4.1 Conclusions ... 145
4.2 Publications Arising from the Thesis ... 146
4.3 Future Work ... 147
Appendix A: Extended Abstract in Spanish 150
A.1 Índice de Contenido ... 151
A.2 Resumen ... 156
A.3 Objetivos de la Tesis ... 157
A.4 Contribuciones de la Tesis ... 158
A.5 Organización de la Tesis ... 158
A.6 Conclusiones ... 160
A.7 Publicaciones Resultantes de la Tesis... 161
A.8 Trabajos Futuros ... 162
Appendix B: Tomatoes Irrigation 164
B.1 Climatic Study ... 165
B.2 Soil Data ... 166
B.3 Crop Data ... 166
B.4 Irrigation Intervals ... 166
Appendix C: Panels and Batteries Characteristics 170
C.1 Panels Characteristics ... 171
C.1.1 TE500CR ... 171
C.1.2 Sunel Panel ... 173
C.2 Batteries Characteristics ... 178
C.3 Installation Performance ... 180
Appendix D: The Induction Machine: Modeling and Control 182
D.1 Space Vector Notion ... 183
D.2 Refrence Change ... 183
D.3 Equations of the IM using the Space Vector ... 184
D.4 State Equations ... 185
D.5 IM Direct Starting ... 186
D.6 IM Control using the RFOC Method ... 187
D.7 References ... 190
Appendix E: MPPT Techniques and Chopper Modeling and Control 191
E.1 MPPT Results ... 192
E.2 DC-DC Adaptation ... 195
E.3 Function Principle ... 196
E.3.1 Continuous Operating Mode ... 197
E.3.2 Discontinuous Operating Mode ... 198
E.4 Chopper Design ... 199
E.4.1 Inductor Selection ... 200
E.4.2 Capacitor Selection ... 200
E.4.4 Switching Selection ... 201
E.5 Simulation Results ... 202
E.6 References ... 204
Appendix F: The Sensors 205
F.1 The Current Sensor ... 206
F.2 The Pressure Sensor ... 208
Appendix G: The Programmable Power Supply 210
Appendix H: The Inverter 212
Appendix I: The Acquisition Card 214
Appendix J 216
List of Figures ... 217
List of Tables ... 220
List of Symbols ... 221
List of Acronyms ... 230
Acknowledgments
Foremost, I would like to express my sincere gratitude and thanks to all the people and professors, who helped me, supported me and were with me since my primary school until my PhD candidature.
First, to my advisors Professors Fernando Tadeo and Maher Chaabene, for their continuous support during four years of my PhD study and research, for their patience, motivation, enthusiasm, and immense knowledge. Their guidance helped me in all the time of research and writing of this thesis.
Besides my advisors, I would like to thank the reviewers of the thesis, Professors Giuseppe Tina and Mohammed Faisal, for their time, feedback and nice comments. My sincere thanks also go to the member of the jury, for their willingness and feedback.
Thanks also to the professors and technician of Systems Engineering and Automatic Control department of the University of Valladolid: César, Felipe, Gloria, María Jesús, Jesús María, Smaranda, Rogelio, Teresa, Graciano, Teresa, Carlos, Santi and María.
My special thanks go also to professors and technicians of the Electric Conversion and Renewable Energy unity of the University of Sfax, Tunisia: M.B.A, Mohsen, Souhir, Khaled and Zied, for their help during my training.
My thanks to Grundfus company for providing as with the necessary equipments, the Meteorological Nationnal Institute of Tunisia and the agriculture administry of Medjez El Beb, for providing as with climatic data of Medjez El Beb.
I thank my colleagues in ISA department of the University of Valladolid: Mohammed, Luis, Daniel, Ruben, Tania, Johana, Inès, Alvaro, María, Elena, Khaled, Daniel and Diego, for the nice time we spent during these four years.
I thank my colleagues in the chemistry department of the University of Valladolid, for their support and friendship: Daniela, Victoria, Araceli, Johanna and Daniel.
My special thanks go also to my colleagues in CMERP unit (Sfax, Tunisia): Sana, Mahmoud, Souleyman, Amal and Tarek.
To all the friends I made during these years in the nicest residences “Reyes Catolicos of Valladolid, Spain” and “Caraciuollo of Catania, Italy”, for the nice memories: Mayda, Rocio, Nuria, Elena, Isabel, Rosalia, Rodrigo, Elvira, Faustino, Juan, Carlos, Roberto, Miguel, Pilar and many others.
Contents
1.1 Motivation ... 3
1.2 Renewable Energies ... 4
1.2.1Photovoltaic Energy ... 5
a. Serial Configuration ... 6
b. Parallel Configuration ... 7
c. MPPT techniques ... 8
i. The Look up Table MPPT ... 9
ii. The Neuro-Fuzzy MPPT ... 10
iii. The Incremental Conductance MPPT ... 10
iv. The P&O MPPT ... 11
1.2.2Thermal Energy ... 12
a. Solar Thermal Energy ... 12
b. Geothermal Energy ... 13
1.2.3Wind Energy ... 13
1.2.4Wave Energy ... 14
1.2.5Hydraulic Energy ... 14
1.2.6Biomass Energy ... 15
1.3 Objectives of the Thesis ... 15
1.4 Contributions of the Thesis ... 16
1.5 Organization of the Thesis ... 16
1.6 Conclusion ... 18
1.1 Motivation
The production of electric energy using fossil fuels (oil, coal, natural gas, etc.) has traditionally provided adequate costs, but produce greenhouse gases. In fact, fossil power generation is responsible for 40% of global CO emissions [1]. Nuclear 2 power, which does not produce directly carbon dioxide, generally suffers from poor acceptance because of significant risks and costly waste storage [2, 3].
In this context, renewable energies are positioned as a solution to fossil fuel depletion [4, 5]. For remote sites, where the grid is not available, renewable energies provide an excellent solution, since the energy sources are abundant (namely, solar radiation and wind). Moreover, given the adequate attributed support, renewable energies can meet much of the growing demand at lower prices than those usually forecast for conventional energy (by the middle of the 21st century, renewable sources of energy could account for three-fifths of the world’s electricity market) [6]. Moreover, the electricity can be produced near the place of consumption and without producing greenhouse gases. Hence, autonomous installations based on renewable energies are used for different applications in remote sites.
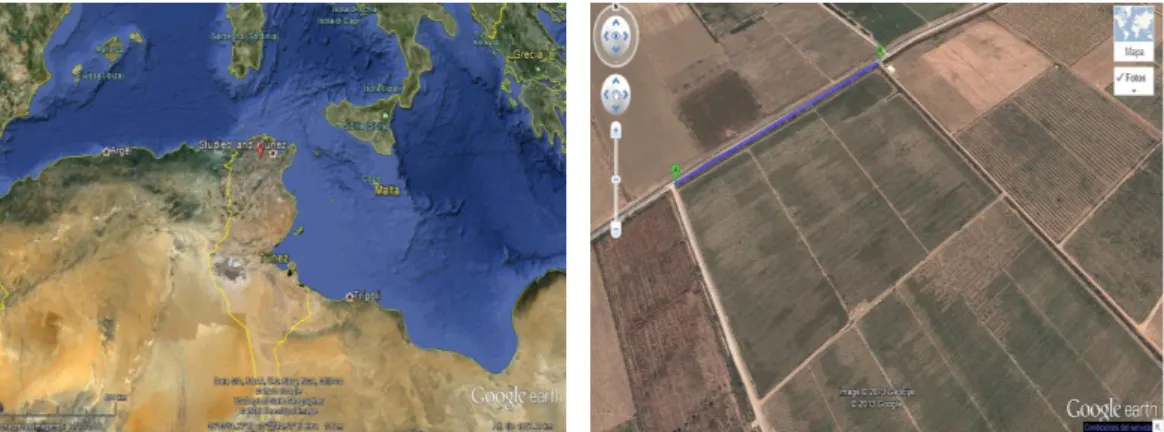
site is isolated. Given the significant solar radiation during the growing season, the solution proposed here is to use a photovoltaic installation for water pumping.
Figure 1. 1 Site of the studied land
The rest of the chapter is organized as follows: Section 1.2 gives some general ideas about the state of the art in renewable energies. Section 1.3 presents the objectives of the thesis, with a summary of the main contributions and organization presented in Sections 1.4 and 1.5. Finally, some conclusions are presented in Section 1.6.
1.2 Renewable Energies
Nowadays, most of the electric energy is obtained from fossil fuels like oil, coal and natural gas, or from nuclear energy [12]. Given the growing need for energy and the reduction in fossil sources, new energy resources are required to meet global energy needs. Renewable energies, such as photovoltaic, solar thermal, wind, hydro, waves and biomass, are the best placed to fill this gap [13]. In fact, these clean energy sources are inexhaustible. These sources are currently interesting thanks to the great technological progress, the huge investments for the development of the energy production systems, and the rapid growth in the use of renewable sources [14]. Figure 1.2 shows the distribution of the primary energy sources [12].
connected areas, they can be used as supplementary sources.
In isolated installations, where autonomy is required, the difference between the renewable energies produced and the energy needed by the loads requires the diversification of the sources or the use of storage components, such as batteries [1]. Indeed, other technologies such as fuel cells could be used to store energy [13], although, they are not yet profitable due to their complexity. Hence, the majority of off-grid installations use lead-acid batteries.
Figure 1. 2 Global primary energy [12]
Renewable energies production depends on the site and weather conditions. For instance, solar panels are effective if they are installed in well sunlit areas. Similarly, wind turbines are installed in regularly windy places [13]. The energy conversion can be classified into three main categories: electric (photovoltaic panels), thermal (solar thermal, geothermal, etc.) or mechanical (wind). Here, we give a brief description of the main energy sources currently in use (of course hybrid solutions have also been developed but they are outside the scope of this dissertation [15-17]).
1.2.1Photovoltaic Energy
Each year, the Earth’s surface receives 1.79 8
10 kWh, which is equivalent to a continuous power of 1.729 17
into account the alternations of day and night and cloudy periods, the peak power is estimated to be 1kW [14].
The solar energy is converted to electricity by the junction charge carrier (contact between two different types of semi-conductors: p-type and n-type) [18, 19]. Although the material required for making the photovoltaic modules (Silicon) is abundant and inexpensive, the complexity of the construction techniques makes these modules relatively expensive [20]. However, technological advances are being made to enhance their competitiveness, such as the use of Maximum Power Point Tracking (MPPT) techniques [21, 22] and cells yield enhancement [23], which makes them a good solution, especially for isolated areas, thanks to their simplicity in installation. These facilities increase the worldwide photovoltaic energy use. Figure 1.3 describes the evolution of the global photovoltaic cumulative installed capacity between 2000 and 2013 [24].
Figure 1. 3 Evolution of the global photovoltaic cumulative installed capacity
2000- 2013 [24]
The configuration of the components in the photovoltaic installations depends on the application. Some of them are now detailed:
a. Serial Configuration
This configuration is easy to install and can supply the load continuously. However, the excessive use of the battery bank decreases its lifetime. Moreover, it requires a large capacity to reduce its depth of discharge. Furthermore, the installation’s efficiency is reduced, since all the energy flows through the battery bank and the inverter.
DC DC
Battery
bank DC AC AC load
Control MPPT
Photovoltaic panels
Figure 1.4 Serial architecture for photovoltaic installations
b. Parallel Configuration
The parallel configuration allows all energy sources to supply the AC load separately [25, 26] (Figure 1.5).
In the case of an excess in photovoltaic energy generation, the bi-directional converter charges the battery bank. Hence, the load can be met by the panel, the battery bank, or both. Moreover, a reduction in the rated battery bank capacities, inverter and photovoltaic panel is feasible, while also meeting the demanded load peaks and ensuring the installation’s autonomy and the battery efficiency [26].
These objectives can only be met if the installed components are controlled by an “intelligent” energy management system. In fact, parallel systems include sophisticated controllers that include some of the following functions [13]:
Control of the energy flow based on the load energy demand.
Battery low voltage disconnection, to prevent excessive discharging.
Controlled “boost-charging” of flooded electrolyte lead-acid batteries at regular intervals (2-6 weeks) to reduce the negative effects of electrolyte stratification.
Battery management based on voltage measurements to estimate the batteries state of charge.
Controlled bi-directional energy flow through the inverter to allow the load to be supplied, and to charge the battery bank from renewable resources, when excess energy is available from the photovoltaic panel, which is operated at its maximum efficiency.
Photovoltaic panels
Battery bank
DC load
DC DC MPPT
DC DC Battery charger
AC load DC
AC
Control
DC bus AC bus
Figure 1. 5 Parallel architecture for photovoltaic installations
In both configurations, the use of MPPT is relevant to enable the panels to generate the maximum photovoltaic power. This is now detailed.
c. MPPT techniques
As is well known, the output power Ppv of the PV system Ta is nonlinear
Researchers have developed many methods for MPPT, such as the Look up Table [28], the Neuro-Fuzzy [29], the Incremental Conductance [29] and the Perturbation and Observation (P&O) [30] methods. They differ in complexity and tracking accuracy, but they all require the sensing of the photovoltaic current Ipv and voltage Vpv using off-the-shelf hardware. These techniques allow the MPP to be tracked thanks to the use of converters such as choppers, which are controlled by varying their duty cycle α [28] (Figure 1.6). We now briefly revise some of these methods.
MPPT
algorithms
pv
I
pv
V
G
a
T
Figure 1. 6 General schematic diagram of inputs and output of MPPT algorithms
i. The Look up Table MPPT
The Look up Table MPPT method consists in dividing the possible solar radiation and ambient temperature into intervals, then attributing the minimum value of the corresponding interval for the measured climatic data [28]. Hence, each set of solar radiation and temperature intervals is assigned offline values of the photovoltaic voltage Vmpp, current Impp and power Pmpp. Then, a PI type controller adjusts the duty cycle α of the DC–DC converter to obtain these pre-determined values of current and power [28, 31].
ii. The Neuro-Fuzzy MPPT
The Neuro-fuzzy MPPT method is based on training a neuro-fuzzy tool using a solar radiation and ambient temperature database [13, 28, 32]. Then, the fuzzy rules that describe these relations are deduced. The training step is performed using an Artificial Neural Network (ANN), characterized by the ability to store experimental knowledge, which makes them well suited to tracking the maximum power point of PV panels [13, 32]. A multilayer perception network, trained by the back propagation method, is the most widely used technique to calculate the DC-DC optimal duty cycle α, considering the irradiation and the ambient temperature variation [28].
This method does not require a model for the panel and it can handle nonlinearities. However, it needs a continuous update for the database and a high performance processor.
iii. The Incremental Conductance MPPT
The Incremental conductance MPPT method uses the current ripple in the chopper output Ipv to maximize the panel power Ppv using the relation between the current and voltage continuously identified online [33, 34]. In fact, the incremental conductance for MPPT depends on the array terminal voltage Vpv, which is always adjusted according to the desired MPP voltage
mpp
V , based on the instantaneous and incremental conductance of the
photovoltaic module. Indeed, the algorithm tests the actual conductance pv
pv
I
V
and the incremental conductance pv
pv
dI
dV as follows [13, 28, 33]:
If pv pv
pv pv
dI I
dV V , then the operating point is on the left of the MPP (1)
so, is varied to increase Vpv.
If pv pv
pv pv
dI I
is varied to decrease Vpv.
If pv pv
pv pv
dI I
dV V , then the operating point is in the MPP, so (3)
the value of is maintained.
Hence, by comparing these conductance values following (1)-(3), at each sampling time, the algorithm tracks the maximum power of the photovoltaic module. This method allows the MPP to be tracked independently of the module characteristics [35]; when dIpv 0, the voltage at the MPP increases and, thus, the algorithm must increase Vpv to track Vmpp.
Although it has good efficiency, the complexity in implementation remains the main disadvantage of the Incremental Conductance MPPT method [32]. iv. The P&O MPPT
The P&O MPPT method uses the photovoltaic current and voltage measurements and compares their previous and present values. In fact, it consists in perturbing the panel voltage and comparing the photovoltaic power obtained with its previous value [36]. The increase in the photovoltaic power generates an increase of the perturbation voltage (Figure1.7) [36]. The P&O method is performed as follows [37]:
If pv 0
pv
dP
dV , then the operating point is on the left of the MPP, so (4)
is changed to increase Vpv.
If pv 0
pv
dI
dV , then the operating point is on the right of the MPP, so (5)
is changed to decrease Vpv.
If pv 0
pv
dP
dV , then the operating point is in the MPP, so (6)
The oscillations that can be generated by P&O are considered the main drawback of this method [35]. However, it is easy to install and its cost is relatively low, so it is the most popular in practice [35].
Figure 1. 7 Methodology to locate the Maximum Power Point using the Power
versus Voltage curve
1.2.2Thermal Energy
Thermal energy consists of the use of heat to produce electricity. The most popular sources are the thermal panels and concentrators (solar thermal) or the high temperature from the Earth (geothermal) [13].
a. Solar Thermal Energy
The thermal conversion in this case consists in absorbing solar energy to heat up dark surfaces placed in sunshine. Solar energy collectors working on this principle consist of sun-facing surfaces which transfer part of the energy absorbed to a fluid [38].
The possibility of generating high working temperatures (up to 4000 K) to operate conventional steam engines for electricity production in solar concentrators has been proven (Figure 1.8) [39]. Moreover, flat-plate collectors are used to generate low-temperature heat (<365 K), which is efficient for producing hot water or heating spaces [38]. However, the biggest disadvantages of the low temperature heat collectors are the inability to transport the energy for over long distances and the low efficiency if used to produce electricity [13].
mpp
P
MPPT
0
V
V0
mpp
V
0
P
0
P
pvV V
Increa sin g V D ecrea sin gV
P p
v
(W
Figure 1. 8 High temperature solar concentrator in Almeria (Spain)
b. Geothermal Energy
Geothermal energy consists in extracting the soil’s energy on the basis of the temperature increase from the surface to the center of the earth [40], where the heat is produced by the natural radioactivity of the rocks.The geothermal energy, used to produce electricity, operates in very hot or very deep wells, geothermal sources, where water is injected under pressure into the rock.
Compared to other renewable energies, geothermal energy has the advantage of not depending on atmospheric conditions. It is therefore reliable and available over time [41, 42]. However, the energy extraction requires a high investment and sophisticated equipment.
1.2.3Wind Energy
Wind energy is a renewable energy obtained from the pressure difference of natural warm and coolareas, which creates air masses in constant movement [43]. The electricity from wind is generated by a turbine that converts a portion of the kinetic energy from the wind into a mechanical energy available on a generator shaft [44].
considered the main drawbacks of wind energy. Figure 1.9 describes the wind power evolution in the world from 2005 to 2013 [45].
Europe North America Asia Latin America Africa & Middle East Pacific Region 25,000 MW
20,000 MW
15,000 MW
10,000 MW
5,000 MW
0 MW
2013
2012
2011
2010
2009 2008
2007
2006 2005
Figure 1. 9 Evolution of the installed wind power in the world [45]
1.2.4Wave Energy
Produced by wind action, wave energy is considered as an indirect form of solar energy [46]. In fact, wind generates waves. When arriving at wave energy converters, these waves cede some of their energy that is converted into electricity. Similarly to wind energy, the main drawback of wave energy is its variability on several time-scales [47]: from wave to wave, with the state of the sea, and from month to month. Hence, unfortunately, the energy recovery is still not profitable.
1.2.5Hydraulic Energy
impossibility of constructing many dams is the most important disadvantage of this type of energy.
1.2.6 Biomass Energy
Biomass is one of the earliest sources of energy, with very specific properties. Biomass material (vegetable or animal) is transferred into electricity for example by burning waste in specific boilers [49]. Biomass is divided into three categories: dry biomass (wood, agricultural waste, etc.), biogas, and biomass wet (bioethanol, biodiesel, vegetable oil, etc.).
It has been found that using biomass in boilers offers many economic, social and environmental benefits, such as financial net savings, conservation of fossil fuel resources, and the reduction of Carbon Dioxide emissions. However, it requires a great harvesting and collection of material. Moreover, the transportation and storage costs are important [50].
1.3 Objectives of the Thesis
This thesis deals with the modelling, sizing and energy management of an autonomous photovoltaic installation destined to pump water needed to irrigate a plot of land planted with tomatoes.
The first objective of the thesis is to develop a sizing algorithm that gives the optimum sizes of the system’s components, namely the surface of the photovoltaic panels and the battery bank capacity. To do so, we first develop and validate the models of the system’s elements. These models are used to validate the sizing algorithm, using meteorological data for the target area in the months corresponding to the crop vegetative cycle.
between storing energy in the battery or water in the tank, depending on the month and the crop’s state of growth.
1.4 Contributions of the Thesis
This thesis provides several contributions on the sizing and optimal operation of a proposed photovoltaic water irrigation installation, as follows:
1. An optimum sizing algorithm that gives the adequate sizes of the installation’s components to fulfill the irrigation requirements of the crops, and to optimize the use of the energy of the battery bank. The algorithm is validated using measurements of the target area. (This algorithm is presented in Chapter 2).
2. A fuzzy logic based algorithm for the optimal operation of the photovoltaic irrigation installation, balancing the energy consumption with the generation. The key idea is to manipulate the energy provided by the panels and the batteries to fulfill the water demand and safely operate the battery bank. For this, predictions of the climatic variables for the photovoltaic power generation and the irrigation requirements are used, together with current and water level measurements. The algorithm has been validated in a realistic plant in the laboratory. This algorithm is presented in Chapter 3.
1.5 Organization of the Thesis
The thesis is organized as follows:
Chapter 1: This chapter introduces the thesis content. Section 1.1 gives the
motivation. Section 1.2 details the renewable energy situation in the world. The objectives, the main contribution and organization of the thesis are then summarized.
Chapter 2:This chapter deals with the sizing of the photovoltaic water pumping
details the proposed algorithm for the optimal sizing of the installation’ components. Then, the algorithm efficiency is tested using measured climatic data of the target area.
Chapter 3:This chapter focuses on the energy management of the photovoltaic
irrigation installation. A review of renewable energy management in irrigation is presented in Section 3.2, followed by the problem formulation in Section3.3. The proposed energy management algorithm is explained in Section 3.4 with some results presented in Section 3.5 and experimental validation illustrated in Section 3.6.
Chapter 4:This chapter summarizes the conclusions (Section 4.1), the
publications derived from the thesis (Section 4.2) and the future work (Section 4.3).
Appendix A: This appendix is an extended abstract of the thesis in Spanish, and
summarizes the objectives, contributions, organization and conclusions of the thesis.
Appendix B: This appendix presents the Tomatoes irrigation.
Appendix C: This appendix presents the panels and the batteries datasheets.
Appendix D: This appendix presents the induction machine modelling and
control.
Appendix E, F, G, H and I: summarize respectively the MPPT methods and
chopper modelling and control, datasheets of the sensors, the Programmable Power Supply, the inverter and the acquisition card.
Appendix J: This appendix includes the list of figures, tables, symbols, acronyms
1.6 Conclusion
A study of the state of the art of renewable energies used for irrigation has been discussed. We have presented the situation of using renewable energies worldwide, namely photovoltaic, thermal, wind, wave, hydraulic and biomass energies, and the different photovoltaic installation architectures that can be used.
1.7 References
[1] Belakhal, Soltane. (2010). “Conception & Commande des Machines à Aimants Permanents Dédiées aux Energies Renouvelables”. Thesis presented at the University of Constantine, Algeria.
[2] Chapman, N. A; &Mc Kinley, I.G. (1987). “The geological disposal of nuclear waste’’. John Wiley and Sons Inc; New York, NY (USA); ISBN 0-471-91249-2.
[3] Lutze, W; &Ewing, R.C. (1988) “Radioactive waste forms for the future”. North Holland; Amsterdam (Netherlands); ISBN 0 444 87104 7.
[4] Henrik, Lund. (2007). “Renewable energy strategies for sustainable development”. Energy, 32, 912–919.
[5] Ibrahim, Dincer. (2000). “Renewable energy and sustainable development: a crucial review”. Renewable and Sustainable Energy Reviews, 4, 157-175. [6] Johansson, Thomas B; Kelly, Henry; Amulya, Reddy. K. N; &Williams,
Robert. H. (1992). “Renewable energy: sources for fuels and electricity”. Island press, ISBN 1-55963-139-2.
[7] Kumar, Atul; & Kandpal, Tara. C. (2007). “Renewable energy technologies for irrigation water pumping in India: a preliminary attempt towards potential estimation”. Energy, 32(5), 861-870.
[8] Purohit, Pallav. (2007). “Financial evaluation of renewable energy technologies for irrigation water pumping in India”. Energy Policy, 35(6), 3134-3144.
[9] Purohit, Pallav;& Kandpal, Tara. C. (2005). “Renewable energy technologies for irrigation water pumping in India: projected levels of dissemination, energy delivery and investment requirements using available diffusion models”. Renewable and Sustainable Energy Reviews, 9(6), 592-607.
[11]Sumaila, Ussif. Rashid; Teh, Louise; Watson, Reg; Tyedmers, Peter;& Pauly, Daniel. (2008). “Fuel price increase, subsidies, overcapacity, and resourcesustainability”. ICES Journal of Marine Science: Journal du Conseil, 65(6), 832-840.
[12]IEA-AIE. (2013). “Key World Energy Statistics 2013”, International Energy Agency, www.iea.org, Rapport 2013.
[13]Ben Ammar, Mohsen. (2011). “Contribution à l’optimisation de la gestion des systèmes multi-sources d’énergies renouvelables”. Thesis presented at the National Engineering School of Sfax, Tunisia.
[14]Chaabene, Maher. (2009). ‘‘Gestion énergétique des systèmes photovoltaïques’’. Master course at the National School for Engineers of Sfax, Tunisia.
[15]Nema, Pragya; Nema, Rajesh. Kumar; & Rangnekar, Saroj. (2009). “A current and future state of art development of hybrid energy system using wind and PV-solar: A review’’. Renewable and Sustainable Energy Reviews, 13(8), 2096-2103.
[16]Bernal-Agustín, José. Luis; & Dufo-López, Rodolfo. (2009). “Simulation and optimization of stand-alone hybrid renewable energy systems”. Renewable and Sustainable Energy Reviews, 13(8), 2111-2118.
[17]Deshmukh, Madhukar. K; & Deshmukh, Sudarshan. S. (2008). “Modeling of hybrid renewable energy systems”. Renewable and Sustainable Energy Reviews, 12(1), 235-249.
[18]Green, M. A. (1982). ‘‘Solar cells: operating principles, technology, and system applications’’. Englewood Cliffs, NJ, Prentice-Hall, Inc.
[19]Yotaka, Harima; Kazuo, Yamashita; &Hitomi, Suzuki.(1984). “Spectral sensitization in an organic P-N junction photovoltaic cell”. Applied Physics Letters, 45(10), 1144-1145.
[20]Chenni, Rachid; Messaoud Makhlouf, Mohammed; Kerbache, Taher; &Bouzid, Aissa. (2007). “A detailed modeling method for photovoltaic cells”. Energy, 32(9), 1724-1730.
[22]Aureliano Gomes de Brito, Moacyr; Galotto, Luigi; Poltronieri Sampaio, Leonardo; DAzevedo Melo, Guilherme; &Canesin, Carlos Alberto. (2013). “Evaluation of the main MPPT techniques for photovoltaic applications”. IEEE Transactions on Industrial Electronics, 60(3), 1156-1167.
[23]Price, Samuel. C; Stuart, Andrew. C; Yang, Liqiang; Zhou,Huaxing;&You, Wei. (2011). “Fluorine substituted conjugated polymer of medium band gap yields 7% efficiency in polymer− fullerene solar cells”. Journal of the American Chemical Society, 133(12), 4625-4631.
[24]EPIA. (2014), “Global market outlook for photovoltaic 2014-2018”, European Photovoltaic Insustry Association, www.epia.org.
[25]Gules, Roger; De Pellegrin Pacheco, J; Hey, Héelio. Leãaes; & Imhoff, Johninso. (2008). “A maximum power point tracking system with parallel connection for PV stand-alone applications”. IEEE Transactions on Industrial Electronics, 55(7), 2674-2683.
[26]Wang, Hong; &Zhang, Donglai. (2010). “The stand-alone PV generation system with parallel battery charger”. In the proceedingsof the IEEE Conference on Electrical and Control Engineering (ICECE), 4450-4453. [27]Faranda, Roberto; & Leva, Sonia. (2008). “Energy comparison of MPPT
techniques for PV Systems”.WSEAS transactions on power systems, 3(6), 446-455.
[28]Charfi, Sana; & Chaabene, Maher. (2014). “Acomparative study of MPPT techniques for PV systems. In the proceedings of the IEEE Conference on Renewable Energy Congress (IREC), 22-28.
[29]Veerachary, Mummadi; & Yadaiah, Narri. (2000). “ANN based peak power tracking for PV supplied DC motors”.Solar Energy, 69(4), 343-350.
[30]Femia, Nicola; Petrone, Giovanni; Spagnuolo, Giovanni; & Vitelli, Massimo. (2005). “Optimization of perturb and observe maximum power point tracking method”. IEEE Transactions on Power Electronics, 20(4), 963-973.
[32]Salas, Vicente; Olias, Emilio; Barrado, Andrés;& Lazaro, Angel. (2006). “Review of the maximum power point tracking algorithms for stand-alone photovoltaic systems”.Solar energy materials and solar cells, 90(11), 1555-1578.
[33]Oi, Akihiro. (2005). “Design and simulation of photovoltaic water pumping system”. Doctoral dissertation, California Polytechnic State University, San Luis Obispo, USA.
[34]Hussein, K. H; Muta, I; Hoshino, T;& Osakada, M. (1995). “Maximum photovoltaic power tracking: an algorithm for rapidly changing atmospheric conditions”. In the proceedings of the IEE Conference on Generation, Transmission and Distribution, 142(1), 59-64.
[35]Kurella, A;& Suresh, R. “Simulation of incremental conductance MPPT with direct control methods using cuck converter”. IJRET, 2(9), 557-566.
[36]Esram, Trishan; & Chapman, Patrick. L. (2007). ‘‘Comparison of photovoltaic array maximum power point tracking techniques’’. IEEE transactions on Energy Conversion, 22(2), 439-449.
[37]Desai, Hardik. P; & Patel, Hiren. K. (2007). ‘‘Maximum power point algorithm in PV generation: an overview’’. In the proceedings of the IEEE Conference on Power Electronics and Drive Systems (PEDS'07), 624-630. [38]Goswami, D. Yogi; Kreith, Frank;& Kreider, Jan. F. (2000). “Principles of
solar engineering”. CRC Press. ISBN 1-56032-714-6. [39]http://outilssolaires.blog.ca
[40]Barbier, Enrico. (2002). ‘‘Geothermal energy technology and current status: an overview’’. Renewable and Sustainable Energy Reviews, 6(1), 3-65. [41]Fridleifsson, Ingvar. B. (2001). ‘‘Geothermal energy for the benefit of the
people’’. Renewable and Sustainable Energy Reviews, 5(3), 299–312.
[42]Fridleifsson, Ingvar. B. (2003). ‘‘Status of geothermal energy amongst the world’s energy sources’’. Geothermics, 32(4), 379–388.
[43]Siegfried, Heier. (2014). “Grid integration of wind energy”. John Wiley & Sons.
[44]Cavallo, Alfred. (2007). “Controllable and affordable utility-scale electricity from intermittent wind resources and compressed air energy storage (CAES)”. Energy, 32(2), 120–127.
[46]Pelc, Robin;&Fujita, Rod. M. (2002). “Renewable energy from the ocean”. Marine policy, 26(6), 471–479.
[47]Clément, Alain;McCullen, Pat;Falca, Antonio;Fiorentino, Antonio; Gardner, Fred; Hammarlund, Karin; Lemonis, George; Lewis, Tony; Nielsen, Kim; Petroncini, Simona; Pontes, M.-Teresa; Schild, Phillippe; Sjo Stro, Bengt-Olov; Sorensen,Hans Christian;&Thorpe, Tom. (2002). “Wave energy in Europe: current status and perspectives’’. Renewable and Sustainable Energy Reviews, 6(5), 405–431.
[48]Chanson, Hubert. (1994). “Comparison of energy dissipation between nape and skimming flow regimes on stepped chutes”. Journal of Hydraulic Research, 32(2), 213-218.
[49]Demirbas, Ayhan. (2005). ‘‘Potential applications of renewable energy sources, biomass combustion problems in boiler power systems and combustion related environmental issues’’. Progress in Energy and Combustion Science, 31(2), 171–192.
Contents
Introduction ... 28 2.1
Irrigation using Renewable Energies ... 28 2.2
2.2.1 Renewable Energies for Irrigation ... 28 2.2.2 Irrigation Methods for Tomatoes ... 30
Target System ... 30 2.3
A Review on Sizing Algorithms ... 32 2.4
System Modelling and Validation ... 34 2.5
2.5.1 System Models ... 34 a. Photovoltaic Panels Models ... 34
i. Solar Radiation Model ... 35
Solar declination ... 35
Hour Angle of the Sun ... 35
Extraterrestrial Radiation and Clearness Index ... 36
Solar Radiation Calculation ... 37 ii. Ambient Temperature Distribution Model ... 40 iii. Photovoltaic Panels Model ... 40
Panel Yield-Based Model ... 41
Panel Non-linear Model ... 42
b. Battery Bank ... 44 c. Inverter ... 45 c. Pump ... 47
2.5.2 Experimental Validation and Modeling Results ... 50
a. Photovoltaic Panels Models ... 51 b. Battery Bank Model ... 58 c. Inverter Model ... 59 d. Pump ... 60
2.6.1 Algorithm Proposal ... 61
a. Algorithm 2.1: Determination of S and M
M
bat
n ... 63
b. Algorithm 2.2: Deduction of Sopt and
opt
bat
n ... 68
2.6.2 Application to a Case Study ... 69
a. Sizing for the Case Study ... 69
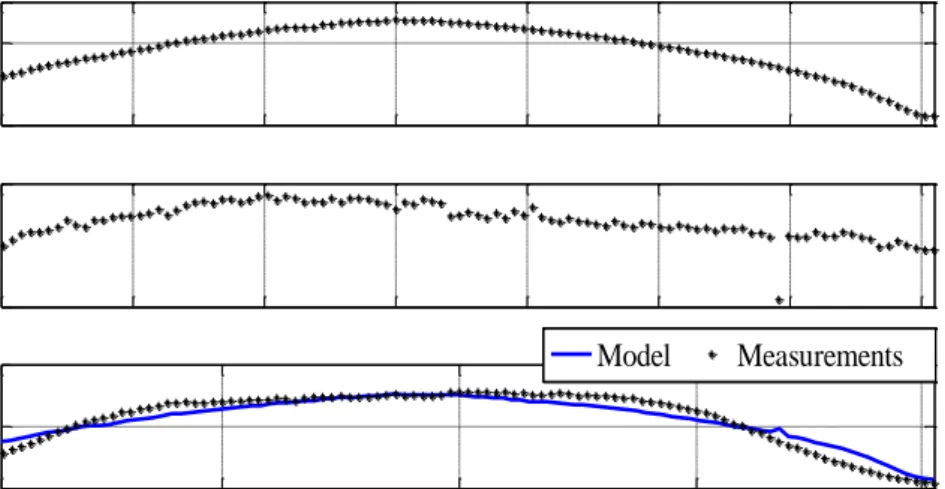
b. Validation Using Measured Climatic Data ... 79
c. Validation Using HOMER ... 84 d. Validation Using PVsyst ... 84 e. Days of Autonomy ... 88
2.6.3 Economic Study of the Optimized Installation Size ... 89
2.7 Conclusion ... 92
2.1 Introduction
Following the discussion in the previous chapter, a photovoltaic based installation is a promising solution for our irrigation problem, since the isolated site is characterized by a good solar insolation throughout the year [1- 3]. After studying the renewable energies used for irrigation (Section 2.2) and presenting the adopted installation (Section 2.3), we will describe the sizing problem (Section 2.4) and present and validate some of the system components models (Section2.5), which will be used to define the optimum components size (Section 2.6).
2.2 Irrigation using Renewable Energies
The need to save water and energy is a serious issue that has increased in importance over the last years and will become more important in the near future [4]. The low price of fuel was the reason why renewable energy sources are not widely used in several applications, including water pumping. So, pumping systems based on renewable energies are still scarce, even though they have clear advantages, namely, low generating costs, suitability for remote areas, and being environmentally friendly. Nowadays, the price of electric energy is rising constantly, investing in more efficient solutions is increasing [5].
2.2.1Renewable Energies for Irrigation
Renewable Energies have been used in water pump applications, especially in remote agricultural areas, thanks to the potential of renewable energies. The renewable energies’ use depends on the user’s propensity to invest in renewable based pumping systems, his /her awareness and knowledge of the technology for water pumping, and also on the availability, reliability, and economics of conventional options [6]. Moreover, the evaluation of the groundwater volume required for irrigation and its availability in the area are also relevant in determining the profitability of renewable energies.
Especially in small scale installations in regions characterized by good amounts of solar energy over the year [7, 8]. In fact, it is recommended that, for installing Solar Photovoltaic (SPV) pumps, the average daily solar radiation in the least sunny month should be greater than 3.5 kW/ 2
m on a horizontal surface [4]. Thanks to their efficiency and cost-efficiency rate, PPEWPS have been very popular and they have been developed to appear in these following categories [8]:
Directly coupled PPEWPS:
These systems pump water only when the photovoltaic modules capture the solar radiation.
Maximum Power Point PPEWPS:
These installations include MPP trackers to enhance the panels efficiency and thus increase the pumped water volume.
Batteries PPEWPS:
These systems include batteries to supply pumps when the panels power generation is not sufficient.
Sun trackers PPEWPS:
These installations include sun trackers to maximize the solar energy received. They are considered expensive and complicated [6].
WPEWPS have been used in windy sites and can be classified as:
DC type WPEWPS:
This category of WPEWPS produces AC energy via wind turbines, which is then rectified to DC and used to supply DC loads [9].
AC type WPEWPS:
These installations generate AC energy used directly to supply AC loads [10, 11]. Moreover, they can take the form of a DC type when they are small size WPEWPS. For instance, permanent magnet synchronous generators (PMSG) with embedded rectifiers are used in small size and fixed pitch wind turbines, which have a simpler construction and are less expensive than DC type WPEWPS.
complementary way, since, generally, when the solar radiation is high, the wind velocity is low. This combination may result in a more reliable but complex water pumping, since electric power generated by wind turbines is highly erratic and may affect both the power quality and the planning of power systems [12].
Hence, as has been shown, there is a multitude of systems based on renewable energies. However, the choice of the energy source for the pump supply depends essentially on the site characteristics and the water needed by the crops. For our target application, photovoltaic system with MPPT and batteries will be selected. The irrigation methods are now detailed.
2.2.2 Irrigation Methods for Tomatoes
Generally, drip and furrow irrigation are the most used methods for tomatoes irrigation [13, 14]. Although mulching irrigation contributes to crop production by way of influencing soil productivity and weed control [15, 16], drip irrigation, characterized by its suitability for small and frequent irrigation applications [14], is selected here, since it only requires a small water volume and it allows the fruit production to be increased [13]. Small but frequent water applications enable the plant to grow well, without any effect from water-stress, thanks to the frequent water applications between consecutive irrigation periods [14].
Indeed, several researchers have focused on the yield improvement by drip irrigation of various crops (especially tomato). In fact, it has been reported that drip irrigation allows 30-50% higher tomato yields [14] and its use, either alone (or in combination with mulching methods), increases the tomato yield over the normal method of irrigation, which represents 44% savings in irrigation water [14]. Thus, the irrigation method generally affects the yield production.
2.3 Target System
Choice of the Renewable Energy:
Since the land is characterized by a good amount of solar energy during the year [18], we choose a PPEWPS installation that includes the MPPT technique and batteries.
Choice of the components:
The installation is composed of photovoltaic panels (Appendix C). Since the installation autonomy is required, a lead-acid battery bank is used, as it is efficient and economic (Appendix C). These components supply a centrifuge water pump driven by an induction machine (Apepndix D), as our application is characterized by a constant flux and a moderate head (Figure 2.1). The regulator is composed of three relays that allow the components to be connected and disconnected. For the reservoir, we just consider its volume, which is the maximum volume needed by the crops in the most critical month (July).
Choice of the architecture:
Since our objective is to optimize the system components size, and control the installation, a specific parallel configuration for these components has been chosen. The installation cabling is done by DC bus.
Choice of the MPPT technique:
Based on the study done in 1.2.1.c, the P&O method for MPPT is chosen, since it is easy to implement and gives good performance [19] (Appendix E).
Choice of the irrigation method:
Thanks to its advantages in enhancing the production yield and saving waterand money [13-14], the drip irrigation method has been chosen for irrigating tomatoes (Appendix B).
Figure 2. 1 Proposed photovoltaic irrigation system
2.4 A Review of Sizing Algorithms
As the sizes of the photovoltaic installation components affect its autonomy [20, 21], it is necessary to define some adequate values for the components parameters, such as the photovoltaic panel surface and the number of batteries [22, 23].
During the months that correspond to the vegetative cycle of the crops, the values selected must guarantee the water volume needed for the crops irrigation, the system autonomy and the battery bank safe operating [22]. In fact, knowing the water volume needed for irrigating the crops, the site characteristics, the solar radiation and the photovoltaic panel type, the algorithm that is proposed in this chapter provides the optimum values of the panel surface, the number of batteries and the reservoir volume. The idea consists in calculating the values that guarantee, on the one hand, the balance between the charged and discharged energy in the battery bank, and on the other hand, the pumping of the water volume needed. It is important to point out that the components size chosen must fulfill the irrigation requirements for all the months of the crops vegetative cycle (March to July).
approach has also been combined with artificial neuronal networks and genetic algorithms [28, 29].
However, these methods may result in an oversized system for one location and an undersized one for another location [34]. The oversized case results in high installation costs. With an undersized case, the installation is unable to supply the load with the energy needed. Moreover, the installation lifetime is shorter, due to the excessive use of batteries. For these reasons, the sizes must be carefully selected for each specific application and location [34].
In this context, several tools for photovoltaic installation sizing are available. For instance, HOMER [35], COMPASS [36], PVsyst [37], RAPSim [38] and RETscreen International [39] optimize the photovoltaic component size. Table 2. 1 summarizes the references for these tools and gives comments on their design methodologies.
Table 2. 1 Summary of sizing software [40]
Software Organism Observations
HOMER [35]
NREL: National Renewable Energy
Laboratory, USA
Components classified by the cost and life cycle
COMPASS [36]
Global Headquarters and Technology Center, Hamburg, Germany
Batteries are not included in the software library
PVsyst [37]
University of Geneva, Switzerland
Sizing efficiency is done by years
RAPSim [38]
Murdoch University Energy Research Institute, Australia
Sizing is based on the evaluation of the installation yield using
different components configurations RETscreen
International [39]
The Ministry of Natural Resources
Canada
The conception is based on statistical models to evaluate the economic and
energetic balance
sun. Moreover, HOMER is a good tool for sizing. Despite it guarantees the installation autonomy, it may give an oversized sizing, since it concentrates in the system autonomy. PVsyst is a good tool for sizing since it takes into account the Load Loss Propability. However, the evaluation of the sizing efficiency can be done by years. RAPSim focuses on modeling alternative power supply options. Using costs calculation throughout the lifespan, this tool is very adequate to predict the system performance and economic parameters of hybrid PV–Wind– Diesel–Battery systems [41]. RETscreen is an excel tool that assists the user in determining the energy production, life-cycle costs and greenhouse gas emission reductions for various types of renewable energy [41]. This tool allows the electricity produced to be determined using statistical sizing (provided by the user), models and climatic data of the target site [40].
Hence, these tools may give a good sizing for the installation autonomy, but they may result in oversized components. In this context, based on the load demand and the climatic data, an algorithm to determine the optimum size of our photovoltaic installation components is proposed in Section 2.6, using models of the panels, the battery bank and the pump, which are now presented and validated in Section 2.5.
2.5 System Modelling and Validation
In order to size and control the system elements, an essential step consists in modeling the installation components. Hence, we now present some models for the photovoltaic panels, the batteries and the pump, some of which will be experimentally validated and then used for sizing (Section 2.6) and management (Chapter 3).
2.5.1System Modelling
In this section, we describe the installation components models, except the regulator (which is detailed in Chapter 3).
a. Photovoltaic Panels Models
panel behavior, an essential step consists in studying the parameters affecting the photovoltaic power generation. These parameters are essentially the solar radiation G, the ambient temperature Ta and the panel characteristics [40], which are detailed below:
i. Solar Radiation Model
Solar radiation data provide information on how much of the sun’s energy strikes a surface at a location on the Earth during a time period. These data are needed for effective research into solar energy utilization. Solar energy consists of two parts; extraterrestrial solar energy, which is above the atmosphere and global solar energy, which is under the atmosphere [43]. The global solar energy incidence on a tilted panel is generally evaluated using the Liu and Jordan relations [43, 44]. In this model, the solar radiation depends essentially on the position of the sun, which is determined by using the declination and the hour angle of the sun [40]:
Solar declination
The sun’s declination , needed to determine its position, is the angle between the sun’s direction at the solar noon and its projection on the equatorial plane (Figure 2.2). In fact, it reaches its maximum (23.45º) at the summer solstice (21 June), and its minimum (-23.45º) at the winter solstice (December 21). It is described by Cooper’s equation [40, 45- 46]:
284
23 45 2
365
d
. sin
(7)
wheredis the day number in the year.
Hour Angle of the Sun
The hour angle of the sun w is the sun’s East to West angular displacement around the polar axis. The value of the hour angle is zero at noon, negative in the morning and positive in the afternoon and it is increased by 15 º per hour.
- s
cos w tg tg (8)
where:
is the declination (°) calculated from (1) and is the site’s latitude (°).
W S N E θ ß z Normal to tilted surface Zenith Normal to horizontal γ
Figure 2. 2 Solar radiation angles
Extraterrestrial Radiation and Clearness Index
The extraterrestrial solar radiation H0 is the solar radiation outside the Earth’s atmosphere. The extraterrestrial radiation (J/ 2
m ) on a horizontal surface for the day d is obtained using the following equation [48]:
0
24 3600
1 0 033 2
365
sc s
d
H d G . cos coscos w sin sin
(9)
where Gsc is the solar constant (Table 2.2).
The solar radiation is attenuated by the atmospheric layer and clouds before it reaches the Earth’s soil. The clearness index Kt is the ratio between the ground and the extraterrestrial radiations. The monthly average of this index is defined by [48, 49]:
0
t
H K
H (10)
where:
H: the monthly average of the solar radiation on a horizontal plane, 0
Solar Radiation Calculation
The total solar radiation on a tilted photovoltaic panel is calculated as follows:
1)Calculation of the diffused, the global and the direct solar radiation in a horizontal panel following (5-13).
2)Calculation of the global solar radiation corresponding to a tilted panel following (14).
3)Sum of the hourly values of the solar radiation folowwing (17). These two steps are now presented in detail:
1) Calculation of the diffused and global solar radiation
In the literature, several models have been used to determine the diffused solar radiation Hd . For instance, [44] used models that classify the daily diffused solar radiation based on the daily clearness index intervals. Other works proposed a seasonal relation for Hd that depends on the sun hour angle at sunset at the month mean day [51, 52]. The monthly diffused solar radiation has also been developed using the monthly clearness index [53].
In our case, the diffused and global solar radiations are deduced using the monthly average global solar radiation in a horizontal panel, since a monthly radiation average is needed for the sizing of the installation components. The diffused insolation Hd is a function of the hour angle at sunset. It is described as follows [48-49, 53-54]:
If ws is less than 81.4º:
2 3
1 391 3 56 4 189 2 137
d t t t
H H . . K . K . K (11)
If ws is higher than 81.4º:
2 3
1 311 3 022 3 427 1 821
d t t t
The hourly diffused and global insolation Hd and H are respectively obtained using (7) and (8) [53]:
d d d
H t,d r t,d H (13)
t
H t,d r t,d H (14)
where rd is the ratio of the hourly to daily total diffuse solar radiation expressed by [48-49, 53]:
24
s d
s s s
cos w cos w
r t,d
sin w w cos w
(15)
where:
w: the hour angle of the sun,
s
w : the hour angle of the sun at sunset (following (2)).
t
r t ,d : the ratio of the hourly to the daily total global solar radiation,
expressed by [48-49, 53]:
24
s t
s s s
cosw cos w
r t,d a b cos w
sin w w cosw
(16)
where:
0 409 0 501
3
s
a . . sin w
(17)
0 6609 0 4767
3
s
b . . cos w
(18)
Hence, the direct solar radiation Hb
t,d is obtained using the following equation [49, 53]:
b d
H t,d H t,d H t,d (19)
2) Calculation of the hourly radiation on a tilted panel
1
1
2 2
t b b d
cos cos
H t,d R' H t,d H t,d H t,d
(20)
where:
: the albedo of the soil,
: the panel declination (°),
b
R' : the ratio of the direct radiation on the tilted panel and the direct radiation on the horizontal panel, expressed by [40, 47- 49]:
b z cos R' cos (21) where:
: the radiation incidence angle (°),
cos sin sin cos sin cos sin cos cos cos cos cos w
cos sin sin cos cos w cos sin sin sin w
(22) z
: the zenith angle of the sun (°), given by:
z
cos sin sin cos cos cos w (23)
3) Sum of the hourly values of the solar radiations
The evaluation of the solar energy Wpv is performed by summing the solar radiation received. Hence, it is assumed that during the hour, the solar radiation is constant [54]. The solar energy (Wh) is expressed by:
ss sr t pv t tW
H t dt (24)where: sr
t : the time of sunrise,
ss
ii. Ambient Temperature Distribution Model
The distribution model used to forecast the ambient temperature T t ,da
of the day d at the hour t depends on the minimum and the maximum temperatures Tmin
d ,Tmax
d . Thus, T t ,da
is expressed by [40]: - -13
2 2 24
max min max min
a
T d T d T d T d t
T t,d cos
(25)
iii. Photovoltaic Panels Model
In the literature, several models for the PV panels are used [53]. Since a photovoltaic panel is the parallel association of photovoltaic modules constituted of serially connected photovoltaic cells, modeling a photovoltaic panel consists first in modeling the photovoltaic cells and then applying the effect of the series and parallel connections [40]. In this sense, various models have been established to describe the photovoltaic current, which is a function of the photovoltaic voltage.
In fact, many works have been dedicated to the collection of a number of I– V characteristics in different environmental conditions. These data are arranged in a database, and then a relation between the solar radiation, the ambient temperature at the cell surface, and the photovoltaic current produced is deduced [55]. Despite the simplicity of this method, it remains practical only for the studied module and cannot be generalized for other modules’ types.
Hence, researchers use general models, namely non-linear models. In this context, some works concentrate on the one (or two) diode based model, which associates a current source in parallel with one (or two) diode to describe the current generated by the cell [56, 57].
on the Nominal Operating Cell Temperature (NOCT) and the clearness index [53].
For our application, we use the yield based model for the sizing algorithm, and the one-diode non-linear model for the management. In fact, since the proposed sizing algorithm uses only the power curve of the PV modules, a yield based model has been selected. On the other hand, the management algorithm is performed dynamically, so it requires a precise real-time knowledge of all the panels variables (currents, voltages, etc.); thus, a one-diode model is selected.
Panel Yield-Based Model
This simplified model, used for sizing, is based on few parameters. The panel yield model is given by:
( ) (1- ( ( ) - ))
pv t r pv T tc Ta ref
(26)
where:
r
: the panel yield at the reference temperature,
pv
: the temperature coefficient for the panel yield (C1), ( )
c
T t : the cell temperature (ºC),
a ref
T : the reference temperature (°C).
The cell temperatureT tc( ) can be calculated as follows [53]:
- T( ) ( ) ,
800
ref
c a t
NOCT
T t T t H t d (27)
where:
a
T : the ambient temperature (°C),
t
H t,d :the solar radiation on the tilted panel (W/ m2),
NOCT: the Normal Operating Cell Temperature (ºC).
ref
T : the reference ambient temperature (°C),
Finally, the photovoltaic power can be evaluated as follows [53]:
( ) ,
pv t pv
![Figure 1. 9 Evolution of the installed wind power in the world [45]](https://thumb-us.123doks.com/thumbv2/123dok_es/5785414.746332/28.892.151.740.178.476/figure-evolution-installed-wind-power-world.webp)