Dispersive Optical Bistability in Quantum Wells
With Logarithmic Gain
Tania Vivero, Jose Manuel Rivas-Moscoso, Ana Pilar Gonzalez-Marcos, and Jose Antonio Martfn-Pereda, Senior Member, IEEE
Abstract—We present an analytical model for studying optical bistability in semiconductor lasers that exhibit a logarithmic de-pendence of the optical gain on carrier concentration. Model re-sults are shown for a Fabry-Perot quantum-well laser and com-pared with the predictions of a commercial computer-aided design (CAD) software tool.
Index Terms—Optical bistability, logarithmic gain, quantum-well, optical communications, hysteresis, numerical modeling.
I. INTRODUCTION
O
PTICAL BISTABILITY (OB) and its applications to the fields of optical computing and processing have received widespread attention in the past decades [l]-[4], Nonlinearity and optical feedback lie at the very core of the bistability con-cept, which, in general terms, refers to the existence of two dif-ferent output states for the same input over a range of input values [2], Depending on the nonlinearity, two types of OB can be distinguished: absorptive and dispersive. The nonlin-earity responsible for absorptive bistability arises from the de-pendence of the absorption coefficient on input light intensity in a laser containing a saturable absorber. This type of bistability was first observed in a Fabry-Perot semiconductor laser under external optical injection in the 1960s [1] and, decades later, demonstrated experimentally in a two-section distributed feed-back (DFB) laser [5], Absorptive bistability has been proved to take place both in the output power/current characteristic [6] and in the output/input power characteristic [7], A deeper review on the subject of absorptive bistability in semiconductor laser am-plifiers can be found in [8],Dispersive bistability, on the other hand, arises from the inten-sity dependence of the refractive index, which causes the shift of the cavity frequency toward resonance with the input field. It was first predicted theoretically in semiconductor laser am-plifiers (SLA) at an operating wavelength of 840 nm [9] and 820 nm [10] in 1983. Later on, dispersive bistability was also demonstrated in a Fabry-Perot SLA at 1.3 //m [11] and in an InGaAsP Fabry-Perot Laser Amplifier at 1.5 /.im [12], [13],
In this paper, our efforts will be concentrated on the analysis of dispersive OB in transparent semiconductor lasers where
ab-Manuscript received October 27, 2009; revised January 18, 2010. Current version published April 14,2010. This work was supported by the grant program TIC2003-04309 of the Ministerio de Ciencia e Innovation, Spain.
The authors are with the Department of Photonic Technology, Universidad Politecnica de Madrid, Ciudad Universitaria s/n, 28040 Madrid, Spain (e-mail: [email protected]).
Color versions of one or more of the figures in this paper are available online at http://ieeexplore.ieee.org.
Digital Object Identifier 10.1109/JQE.2010.2044974
sorptive bistability can be neglected. A logarithmic relation be-tween the optical material gain and the carrier concentration will be employed in the laser model and the results of the analysis will be applied to a quantum-well laser device. As compared with bulk semiconductor materials, quantum wells possess su-perior characteristics, such as low threshold current [14], [15], low temperature dependence [16], long-wavelength operation [17], and nonlinear effects [18], that justify our choice. Lastly, this analysis will be contrasted with the results of a well-known commercial photonics software tool.
II. ANALYSIS
The most popular methods to study the nonlinear dynamics of a laser with external optical injection are based on Fabry-Perot and rate equation approaches. Even though both models give identical results in the limiting case of no injected signal [19], their results differ increasingly with the increase of the injected signal level [19], [20], In [21] some modifications were intro-duced in both methods to minimize these differences.
The Fabry-Perot method is based on the traveling-wave equa-tions of a semiconductor laser in a simple Fabry-Perot configu-ration and is used to predict the spatiotemporal dynamics of the electromagnetic field in the laser cavity [12], [22],
The rate equation (RE) method is based on the analysis of first-order differential equations for the carrier density inside the laser cavity [19], [23], [24], One disadvantage of this method is that it does not include the spectral characteristics of the cavity; however, it is expected to give better results for small signal applications and it is suitable to study the dynamic character-istics and modulation properties of injection-locked semicon-ductor lasers [25],
Built on both approaches, a convenient analytical method was developed in [12] and [26], On the one hand, the Fabry-Perot method facilitates the calculation of an appropriate mean optical intensity, obtained by averaging the axial intensity distributions within the Fabry-Perot cavity, to derive relations for the input and output intensities. On the other hand, the nonlinear refrac-tion is determined by the magnitude of the average internal in-tensity via its effect on the electron concentration in the active medium (RE method). This model is a simple and efficient tool for the analysis of Fabry-Perot laser amplifiers under the ap-proximation of a linear relation between the material gain and the carrier concentration [27]
9m - aiin("- - n0) (1)
Sine function
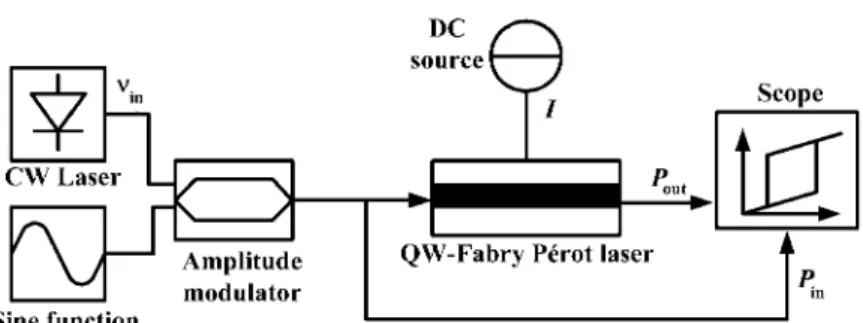
Fig. 1. Setup for the bistable operation of a quantum-well (QW) Fabry-Perot laser.
However, various authors [28], [29] have pointed out that near threshold there exists a logarithmic relation between optical gain and carrier concentration, which, in a simplified form, can be expressed as
9m = a i ogl n ( n / n0) (2) where a\og is the logarithmic gain coefficient. This approxima-tion is more accurate than the linear approximaapproxima-tion used else-where [30], both in bulk [31] and in small quantum well lasers where the carrier population of higher levels is negligible [32], and therefore will be used, instead of the linear relation in (1), in the rest of the paper.
Let us focus on power OB in quantum-well Fabry-Perot lasers for which the material-gain/carrier-concentration relation can be represented as indicated in (2). Fig. 1 shows a schematic of the setup for plotting the hysteresis loops. A constant-wave (CW) diode laser is amplitude-modulated by a sinusoidal elec-trical signal of several orders of magnitude lower frequency, and made incident upon a quantum-well Fabry-Perot laser with an active region of reduced transversal dimensions, biased below threshold by a current I = jwL, where j is the current density, and w and L are the active-region width and length, respectively. Output powers are plotted against input powers to observe the bistable behavior of the laser.
The evolution in time of the carrier concentration in the quantum well (n) and the separate confinement heterostructure (SCH) layer (nSCH)> and the change in photon density (S) within the cavity are given by the rate equations [33]
dnscH dt
n$cn n d Te dsnH ' d n
dS dt
2
ed rc
™SCH CFECH ( 1 1 1 n — + -7V. a \ 7V, T
(3)
photon lifetime, and N is the group effective refractive index of the cavity.
For the region of interest for bistable operation, the input light power is much larger than the spontaneous emission power gen-erated within the device over one mode spacing centered on the input wavelength [12] and, therefore, the spontaneous emission coefficient can be neglected. We shall also neglect the depen-dence of the spontaneous emission rate on position z, the de-pendence of the net gain per unit length g on position z and photon energy, and the dependence of the photon density on photon energy for the modes of interest [26]. With these as-sumptions in place and bearing in mind that S = PN/ (Ecwd), the position-independent mean optical power, Pa v, obtained by averaging the positive and negative traveling signal waves over a complete round trip of the cavity, and the input and output powers, Pin and PGut, respectively, are given by [12]
P =
P,. =
(1 - Px)( 1 + R2e°L)( 1 - e-°L)[Pin/(gL)} ( 1 - V 7 h I h e 9L)2 + 4 y / R J & e 9L sin2(</>) '
( 1 - + 4 V W l h e ^ s i n2( ^ ) Pc
(1 - Ri)(l - R2)e9L
(1 - R2)gLPaY (1 + R2egL)(l — e~gL)'
(6)
(J)
(8)
where R\ and R2 are the reflectivities at the front and back cavity mirrors, q is the net gain given by [26]
gL = Y f jmL - aL (9) and cj) is the relative phase change of the signal as it passes through the cavity [34]
dTV A JL 2^LTY
= On H :—1 ( n A ni) d n
Tc NAE
Vr,
pAE
/ gm(E)S(z, E)dE, (4) w h e r e ^ can be written as ,/n '0
>AE .FP
NAE . n / gm{E)S{z,E)AE (5)
= 7T
Au
(10)
(11)
where e is the electron charge, d is the active-region thickness, Tc is the carrier capture time from the SCH layer to the quantum well, re is the carrier escape time from the quantum well to the SCH layer, dscu is the thickness of one side of the SCH region, r is the electron lifetime, T is the quantum-well confinement factor, A E is the gain-curve spectral width, is the material gain, E is the photon energy, c is the velocity of light, rv is the
A is the operation wavelength, and ni is the carrier concentration in absence of optical power injection, given by ni = jr/(ed).
(a)
\ \ \
\\ \
# _ 27rLrd/V dn A dn '
d n , dnscH dscu \ Fg m I
~T~ I = Tl\ — n —
d t dt d J Ewd P,
1 , d n s c H dSC H A d</> , LdN
E v r o i o g l n — n0
In I — ) = In ( —
, « o / V no
+
n — n\ m
1 (n - ni)2 2 n?
that, in conjunction with (10), allows writing (14) as r, v d N
-In I —
(A 2lTLTP<
and, consequently, the phase change </> of the signal as it passes through the cavity is finally given by
» = ^o + 2ir LmT dN A
±
d n
Em
1 + Em
TtocvrP* vT
T a i o g P ;
2 log. 2
• + l ) + 2 1 n (17)
Using (2), (10) and (15), the net gain given by (9) can be written as
qL — TaioQ-Lln < — g I n0
A 2/KLTm
- l
• ^o) + 1 • aL (18)
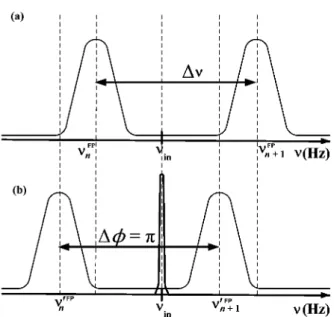
Fig. 2. (a) Fabry-Perot modes in a quantum-well laser in absence of power injection, (b) The modes shift when an optical signal is incident upon the cavity.
displacement of the Fabry-Perot modes toward lower frequen-cies, which results in a variation of the output signal phase in a quantity related to the derivative of phase ^ in (10) with respect to carrier concentration n
which, after substitution of (17) into (18), results in Em gL = rawLln ( — \
W I Em rai0gPa vr
i +
r a i o g ^ v T
\ 2
+ 1
+21n ( ! ! !
n0 + 1 — aL. (19)
(12) It is straightforward, though somewhat tedious, to verify that
(17) and (19), with the minus sign, reduce to the equations for the linear gain model
Using the average power given by (6) and multiplying the
addition of (3) and (4) by r, the rate equations reduce to gL = — aL
(13)
Ta\0g(m ~ n0)L n0( l + P a v / Ps)
raiog(ni - n0)Lb
> = (t>o + P^/Ps
2 n0 (1 + Pa v/ Ps)
(20)
(21)
which, after multiplication by (d</>) / (dn) and the use of (2), yield
«<>
where no is the transparency carrier density.Because the relative magnitudes of the round-trip time in the cavity rg and the average lifetime of the carriers r encountered in the semiconductors of interest are such that rg r, the derivative (d</>)/(dt) in (14) can be neglected [35]. Likewise, the natural logarithm ln(n/no) in (14) admits a Taylor series expansion around n « m
(15)
where Ps = n$hb>wd/(a\ogTr) and
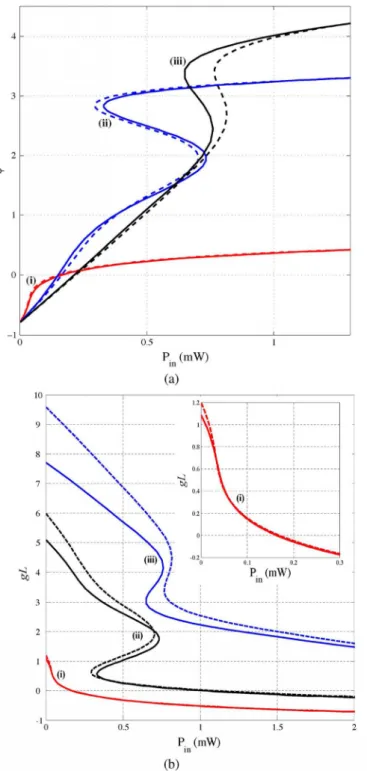
b = —47rno/(Aaiog)(diV/dn), in the limit when the carrier concentration tends to the transparency carrier density. For the sake of comparing the results obtained with the logarithmic model derived in this section and those given by the linear model in [12], Fig. 3 shows the variation of the phase change and the net gain in a Fabry-Perot laser analyzed with both gain models for increasing carrier concentrations. As was pointed out, an increasing divergence of both curves can be observed as the difference between the carrier concentration and the transparency carrier density increases. This divergence is more remarkable in the region where the curves exhibit a bistable behavior, which makes the logarithmic model described in this section more relevant for the study of OB in Fabry-Perot semiconductor lasers.
Equations (6), (7), (17) and (19) will be numerically solved to validate our logarithmic gain model with a view to the obser-vation of power OB in a Fabry-Perot quantum-well laser.
III. NUMERICAL RESULTS
-l0 0.5 1 1.5 2 l 1 1 1 P (mW) in
(b)
Fig. 3. (a) Phase change, (f>, and (b) net gain, gL, as a function of input power, Pin, for carrier concentrations in the absence of optical power, n i , (i) 1.1 x 10 24 m~3, (ii) 1.3 x 1024 m~3, and (iii) 1.45 x 1024 m~3, obtained using a log-arithmic gain model (solid line) and a linear gain model (dashed line). Data:
<fto = —0.257T, L = 400 fim, T = 1.0, a = 3000, v = 193.1 THz,
dN/dn = - 1 x 10-26 m3, aiog = 6 x 10⁴ m - \ r = (A + Bni +
Crc2)"1, n0 = 1.0 x 1024 m"3, w = 2.5 /im, d = 200 nm. In (b) an inset
shows an enlargement for = 1.1 x 1024 m- 3.
r — (A + Bni + Cnf )- 1, where A, B and C are the linear, bi-molecular and Auger recombination coefficients, respectively, whose values are shown in Table I. A difference in definition between a\og and a\[n is responsible for the difference in order of magnitude between the value reported in Table I and the usual values for ann [36]. In order for a\og to have a value in the same
order of magnitude as ann, (2) must be multiplied by no, such that ai0g will assume an no-times lower value.
The laser was biased at 75%, 80%, 88% and 92% of the threshold current, which, with the above parameters, is given by It h = 188 mA, and the corresponding initial detuning was -0.32tt, -0.52tt, -0.80tt and -0.95tt, respectively. As illus-trated in Fig. 4, hysteresis loops in an anticlockwise direction [37] in the quantum-well laser can be observed in the optical output-input characteristic.
We notice that, as the dc bias is increased, the optical input requirement is higher in order to achieve OB. The output power is also higher. Likewise, the amount of hysteresis increases with increasing bias currents. Finally, for input powers above the power at which the output signal jumps from a low level to a high level (i.e., outside the hysteresis cycle), gain at the upper state is only achieved for currents 0.75 • Ith and 0.80 • Ith- This is a consequence of the fact that, for increasing input powers,
T A B L E I
Q U A N T U M - W E L L LASER PARAMETERS
Symbol Parameter Value Units
L Device section length 400 fim w Active region width 2.5 fim d Active region thickness 40 //m A Nominal wavelength 1.5525 ^m
N Effective index in the cavity 3.7
R Left/right facet reflectivities 0.32 T QW Confinement factor 0.05 ai0g Logarithmic material gain coefficient 6 x l 04 m- 1 dN/dn QW Differential index -1x10"2 6 m3
A Linear recombination coefficient 0 s- 1 B Bimolecular recombination coefficient 2.2x10"1 6 m3s- 1 C Auger recombination coefficient 5 . 2 4 x l 0- 4 1 m6s- 1
a Internal loss 3000 m- 1
no Transparency carrier density lxlO2 4 m- 3
P.in (mW) v
(a)
0.015
Fig. 4. Output power of the Fabry-Perot quantum-well laser for several bias currents.
0.005 0.01 0.015
Input Power (W)
amplification is only obtained for bias currents near the laser threshold and for initial phase detunings |</>o| < 0.707T.
7
IV. COMPUTATIONAL MODEL
The schematic shown in Fig. 1 was also simulated with com-mercial software tool VPItransmissionMaker™ version 8.0 by VP I systems™ [38]. In VPItransmissionMaker™ lasers are ana-lyzed using the transmission-line laser model (TLLM), whereby the laser cavity is divided into small longitudinal sections, each section being divided in turn into scattering and transmission nodes, connected by so-called transmission lines, which repre-sent the waveguide propagation delay [39], [40].
Based on the said schematic, we selected a CW DFB laser (LaserCW module) with an emission frequency of 193.1 THz and an ideal linewidth of 0 Hz to feed an amplitude modu-lator (modumodu-latorAM module) whose output power follows the amplitude of a 0.975-MHz sine electrical signal (FuncSineEl module), chosen for convenience. The amplitude-modulated op-tical signal enters the bistable laser (LaserTLM module), a trans-mission-line model of a Fabry-Perot laser with a multi-quantum well structure in the active region, described by the parameters given in Table I. A PowerMeter module with no bandwidth-lim-iting filter averages the light at the input and output faces of the laser module over time intervals of 6.4 ns and transfers both values to a NumericalAnalizer2D module for two-dimensional numerical data. After several runs of the simulation, a plot of the hysteresis loop of the laser can be obtained.
To compare the results of our model presented in Section III with the computational model being described in this section, two cases have been singled out: since amplification was only achieved for bias currents of 0.75 • Ith and 0.80 • Ith, only these two situations have been retained and considered. As was pointed out in the previous section, the corresponding initial phase detuning between the external injected signal and the res-onance of the laser are —0.327T and —0.527T, respectively. Also,
because of the different power requirements of the Fabry-Perot laser for different bias currents, average powers of 3 mW and 9 mW, respectively, have been used for each of the two cases mentioned above.
As was shown in Fig. 2, the input signal incident upon the quantum-well laser affects the laser's response by inducing a change in the refractive index of the semiconductor material that leads to a change in the laser emission spectrum. This change manifests itself in a displacement of the emission modes toward lower frequencies. When, as a consequence of this mode shift, the frequency of the mode is coincident with that of the incident signal, there occurs a switch from a low power level to a high power level, or vice versa, at the output of the laser. On account of the fact that this switch takes place at a different power for in-creasing and dein-creasing input powers, a hysteresis loop appears in the optical output-input characteristic.
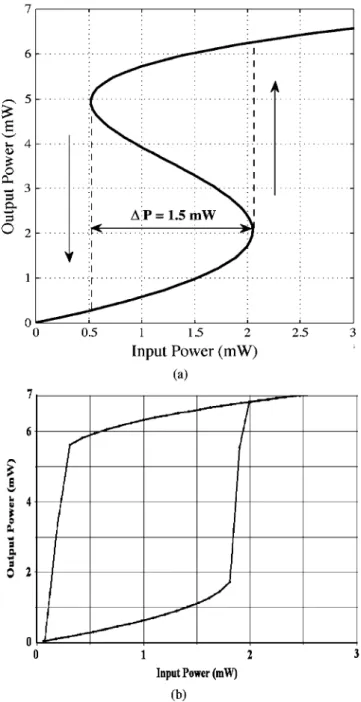
Fig. 5 shows the quantum-well laser output power represented as a function of the input power using the numerical model (a) and the computational model (b), for a bias current of 0.75 • It h-In both plots, the bistable curves jump to the ON state for input powers higher than 2 mW, and return to the OFF state when Pin descends below 0.5 mW. The output signal switches between
£
o ^
!=$ O H
o
P = 1.5 mW0.5 1 1.5 2
Input Power (mW) (a)
2.5
I A
3 a 3 0
0 1 2 Input Power (mW)
(b)
Fig. 5. (a) Numerical and (b) computational simulation for 0.75 • It
h-those two states with average powers around 5.5 mW and 1 mW. As we can see, there is good agreement between both models.
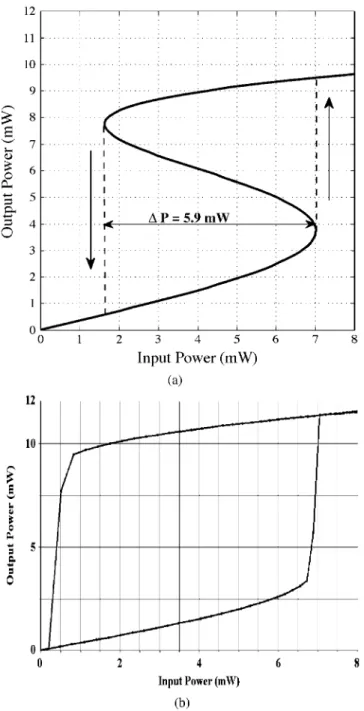
Fig. 6 shows in turn the bistable curves for a bias current of 0.80 • Ith- The curves move to the upper state at Pin = 7 mW, attaining a Pout = 10 mW, and drop back to the OFF state when Pin = 2 mW (with the model described in this paper) or 0.22 mW (with the computational simulation). The theoretical plot correctly determines the switch-on input power as compared with the simulation results, but there is a discrepancy in the pre-diction of the switch-off power, which is significantly lower with VPItransmissionMaker™. Output power results are, however, coincident with both models.
V. CONCLUSION
u
£
£
&4
o
2 3 4 5 6 Input Power (mW)
(a)
£ a
*
0
PH
3 & s 0
Input Power (mW)
(b)
Fig. 6. (a) Numerical and (b) computational simulation for 0.80 • It
h-with carrier concentration, were reviewed and a new model was proposed to account for a logarithmic material-gain/carrier-con-centration relation, which has been found to be a more accu-rate approximation in bulk and quantum-well semiconductors [31], [32]. Based on this analysis, dispersive OB in Fabry-Perot quantum-well lasers was investigated and hysteresis loops in an anticlockwise direction in the output-input power characteristic were observed. Good agreement between the results obtained from the theoretical model presented in this paper and com-mercial software tool VPItransmissionMaker™ was found, both with regard to output power levels and with regard to switch-on powers. However, an increasing divergence in the determination of the switch-off power with increasing bias currents was also observed. In spite of this, the model dealt with in this paper, owing to its simplicity and reasonable accuracy, has proved to
be a good tool to study OB in Fabry-Perot semiconductor lasers. An experimental study to assess the accuracy of the logarithmic model should be carried out in the future due to the lack, to the best of our knowledge, of published experimental results in line with this work.
REFERENCES
[1] G. Lasher, "Analysis of a proposed bistable injection laser," Solid State Electron., vol. 7, pp. 707-716, Oct. 1964.
[2] H. M. Gibbs, Optical Bistability: Controling Light With Light. New York, NY: Academic Press, 1985.
[3] A. P. Gonzalez-Marcos and J. A. Martfn-Pereda, "Photonic switching architectures with logic cells," in Proc. SPIE, Optical Transmission Systems and Equipment for WDM Networking II, Orlando, FL, 2003, pp. 569-579.
[4] A. P. Gonzalez-Marcos and J. A. Martfn-Pereda, "Optically pro-grammable logic cells," in Proc. SPIE, Photonic Devices and Algorithms for Computing III, Seattle, WA, 2001, pp. 65-73. [5] H. Kawaguchi, K. Magari, H. Yasaka, M. Fukuda, and K. Oe, "Tunable
optical-wavelength conversion using an optically triggerable multielec-trode distributed feedback laser diode," IEEE J. Quantum Electron.,
vol. 24, pp. 2153-2159, Nov. 1988.
[6] H. Kawaguchi and G. Iwane, "Bistable operation in semiconductor lasers with inhomogeneous excitation," Electron. Lett., vol. 17, pp. 167-168, Feb. 1981.
[7] H. Kawaguchi, "Bistable operation of semiconductor lasers by optical injection," Electron. Lett., vol. 17, pp. 741-742, Oct. 1981.
[8] H. Kawaguchi, "Absorptive and dispersive bistability in semiconductor injection lasers," Opt. Quantum Electron., vol. 19, pp. S1-S36, 1987. [9] K. Otsuka and H. Iwamura, "Analysis of a multistable semicon-ductor light amplifier," IEEE J. Quantum Electron., vol. QE-19, pp. 1184-1186, Jul. 1983.
[10] T. Nakai, N. Ogasawara, and R. Itoa, "Optical bistability in a semicon-ductor laser amplifier," Jpn. J. Appl. Phys., vol. 22, pp. 310-312, 1983. [11] W. F. Sharfin and M. Dagenaisa, "Room-temperature optical bistability in InGaAsP/InP amplifiers and implications for passive devices," Appl. Phys. Lett., vol. 46, pp. 819-821, May 1985.
[12] M. J. Adams, H. Westlake, M. O'Mahony, and I. Henning, "A compar-ison of active and passive optical bistability in semiconductors," IEEE J. Quantum Electron., vol. 21, pp. 1498-1504, Sep. 1985.
[13] H. J. Westlake, M. J. Adams, and M. J. OMahony, "Measurement of optical bistability in an InGaAsP laser amplifier at 1,5//m," Electron. Lett, vol. 21, pp. 992-993, Oct. 1985.
[14] W. T. Sang, "Extremely low threshold (AlGa)As graded-index wave-guide separate-confinement heterostructure lasers grown by molecular beam epitaxy," Appl. Phys. Lett., vol. 40, pp. 217-219, Feb. 1982. [15] R. D. Burnham, W. Streifer, D. R. Scifres, C. Lindstrom, T. L. Paoli,
and N. Holonyak, Jr., "Low-threshold single quantum well (60 A ) GaAlAs lasers grown by MO-CVD with Mg as p-type dopant,"
Electron. Lett., vol. 18, pp. 1095-1097, Dec. 1982.
[16] R. Chin, N. Holonyak, Jr., B. A. Vojak, K. Hess, R. D. Dupuis, and P. D. Dapkus, "Temperature dependence of threshold current for quantum-well Alx ,Gai_ x; As-GaAs heterostructure laser diodes," Appl. Phys. Lett, vol. 36, pp. 19-21, Jan. 1980.
[17] H. Temkin, K. Alavi, W. R. Wagner, T. P. Pearsall, and A. Y. Cho, "1.5-1.6 //m Gao.47Ino.53As/Alo.4gIno.52As multiquantum well lasers grown by molecular beam epitaxy," Appl. Phys. Lett., vol. 4323, pp. 845-847, May 1983.
[18] D. Chemla, D. Miller, P. Smith, A. Gossard, and W. Wiegmann, "Room temperature excitonic nonlinear absorption and refraction in GaAs/Al-GaAs multiple quantum well structures," IEEE J. Quantum Electron.,
vol. 20, pp. 265-275, Mar. 1984.
[19] M. M. Ibrahim and M. S. Ibrahim, "A comparison between rate-equa-tion and Fabry-Perot amplifier models of injecrate-equa-tion locked laser diodes,"
Opt. Laser Technol., vol. 28, pp. 39-42, Feb. 1996.
[20] R. Gordon, "Fabry-Perot semiconductor laser injection locking," IEEE J. Quantum Electron., vol. 42, pp. 353-356, Apr. 2006.
[21] D. Labukhin, C. A. Stolz, N. A. Zakhleniuk, R. Loudon, and M. J. Adams, "Modified Fabry-Perot and rate equation methods for the non-linear dynamics of an optically injected semiconductor laser," IEEE J. Quantum Electron., vol. 45, pp. 863-871, July 2009.
[23] K. E. Chlouverakis and M. J. Adams, "Stability maps of injec-tion-locked laser diodes using the largest Lyapunov exponent," Opt. Commun., vol. 216, p. 405, Feb. 2003.
[24] R. Lang, "Injection locking properties of a semiconductor-laser," IEEE J. Quantum Electron., vol. QE-18, p. 976, Jun. 1982.
[25] O. Lidoyne and P. B. Gallion, "Modulation properties of an injection-locked semiconductor laser," IEEE J. Quantum Electron., vol. 27, pp. 344-351, 1991.
[26] M. J. Adams, J. V. Collins, and I. D. Henning, "Analysis of semi-conductor laser optical amplifiers," IEEJ. Optoelectron., vol. 132, pp. 58-63, Feb. 1985.
[27] H. Kawaguchi, instabilities andNonlinearities in Laser Diodes. Nor-wood, MA: Artech House, 1994.
[28] T.-A. Ma, Z.-M. Li, T. Makino, and M. S. Wartak, "Approximate optical gain formulas for 1.55-/.tm strained quaternary quantum-well lasers," IEEE. J. Quantum Electron., vol. 31, pp. 29-34, Jan. 1995. [29] J. Z. Wilcox, G. L. Peterson, S. Ou, J. J. Yang, and M. Jansen, "Gain
and threshold-current dependence for multiple-quantum-well lasers,"
J. Appl. Phys., vol. 64, pp. 6564-6569, Dec. 1988.
[30] T. A. DeTemple and C. M. Herzinger, "On the semiconductor laser logarithmic gain-current density relation," IEEE J. Quantum Electron.,
vol. 29, pp. 1246-1252, May 1993.
[31] Y. Barbarin, E. Bente, G. Servanton, L. Mussard, Y. Oei, R. Ntzel, and M. Smit, "Gain measurements of Fabry-Perot InP/InGaAsP lasers using an ultrahigh-resolution spectrometer," Appl. Opt., vol. 45, pp. 9007-9012, 2006.
[32] P. M. Ilroy, A. Kurobe, and Y. Uematsu, "Analysis and application of theoretical gain curves to the design of multi-quantum-well lasers,"
IEEE J. Quantum Electron., vol. 21, pp. 1958-1963, Dec. 1985. [33] R. Nagarajan, M. Ishikawa, T. Fukushima, R. S. Geels, and J. E.
Bowers, "High speed quantum-well lasers and carrier transport ef-fects," IEEE J. Quantum Electron, vol. 28, no. 10, pp. 1990-2008, Oct. 1992.
[34] A. J. Lowery, "A qualitative comparison between two semiconductor laser amplifier equivalent circuit models," IEEE J. Quantum Electron.,
vol. 26, pp. 1369-1375, Aug. 1990.
[35] M. J. Adams, "Time dependent analysis of active and passive optical bistability in semiconductors," IEE J. Optoelectron., vol. 132, pp. 343-348, Dec. 1985.
[36] Y. A. Goldberg and N. M. Schmidt, Handbook Series on Semicon-ductor Parameters. Singapore: World Scientific, 1999.
[37] P. Pakdeevanich and M. J. Adams, "Measurements and modeling of re-flective bistability in 1,55-m laser diode amplifiers," IEEE J. Quantum Electron., vol. 35, pp. 1894-1903, Dec. 1999.
[38] VPI Photonics, [Online], Available: http://www.vpiphotonics.com, Available
[39] A. J. Lowery, "New dynamics semiconductor laser model based on the transmission-line modeling method," in IEE Proc. Optoelectron., Oct.
1987, vol. 134, pp. 281-289.
[40] W. J. R. Hoefer, "The transmission-line matrix method—Theory and applications," IEEE Trans. Microw. Theory Tech., vol. 33, pp. 882-893, 1985.
Tania Vivero received the B.S. degree in electronic engineering from the Uni-versidad Catolica Santa Maria La Antigua, Panama, in 2002, and the M.S. de-gree in software engineering from the Universidad Pontificia de Salamanca, Spain, in 2005. She is currently working toward the Ph.D. degree at the Uni-versidad Politecnica de Madrid, Spain.
Her research involves optical bistability, semiconductor laser amplifiers, and optical networks.
Jose Manuel Rivas-Moscoso received the B.S., M.S. and Ph.D. degrees in physics from the Universidad de Santiago de Compostela, Spain, in 1998, 1999, and 2004, respectively.
He worked as a Postdoctoral Researcher at the University of Cambridge, Cambridge, U.K., in 2005 and 2006, and has been with the Universidad Politec-nica de Madrid, Spain, since 2007.
Ana Pilar Gonzalez-Marcos received the Ph.D. degree from E.T.S. Ingenieros de Telecomunicacion, Universidad Politecnica de Madrid (UPM), Spain, in 1993.
She was previously with private companies, where she was involved in CAD-CAE topics. She was an Assistant Professor with the Universidad de Alcala de Henares, Spain, and an Associate Professor with the Universidad Alfonso X El Sabio, Spain. Since 1996, she has been a Professor with the E.T.S. Ingenieros de Telecomunicacion, UPM. Her present interests are optical computing, the applications of chaos theory to optical communications, and the modeling of mammalian retina.
Jose Antonio Marti'n-Pereda (S'63-M'70-SM'91) received the Ph.D. degree from E.T.S. Ingenieros de Telecomunicacion, Universidad Politecnica de Madrid (UPM), Spain, in 1971.
He has been a full Professor with UPM since 1975 and was a member of several technical programme conferences, mainly in optical communications (ECOC, OFC, IOOC) from 1985 until 1994. He has published more than 100 papers in journals and books and was the recipient of several academic and technical prizes. His present interest is the study of biological systems on models for artificial systems.