1
ANALYSIS OF SAFETY-BASED INCENTIVES IN PUBLIC PRIVATE
PARTNERSHIPS. THE CASE OF SPAIN
First and corresponding author: Thais Rangel
Affiliation: Ph.D, Transport Research Center (TRANSyT) Address: Polytechnic University of Madrid
C/ Profesor Aranguren s/n. 28040. Madrid, España. Phone: (34) 91 336 66 57
Fax: (34) 91 336 53 62
e-mail: [email protected]
Second author: José Manuel Vassallo
Affiliation: Associate Professor, Transport Research Center (TRANSyT) Phone: (34) 91 336 66 55
Fax: (34) 91 336 53 62
e-mail: [email protected]
ABSTRACT
2
INTRODUCTION
Public Private Partnerships (PPPs) are mostly implemented to circumvent budgetary constraints, and to encourage efficiency and quality in the provision of public infrastructure in order to reach social welfare. One of the most common ways of implementing PPPs in managing infrastructure is through the concession approach, which consists basically in transferring final design, construction, maintenance, and operation of the infrastructure to a private consortium, in exchange for which that consortium receives the right to charge a fee to the user or to the government on behalf of the user, for a period of time contractually agreed in advance (Vassallo and Gallego, 2005).
Performance-based approaches have been used as a common compensation for PPPs road projects. In the past few years, PPP contracts have included incentives to encourage bidders to reach the optimum level of service, in such a way that any increase in efficiency will be transferred to the users. These contracts have usually set up indicators linked to bonuses and penalties (Vassallo, 2007; Rangel, 2011).
The incentives given to the contractors should meet the government objectives in the project. The contractor is paid for its performance on specific management activities. These performance based standards often refer to different aspects such as availability, congestion, state of the pavement and safety issues (Rangel, 2011).
A common approach to specifying the quality of service outputs is to develop a matrix of key performance indicators which set the requirements for each service output. The use of “performance measures” or “key performance indicators” (KPIs) are widely used to manage performance in PPP contracts.
The tender process is based on the “best value”. It involves choosing a contractor who, having agreed to comply with the requirements of KPI established in the contract, submits the lowest tender in terms of price. The “best value” approach tries to ensure a high quality at a low cost (Crispino et al., 2008).
Concession contracts should include the necessary provisions in order that the relationship between the public and the private sector work at their best throughout the life of the contract. Therefore, the bidding terms and contracts should comply with two requirements: first, ensure that the most efficient bidder, in terms of price and quality, is awarded the contract; and second, provide incentives to the contractor to render the highest quality level compatible with a reasonable cost.
The aim of this paper is twofold. First, to evaluate whether PPPs lead to an improvement in road safety, when compared with other infrastructure management systems. Second, is to analyze whether the incentives to improve road safety in PPP contracts in Spain have been effective in improving safety performance. We propose a methodology to analyze the effect of safety incentives on accidents in highway PPPs. The results indicate that there are more accidents on road segments without incentives when they are compared with other segments with incentives.
3
ANALYSIS OF EXPERIENCES IN THE INTRODUCTION OF ROAD SAFETY
INCENTIVES IN EUROPE
Europe is the world region with the greatest tradition of incorporating performance-based incentives in PPPs. There are few countries with PPP roads that introduce positive incentives based on explicit road safety indicators. These countries where this was done, it became a normal practice and the latest PPP contracts continue to introduce and improve these incentives. This happens in Spain, Finland, Hungary, Norway, Portugal, Slovakia and United Kingdom. In Ireland, PPP road contracts include some road safety indicators but they do not provide bonuses. In other countries, like Denmark, the Netherlands and Belgium, there are new and sophisticated PPP contracts, but they do not have positive incentives based on explicit road safety indicators.
The design of road safety indicators is quite heterogeneous across different countries. There are differences both in the variable adopted to measure the outcome and in the final formula employed. Most of the PPPs include the number of injuries, number of fatalities or a combination of number of light accidents, serious accidents and fatal accidents to build the indicator.
On the other hand, including the exposure to the risk (expressed by traffic) is a generalized practice. In fact, only the first British shadow toll roads contracts do not introduce traffic, at the time they used absolute number of personal injury accidents as indicator. The rest of the contracts with safety incentives took into account this factor in some way. Very often, the initial accident data is divided by the annual traffic, usually measured in terms of millions or billions of vehicles-kilometers. E18 road (Muurla–Lohja) in Finland, the M6 road in Hungary, several PPPs in Portugal (the IP-4, for instance) and the latest PPP roads awarded in Spain use this methodology. The advantage of introducing the exposure to the risk (traffic) explicitly is that distortions in road safety results are reduced.
With the same aim, in many other PPP contracts the assessment of the indicator is done by comparing similar roads, in terms of traffic, number of carriageways, etc. With this methodology it is possible to control the global evolution of casualties by many factors, most of them not manageable by the road operator. Some road contracts where the indicator is set in this way are E-18 road (Grimstad – Kristiansand) in Norway, the latest PPP roads awarded in the United Kingdom (for example, A1 & M25) and some PPP roads in Spain (like the M-407 highway).
Regarding the way of rewarding or penalizing the contractor, we have identified two trends: incentives related to the extension of the deadline of the project, and incentives related to increase of the fee to be paid to the PPP contractor.
CHARACTERISTICS OF HIGHWAYS IN SPAIN
There are two main types of roads in the high capacity highway network in Spain: toll highways (PPPs) and autovías. This section presents the characteristics and the differences between these two types of roads.
Spain has extensive experience in managing and financing highways through PPPs. Most of the PPPs have been put into effect through concession contracts that have a long tradition in Spanish administrative law. The first highway concessions awarded in Spain have been toll highways (Izquierdo and Vassallo, 2004). The highway concessions could be toll highways or shadow toll highways. We have not considered shadow toll highways in the analysis because they were recently awarded in Spain.
4
separated lanes in each direction. The first autovías in Spain were built by duplicating lanes out of single carriageways. The design standards of these highways (known as first generation autovías) had design standards well below those of the toll highways.Since 2000, the quality standards in the construction of autovías improved notably to make them comparable with toll highways. These are called second generation autovías. There is no technical difference between second generation autovías and toll highways. The first generation autovías and second generation autovías were built, funded and managed by the Spanish government. None of the public highways (autovías) has economic incentives to improve road safety though the government is committed to building and maintaining the autovías with socially expected quality standards.
From 1996 to now, not only the Spanish central government, but also the regional and even the local governments have started using the concession approach to implement toll highways.
In the last few years, Spain began introducing performance-based indicators in toll highways. Toll highway concession contracts include a provision to extend the contract duration up to four years if several performance-based indicators tied to quality aspects like queuing in toll plazas, congestion, state of the pavement, safety, and satisfaction of the users are ultimately fulfilled. Other PPP’s awarded recently in Spain also include incentives in terms of annual bonuses to be incorporated to the periodic fee paid by the government to the contactor linked to performance-based indicators such as availability, state of the pavement, road safety and so on. Regarding safety, the PPP contractor can be granted an extension of the contract if safety indicators remain below an accident benchmark for similar roads. To that propose the government measures in a yearly basis the Risk Index (RI) and Mortality Index (MI) of the highways and compare it with other highways with similar characteristics in terms of alignment and traffic flow.
LITERATURE REVIEW: SAFETY MODELLING AND VARIABLES
INFLUENCING ROAD SAFETY
This paper analyzes whether the incentives to improve road safety in PPPs are effective or not. In this section we analyzed many studies to know the effect of variables that influence on accidents and the latest trends in road safety modeling.
Although the ordinary least square regression model (OLS) is applied in the road safety literature (Hakim et al., 1991; Zlatopher, 1988), some other studies have questioned its suitability (Jovanis and Chang, 1986; Miaou et al., 1992; Miaou and Lum, 1993). This method assumes that the dependent variable is continuous and normally distributed with a constant variance. This technique lacks the distributional property necessary to describe adequately random, discrete and non-negative events such as traffic accidents. Consequently the statistic results derived from these OLS models are questionable. One concern in using multiple linear regressions is that the number of traffic accidents may not have a normal distribution but instead follow a Poisson distribution.
5
The literature suggests that the Poisson regression and the NB models possess most of the desirable statistical properties in describing vehicle accident events. The Poisson and NB regression models have been widely used to analyze count data where the dependent variable is discrete and defined for non-negative integers corresponding to the number of events occurring in a given intervals (Miaou and Lum, 1993; Noland and Oh, 2004; Chang, 2005; Caliendo et al., 2007; Arenas et al., 2009).Accident rate and accident frequency are the most appropriate dependent variable for predictive models. The relationship between accident rate or accident frequency and traffic flow show a great variation in their results.
Many studies have found the relationship between accident rate and accident frequency and traffic flow. Results showed that accident rate decreases with increasing traffic flow (Martin, 2002; Hauer and Bamfo, 1997); and accident frequency increases with traffic flow (Mohamed et al., 2000; Persaud et al., 2000; Anastasopoulos and Mannering, 2009).
Few authors analyzed the effect that the presence of heavy good vehicles (HGVs) in the traffic flow has on accidents. Hiselius (2004) analyzed the relationship between accident frequency and traffic flow in four different road types according to speed limit and road width in two conditions: homogenous and heterogeneous traffic. The results show that the expected number of accidents increases less than proportionally with the traffic flow, in the homogenous case. For the heterogeneous case, the expected number of accidents decreases with increasing number of trucks.
Other studies have been carried out in recent years to establish relationships between accidents and traffic characteristics and the frequency of intersections (Ivan and O’Mara, 1997), with environmental factors (Chang, 2005; Caliendo et al., 2007; Fridstrøm et al., 1995; Shankar et al., 1995), with geometric infrastructure characteristics (Chang, 2005; Hauer et al., 2004), with number of lanes (Noland and Oh, 2004; Chang, 2005; Milton and Mannering, 1998), with speed limits (Fridstrøm et al., 1995; Ossiander and Cummings, 2002; Wong et al., 2005).
We applied NB regression models to analyze whether PPPs lead to an improvement in road safety when compared with public roads and to know the relationship between safety incentives given to the concessionaires and road safety in Spain, controlling by other variables. This paper focuses on variables related to traffic flow, characteristics of infrastructure and infrastructure management.
This paper updates the research reported by Rangel et al. (2012) which summarizes empirical evidence of the effects of safety incentives (Rangel et al, 2012). This study considers a longer period and consequently random fluctuations are greatly reduced and the recorded number of accidents will more accurately reflect the long term expected number.
The next section describes the data set used and the process of preparing it for modeling.
DATA DESCRIPTION
The models we calibrated in this paper are based on data from 2007, 2008 and 2009. In 2007, there were 13,013.6 km of high-capacity highways, in 2008 there were 13,570.3 km of high-capacity highways and in 2009 there were 14,020.8 km of high-capacity highways (Ministerio de Fomento de España, 2007a, 2008a, 2009a).
6
The sample for the models were made up of interurban road stretches of the Spanish high-capacity network both PPP highways (toll highways) and public highways (autovías), with an average length of road stretch being 9km.We selected a set of exogenous variables that may potentially influence safety and do not depend on the concessionaire’s ability to manage the road through a better designs or maintenance. These variables are related to traffic flow such as (1) Average annual daily traffic (AADT) and (2) Percentage of heavy goods vehicles (%HGV), characteristics of infrastructure such as (3) Number of lanes (LANES) and (4) Length of the road stretch (LENGTH). Besides, we selected variables that may explain any relation between PPPs and accidents, (5) Road operation (RO), which reflects the way the highway is managed (public or private) and (6) Incentives (INC), which evaluates whether the private contractors have incentives or not to improve safety if the highways are managed by them.
Data for AADT, %HGV and length of the stretches was available from the Ministry of Public Works (Ministerio de Fomento de España, 2007b, 2008b, 2009b). Traffic flow is counted as the number of vehicles through a fixed section in both directions, portable counting instrument and permanent inductive loop were used to count the number of vehicles. %HGV was calculated from HGV and AADT, and LANES was calculated using the number of lanes and the length of each stretch. LANES is the mean weighted by length.
We consider the length as the exposure variable. The longer the length of the road stretch, the more likely accidents would occur on these sections.
Data for Road operation (RO), introduced in the model as a categorical variable, was obtained from the Traffic map 2007 - 2009 (Ministry of Public Works) (Ministerio de Fomento de España, 2007b, 2008b, 2009b) and from a research done by Sánchez et al. (2006). This variable takes a different value if the highway stretch is located in a toll highway (TH) concession, a first generation autovía (1AV), or a second generation autovía (AV). TH are PPPs, while AV and 1AV are public highways.
To know which segments had road safety incentives (INC) we analyzed each concession contract in force in 2007, 2008 and 2009. The first Spanish concession contract awarded with implementation of road safety incentives was in 2002. We analyzed all of the contracts from 2002 to 2009.
Data for accidents was supplied by the Ministry of Internal Affairs (Ministerio del Interior de España, 2007-2009). For this study, the response variable is the accident frequencies.
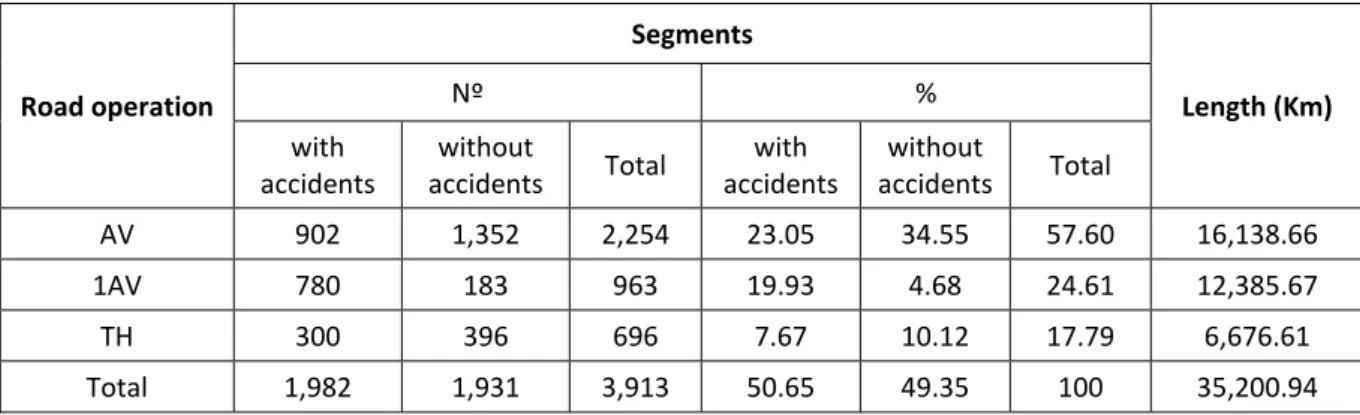
A total of 3,913 road segments were extracted out of 19,611 from the 2007, 2008 and 2009 traffic map, after selection criteria based on complete information for traffic flow and infrastructure variables. We considered stretches with and without accidents to avoid selection bias. The study includes PPPs (toll highways) and public highways (first and second generation autovías). We considered stretches of the Spanish Interurban Road State Network. The final data base represents 77.4% of the total Spanish high-capacity network. The total number of segments (with and without accidents) and the length by road operation are presented in Table 1.
The descriptive statistics of exogenous variables by road operation are presented in Table 2. They indicate that the mean traffic intensity (AADT) is higher on 1AV than AV and TH. The low traffic intensity in TH could be explained because the users have to pay tolls. There is more heavy good vehicles traffic on public highways (AV and 1AV) than PPPs (TH). The range and the standard deviation in AV and 1AV are higher than TH, which indicates more heterogeneity in traffic flow.
7
TABLE 1. Road segment data.Road operation
Segments
Length (Km)
Nº %
with
accidents
without
accidents Total
with
accidents
without
accidents Total
AV 902 1,352 2,254 23.05 34.55 57.60 16,138.66
1AV 780 183 963 19.93 4.68 24.61 12,385.67
TH 300 396 696 7.67 10.12 17.79 6,676.61
Total 1,982 1,931 3,913 50.65 49.35 100 35,200.94
The first descriptive statistics for the traffic variables AADT and %HGV and length indicated the need to use the logarithm transformation to expand low values and contract high values. The measures of central tendency take similar values through logarithm transformation. The natural logarithms of the explanatory variables (except for LANES) were used to minimize heteroskedasticity. After transformation, the range values (maximum and minimum) of AADT, %HGV and length variables were greatly reduced. The standard deviation is very low compared with the mean; therefore, the distribution was further improved. However, the chi square goodness of fit test rejects the null hypothesis that the variables follow a normal distribution.
TABLE 2. Descriptive statistics by road operation and total.
Variables Road operation Mean S.D. Range Minimum Maximum
%HGV
AV 15.67 9.16 94.59 1.02 95.61
1AV 22.75 8.24 74.41 2.12 76.53
TH 12.56 7.35 51.87 2.36 54.23
Total 16.86 9.34 94.59 1.02 95.61
AADT
AV 22,100.51 15,751.76 71,810 1,370 73,170
1AV 24,049.46 12,979.56 65,150 5,117 70,270
TH 19,906.28 14,575.19 74,730 184 74,910
Total 21,316.22 14,524.07 74,730 184 74,910
Length
AV 7.16 5.82 47.41 1.00 48.41
1AV 12.86 11.35 47.41 1.00 48.41
TH 9.59 7.03 42.15 1.11 43.26
Total 9.00 8.10 47.41 1.00 48.41
LANES
AV 3.99 0.29 5 2 7
1AV 4.06 0.27 3 3 6
TH 4.14 0.56 4 4 8
8
METHODOLOGY AND MODELING RESULTS
NB regression was applied to determine the relationship between accidents and traffic variables, number of lanes for each stretch, road operation and road safety incentives offered to the concessionaire. In this work the response variable is the accident frequencies.
The general equation in a segment j, road operation 13 being RO3j = AV the reference class,
the incentive systems to the concessionaire 10 , and years 2007, 2008 and 2009
1 3 is:
% ̂ (1)
Where: is the expected number of accidents; is the Average Annual Daily Traffic,
% is the Percentage of heavy goods vehicles; is the length of the road section; is the number of lanes for each stretch, is the road operation which could be toll highway (TH), first generation autovía (1AV) and second generation autovía (AV); reflects the introduction of road safety incentives in the stretch analyzed; represents the years analyzed in the study.
Table 3 summarizes the NB results. The significance of coefficients was checked using Wald statistic (in bracket), which rejects the null hypothesis that the coefficient is zero with a level of 95% confidence.
In order to select the best accident estimation model, Akaike Information Criterion (AIC) (Akaike, 1974) and the Bayesian Information Criterion (BIC) (Schwarz, 1978) were used. AIC and BIC identify the best approximating model among a class of competing models with different numbers of parameters.
The smaller the value of AIC and BIC, the better the model. Other measures were also evaluated such as deviance, log-likelihood and Pearson chi-square statistics.
To measure the overall goodness-of-fit statistics, the log-likelihood ratio 1 / 0 value of the model (analogous to R-square test in Linear regression models) was used. is the log-likelihood at converge and 0 is the log-likelihood at zero. It is an indication of the additional variation in accident frequency explained by the model to the constant term alone (Fridstrøm et al., 1995).
Table 3 shows that all the variables have the expected sign according to the literature review (with a positive sign indicating an increase in the accident frequency and a negative sign indicating a decrease). Besides, all variables were statistically significant with the exception of %HGV.
9
TABLE 3. Negative binomial regression model for accidents.Independent Variables Measurement
level
Expected sign Coefficients
(Wald statistics)
Constant ‐10.299
(562.309)
Log(AADT) S + 1.003
(873.110)
Log(%HGV) S +/‐ ‐0.052
(1.699)
Road operation S
TH ? ‐0.225
(14.179)
1AV ? 0.230
(20.276)
AV 0
INC C
stretch with
incentives ?
‐0.321 (4.255)
stretch without
incentives
0
YEAR C
2009 ? ‐0.252
(28.216)
2008 ? ‐0.465
(84.880)
2007 0
Log(length) S + 0.746
(894.888)
LANES S + 0.094
(3.062)
Summary statistics
AIC 16,427.776
BIC 16,490.505
Deviance (Dp) 4,222.599
Pearson Chi‐Square (X2) 4,977.103
Log‐likelihood at
converge
‐8,203.888
Log‐likelihood at zero ‐9,399.909
1 / 0 0.13
Overdispersion 1.081
10
The expected number of accidents decreases with increasing percentage of trucks. The coefficient sign of %HGV is negative. This could be related to the reduction of speed that heavy vehicles impose on light vehicles in the traffic flow. This result is in line with Hiselius (2004).RO indicates that there is a different behavior among toll highways, second generation autovías and first generation autovías. Toll highways (TH) showed the expected negative sign suggesting that there are fewer accidents in toll highways compared with AV. Besides, results indicate that there are more accidents in 1AV compared with AV. In other words, toll highways managed and operated by the private sector turn out to be safer than free highways managed and operated by the public sector. Toll highways have better road maintenance than public highways.
The INC variable showed the expected negative sign, suggesting that establishing incentives in the contracts is associated with lower accidents. There are more accidents on highway segments without incentives than on highway segments with incentives.
The results show that road safety is improving over the years; in 2007 there were more accidents than 2008 and 2009.
A larger number of LANES is associated with more accidents. The reason for this is that in highways with more lanes the interactions between drivers is greater so the probability of crashing increases. This result is in line with the findings by Noland and Oh (2004), Chang (2005) and Milton and Mannering (1998), and that the accident risk increases with the number of lanes.
CONCLUSIONS
This paper presents a model of accident frequency to know whether PPPs lead to an improvement in road safety when compared with public roads and to know whether the implementation of road safety incentives in PPPs is an effective measure to improve safety ratios in Spain.
The main conclusions from this research are that PPP highways managed and operated by the private sector are safer than free highways managed and operated by the public sector; and road safety incentives given to the concessionaires have a positive influence on accidents. There are more accidents on public highways than PPP highways and there are more accidents on PPP road segments without incentives than in PPP road segments with incentives.
In general, the inclusion of any road safety aspect eligible to be a performance-based indicator tied to rewards and penalties in PPP contracts should be considered if they are likely to reduce accidents. Even if the regulations offered limited opportunities to manage road safety, the contractor should still be allowed to find ways of including any safety measures not foreseen by the regulations.
An important direction for future research would be to analyze the size of the economic incentive set up in the PPP contract on the ultimate improvement of safety ratios.
REFERENCES
Akaike, H., 1974. A new look at the statistical model identification. IEEE Transaction on Automatic Control, 19, 716–723.
11
Arenas, B., Aparicio, F., González, C., Gómez, A., 2009. The influence of heavy good vehicle traffic on accidents on different types of Spanish interurban roads. Accident Analysis and Prevention, 41 (1), 5-24.Caliendo, C., Guida, M., Parisi, A., 2007. A crash-prediction model for multilane roads. Accident Analysis and Prevention, 39 (4), 657-670.
Chang, L.Y., 2005. Analysis of freeway accident frequencies: negative binomial regression versus artificial neural network. Safety Science, 43, 541-557.
Crispino M., Flintsch G., Pozzi M., 2008. Key success factors for global service contracts for road management and maintenance. Presented at 7th International Conference on Managing Pavement Assets. Calgary, Canada.
Fridstrøm, L., Ifver, J., Ingebrigtsen, S., Kumala, R., Krogsgard Thomsen, L., 1995. Measuring the contribution of randomness, exposure, weather, and daylight to the variation in road accident counts. Accident Analysis and Prevention, 27 (1), 1–20.
Hakim, S., Shefer, D., Hakkert, A., Hocherman, I., 1991. A critical review of macro models for road accidents. Accident Analysis and Prevention, 23 (5), 379–400.
Hauer, E., Bamfo, J., 1997. Two tools for find what function links the dependent variable to the explanatory variables. In Proceedings of the ICTCT Conference, Lund.
Hauer, E., Council, F.M., Mohammedshah, Y., 2004. Safety models for urban four lane undivided road segments. Transportation Research Record 1897, 96-105.
Hiselius, L.W., 2004. Estimating the relationship between accident frequency and homogeneous and inhomogeneous traffic flows. Accident Analysis and Prevention, 36 (6), 985–992.
Ivan, J., O’Mara, P., 1997. Prediction of traffic accident rates using Poisson regression. In 76th Annual Meeting of the Transportation Research Board. National Research Council, Washington, D.C.
Izquierdo, R., Vassallo, J.M., 2004. Nuevos sistemas de gestión y financiación de infraestructuras de transporte. Colegio de Ingenieros de Caminos, Canales y Puertos. Madrid.
Jovanis, P., Chang, H., 1986. Modeling the relationship of accident to mile travelled. Transportation Research Record 1068, 42–51.
Martin, J-L., 2002. Relationship between crash rate and hourly traffic flow on interurban motorways. Accident Analysis and Prevention, 34 (5), 619–629.
12
Miaou, S.P., Lum, H., 1993. Modeling vehicle accidents and highway geometric design relationships. Accident Analysis and Prevention, 25 (6), 689–709.Milton, J., Mannering, F., 1998. The relationship among highway geometrics, traffic-related elements and motor vehicle accident frequencies. Transportation, 25 (4), 395–413.
Ministerio de Fomento de España 2007a. Anuario Estadístico.
Ministerio de Fomento de España 2007b. Mapa de Tráfico. Dirección General de Carreteras, Madrid, España.
Ministerio de Fomento de España 2008a. Anuario Estadístico.
Ministerio de Fomento de España 2008b. Mapa de Tráfico. Dirección General de Carreteras, Madrid, España.
Ministerio de Fomento de España 2009a. Anuario Estadístico.
Ministerio de Fomento de España 2009b. Mapa de Tráfico. Dirección General de Carreteras, Madrid, España.
Ministerio del Interior de España. Base de datos de Accidentes, 2007-2009. Dirección General de Tráfico.
Mohamed, A., Abdel-Aty, M.A., Essam Radwan, E.A., 2000. Modeling traffic accident occurrence and involvement. Accident Analysis and Prevention, 32 (5), 633-642.
Noland, R.B., Oh, L., 2004. The effect of infrastructure and demographic change on traffic-related fatalities and crashes: a case study of Illinois county-level data. Accident Analysis and Prevention, 36 (4), 525-532.
Ossiander, E.M., Cummings, P., 2002. Freeway speed limits and traffic fatalities in Washington State. Accident Analysis and Prevention, 34 (1), 13-18.
Persaud, B., Retting, R. A., Lyon, C., 2000. Guidelines for identification of hazardous highway curves. Transportation Research Record 1717, 14-18.
Rangel, T., 2011. Evaluation of the effectiveness of safety-based incentives in Public Private Partnerships. Evidence from the case of Spain. PhD thesis presented at the Civil Engineering School of the Technical University of Madrid, June 2011.
Rangel, T., Vassallo, J.M. 2012. Arenas, B. Effectiveness of safety-based incentives in Public Private Partnerships: evidence from the case of Spain. Transportation Research Part A: Policy and Practice, 46 (8), 1166-1176.
13
Schwarz, G., 1978. Estimating the dimension of a model. The Annals of Statistics, 6, 461-464.Shankar, V., Mannering, F., Barfield, W., 1995. Effect of roadway geometrics and environmental factors on rural freeway accidents frequencies. Accident Analysis and Prevention, 27 (3), 371–389.
Vassallo, J.M., Gallego, J., 2005. Risk-sharing in the New Public Works Concession Law in Spain. Transportation Research Record 1932, 1-8.
Vassallo, J.M., 2007. Implementation of quality criteria in tendering and regulating infrastructure management contracts. Journal of Construction Engineering and Management, 133 (8), 553-561.
Wong, S.C., Sze, N.N., K. Lo, H., Hung, W.T., P.Y. Loo, B., 2005. Would relaxing speed limits aggravate safety? A case study of Hong Kong. Accident Analysis and Prevention, 37 (2), 377-388.