P 517 - 526 Congreso de Control de Calidad en la Construcción CONPAT-Colombia
Cover cracking of reinforced concrete due to rebar corrosión induced by chloride
penetration
J.C. Gálvez1*, S. Guzmán2, M. Fenaux2, E. Reyes2 y A. Moragues2
1 Departamento de Ingeniería Civil: Construcción, E.T.S de Ingenieros de Caminos, Canales y Puertos, Universidad Politécnica
de Madrid, e-mail: [email protected]
2 Departamento de Ingeniería Civil: Construcción, E.T.S de Ingenieros de Caminos, Canales y Puertos, Universidad Politécnica
de Madrid, e-mail: [email protected], [email protected], [email protected], [email protected]
RESUMEN
Este artículo estudia el proceso de fisuración del hormigón por corrosión de la armadura. Se presenta un modelo de transporte de cloruros en el hormigón, que contempla la no-linealidad de los coeficientes de difusión, las isotermas de absorción y el fenómeno de convección. A partir de los resultados de penetración de cloruros, se establece la corrosión de la armadura con la consiguiente expansión radial. La fisuración del hormigón se estudia con un modelo de fisura embebida. Los dos modelos (iniciación y propagación) se incorporan en un programa de elementos finitos. El modelo se contrasta con resultados experimentales, obteniéndose un buen ajuste. Una de las dificultades es establecer el umbral de concentración de cloruros que da lugar al inicio de la corrosión de la armadura.
Palabras clave: Durabilidad, Cloruros, Corrosión, Fisuración, Hormigón armado.
ABSTRACT
This paper is focused on the chloride-induced corrosion of the rebar in RC. A comprehensive model for the chloride ingress into concrete is presented, with special attention to non-linear diffusion coefficients, chloride binding isotherms and convection phenomena. Based on the results of chloride diffusion, subsequent active corrosion is assumed and the radial expansion of the corroded reinforcement reproduced. For cracking simulation, the Strong Discontinuity Approach is applied. Both models (initiation and propagation corrosion stages) are incorporated in the same finite element program and chained. Comparisons with experimental results are carried out, with reasonably good agreements being obtained, especially for cracking patterns. Major limitations refer to difficulties to establish precise levels of basic data such as the chloride ion content at concrete surface, the chloride threshold concentration that triggers active corrosion, the rate of oxide production or the rust mechanical properties.
Keywords: Durability, Chloride, Corrosion, Cracking, Reinforced concrete.
1.
INTRODUCTION
Cracking of concrete cover due to corrosion-induced expansion of steel rebar is one of the major causes of the deterioration of reinforced concrete (RC) structures exposed to marine environ-ments and de-icing salts. This work presents two models that deal with the chloride-induced corrosion in RC structures corresponding to the two distinct phases traditionally adopted in the literature (Tutti, 1982). The former (initiation stage) analyses the chloride diffusion within partially saturated concrete. A comprehensive model is developed through the governing equations of moisture, heat and chloride-ion flow. The latter (propagation stage) describes the internal cracking around the bar due to expansive pressures as corrosion of the reinforcing bar progresses, once a certain chloride concentration threshold is reached.
With reference to the initiation stage, though the former approaches considered the transport of ions only under the effect of diffusion by the mere application of 2nd Fick’s law, other phenomena such as convection or chloride binding are soon taken into account. Here a self-programmed computer code is implemented. Conventionally, chloride binding is taken into account in the diffusion process by means of an apparent diffusion coefficient (Martín-Perez et al, 2001, Chen, 2006). Instead, the present approach develops the complete set of time-dependent equations for both the chloride concentration within the pore solution and the moisture content within the pore space (Samson et al, 2005), by averaging the relevant microscopic transport equations over a representative volume element. Three macroscopic variables are used: chloride concentration, moisture and temperature. The present approach focuses attention on the interdependence between chloride and moisture flows, with variable diffusion coefficients (Martín-Perez et al, 2001, Saetta et al., 1993). Influence of temperature, hydration time, chloride binding or hygrometric condition is clearly marked.
Regarding propagation stage, corrosion provokes the reinforcement cross-section reduction and loss of bond between concrete and steel. Moreover, oxide products occupy much greater volume than the original steel consumed. Tensile stresses are generated in the surrounding concrete, resulting in cracking and, eventually, spalling and delamination. Analytical implementation of the discrete crack model, based on the thick walled-cylinder approach and FE implementation of the smeared crack approach has been widely used to simulate this stage (Liu et al, 1998, Bhargava et al, 2003, Molina et al, 1993, among others). This work presents a procedure, based on the Strong Discontinuity Approach (SDA), which reproduces the fracture process of concrete by means of an embedded cohesive crack finite element (Sancho et al., 2006, 2007). The proposed model is capable to estimate time to surface cracking quite accurately; although it is necessary to make some assumptions about the consideration of a special porous zone around the steel-concrete interface and the accommodation of corrosion products within the open cracks generated in the process.
2.
THE INITIATION STAGE
P 519 - 526 Congreso de Control de Calidad en la Construcción CONPAT-Colombia
the transference of electric charges and the state of stress of the material, two basic mechanisms govern the transport of ions into unsaturated concrete: diffusion and capillary suction (convection). In such a way, equations used to reproduce chloride transport in concrete are based on three fundamental variables: chloride concentration Cc (kg/m3), evaporable water content ωe and temperature T. With respect to the first variable, differences between the concentration of bound chlorides Cbc (kg/m3 of concrete) and the free chloride concentration Cfc (kg/m3 of pore solution) must be distinguished. The total chloride concentration Ctc (kg/m3 of concrete) then provides (Martín-Perez et al, 2001):
fc e bc
tc C C
C (1)
2.1Diffusion
Chloride diffusion in unsaturated concrete is rather complicated and differs notably from that described by Fick’s law. However, from a practical point of view, the use of Fick’s law in a generalised way is accepted in the literature, defining an effective value of diffusion coefficient
Dc or diffusivity:
d eDcCfc
J (2)
where Jd refers to diffusion flux of chloride in concrete per unit area and per unit time (kg/m2/s) and Dc (m2/s) is the effective diffusion coefficient that depends, at least, on concentration, humidity and temperature (Martín-Perez et al, 2001, Saetta et al., 1993).
2.2Capillary suction
Models describing moisture diffusion in concrete are usually based on an extension of Darcy’s law as a constitutive equation. Nevertheless, phenomena of water diffusion in concrete are highly non-linear. An apparent diffusivity Dh, that takes into account humidity, temperature and, also, equivalent hydration time, is used again. In addition, the equation is not formulated in terms of water content ωe, but relative humidity h. Water is first adsorbed on the surface of capillary pores and, then, water condensates as the relative humidity increases. Under equilibrium conditions, the pore relative humidity and evaporable water content can be related by sorption and desorption isotherms (Saetta et al., 1993). Although the described water transport is due to the capillary potential gradient and consequently not, strictly, a diffusion process,through mass conservation and assuming no chemical reaction between water and solid phase and a constant solution density, the following relationship arises:
) (D h div
t h
e
(3)
Likewise, the vaporisation ratio per unit volume in the liquid/gas interface should be considered (Samson et al, 2005), though here it has been neglected for the sake of simplicity.
2.3Heat transfer
) ( )
( cT div T
t
(4)
where ρ is the material density, c is the specific heat and λ the thermal conductivity. Adopting constant values for these three parameters, the resulting equation is linear. Non-linearity of problems related to humidity and chloride concentration comes from the dependence of diffusion coefficients on the abovementioned variables. Even considering a linear heat transfer equation, decoupled then from the previous equations corresponding to chloride concentration and moisture diffusion, it is worth noting that the different coefficients involved in the system of equations are, in general, highly dependent on temperature.
2.4Chloride ion transport
On the basis shown in the previous paragraphs, the total free chloride flux in concrete Jfc (kg/m2/s) can be obtained by the addition of the flux due to chloride concentration diffusion and the flux due to convection, i.e., ion transport driven by flux of moisture through concrete:
fc eDcCfcC Dfc hh
J (5)
Through the mass balance of solute:
( )
tc
fc C
div t
J (6)
The following expression is obtained: ¶Cbc
¶Cfc +we
æ è
ç ö
ø ÷¶C¶fc
t +Cfc
¶we ¶t =
div C
(
fcDhÑh)
+div(
weDcÑCfc)
(7)
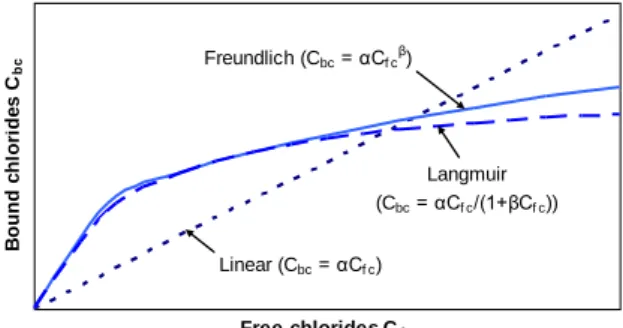
Although chloride binding is not an instantaneous process and one which involves more factors such as the pH of the solution, in practice the models from literature use binding isotherm curves (see Figure 1) in assuming an instantaneous and completely reversible equilibrium between free and bound chlorides.
Figure 1: Chloride binding isotherm curves.
2.5Finite element formulation The mentioned analysis leads to a system of three partial differential equations with three
variables: free chloride concentration Cfc, relative humidity h and temperature T. Moreover,
Free chlorides Cfc
B
o
u
n
d
c
h
lo
ri
d
e
s
C
bc
Linear (Cbc = αCf c)
Freundlich (Cbc = αCf cβ)
P 521 - 526 Congreso de Control de Calidad en la Construcción CONPAT-Colombia
values of Cbc (bound chlorides) and ωe (pore water content) must be known as a function of Cfc and h, respectively. Developing the chloride transport case, equation (7) can be expressed in matrix notation, into elemental cells Ωe, through nodal shape functions NI:
0 ) ( ) ( ) ( ) ( ) ( e c e fc e c e fc e
c C k C f
c (8)
The non-linearity of the problem arises from the dependence of capacitance matrix cc and stiffness matrix kc on the unknown variables: concentration, humidity and temperature.
For the capacitance matrix, the following arises:
( )
IJ bc
c e e I e J e
fc
C
c N N d
C
(9)With respect to the system stiffness matrix:
( ) ( )
( )
IJ
c e I e c J e
e
I h J e
e
k N D N d
N D h N d
(10)Finally, the vector of equivalent nodal forces is given by:
fc
(e)
I = N
I(Jd)n
¶We
ò
dGe (11)This vector is considered especially in those elements at borders where the diffusion flux Jd is known. In a similar way, humidity and temperature cases can be developed. Here, the element matrices and vectors needed to assemble the non-linear equations were programmed in a user subroutine in the framework of the Finite Element Analysis Program (FEAP).
2.6Model contrast
In order to verify the proposed model, an experimental study carried out by Sergi et al. (1992) is simulated. A cylindrical hardened specimen was submerged in a 1M NaCl solution for 100 days, with all surfaces isolated except the top free. The problem to be analysed is then a sudden increase in Cl- concentration in the top surface of the concrete sample, accompanied by a change in the ambient relative humidity, under the hypothesis that this sudden increase in the free surface remains constant over time. In the other boundary model edges, a null flux condition is imposed. The first approximation is based on a simple model through Fick’s second law that has an analytical solution for the one-dimensional case of a semi-infinite medium with constant diffusion coefficients:
Dt x erf C C C t xC s s i
4 )
,
( (12)
where C represents the chloride concentration, Cs is the surface concentration, Ci the initial value,
D is the diffusion coefficient (constant), t the time and x the distance to the free surface.
in order to achieve the best fit. This is the reason for the apparent diffusion coefficient of concrete varying from 10-10 to 10-12 m2/s in the literature (Wang et al, 2005). Here the described comprehensive model will be used, taking into account separately aspects such as chloride binding or relative humidity changes and employing an estimation a priori of the diffusion coefficient. According to (Martín-Perez et al, 2001), Dc is varying with temperature, humidity and equivalent hydration time:
, 1( ) 2( ) 3( )
c c ref e
D D F T F t F h (13)
Similarly, regarding humidity transport:
, 2( ) 1( ) 3( )
h h ref e
D D G T G h G t (14)
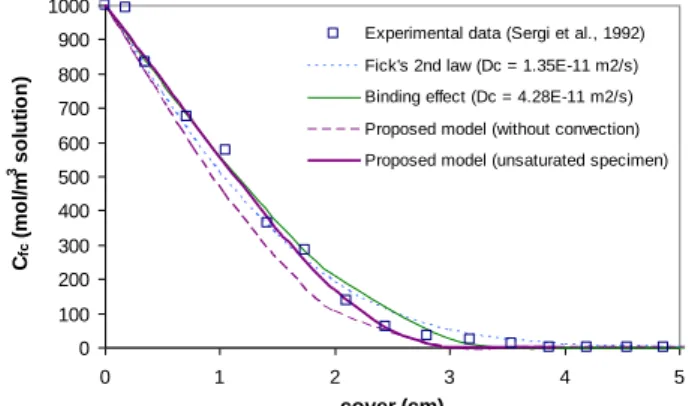
Figure 2 reproduces the free chloride concentration profile at 100 days. Firstly, experimental data are presented. Secondly, the results by the best fit to Fick’s equation, with results to an apparent diffusion coefficient of 1.35 x 10⁻¹¹ m2/s. Better results are obtained by considering the binding effect through Freundlich isotherm (αF = 0.88; βF = 0.47). In this case, the apparent diffusion coefficient is equal to 4.28 x 10⁻¹¹ m2/s but, again, the analysis a posteriori of experimental data appears indispensable. However, in the present model, an intrinsic diffusion coefficient proposed by Wang et al. (2005) that equals 1.02 x 10⁻¹⁰ m2/s divided by a tortuosity factor (τ = 1.9) squared is used, i.e. 2.825 x 10⁻¹¹ m2/s. The influence of convection is clearly shown by comparing results obtained by considering the initial humidity of 80% in the samples of the test to those considering a saturated condition from the very beginning. For humidity transport, a linear relation between water content and humidity was assumed and average parameters from literature adopted for parameters affecting Dh.
Figure 2: Free chloride profile after 100 days (please refer to tests by Sergi et al. [16]). Regarding the total chloride profile, a good fit with experimental data is obtained. No information is obtained through simple models based exclusively on the second Fick’s law.
3.
THE PROPAGATION STAGE
Once the chloride concentration threshold has been reached in the rebar surroundings, the subsequent oxide generation increases the total equivalent rebar section. The volume of the rust products is about four-to-six-times higher than that of steel. Consequently, expansive stress appears in the concrete, causing cracking of the cover. Here, a finite element with a cohesive
0 100 200 300 400 500 600 700 800 900 1000
0 1 2 3 4 5
cover (cm)
Cfc
(
m
o
l/
m
3 s
o
lu
ti
o
n
)
P 523 - 526 Congreso de Control de Calidad en la Construcción CONPAT-Colombia
embedded crack will be used (Guzmán et al., 2012). Once again, a FEAP program is employed. In fact, the same meshes as used in initiation stage models are appropriate for the propagation stage, as a first step in completing integration of the two phases.
A simple generalisation of the cohesive crack to mixed mode is used, one which assumes that the traction vector t transmitted across the crack faces is parallel to the crack displacement vector w (central forces model). To cope with the possibility of unloading (Sancho et al. 2006, 2007):
t= f w
( )
w w
(15)
where f w
( )
is the classical softening function for pure opening mode (Figure 3) and w is an equivalent crack opening defined as the historical maximum of the magnitude of the crack displacement vector. The process is as follows. Within each element, initially, w = 0 and linear elastic behaviour is assumed. If maximum principal stress exceeds the tensile strength, then a crack appears perpendicular to the corresponding direction and n is computed as a unit eigenvector of σ = E:a, where a
is the apparent strain tensor.
Figure 3: Sketch of softening curve for the cohesive crack model.
Developing the expressions from the strong discontinuity approach (Sancho et al. 2006, 2007, Guzmán et al. 2012)
(16)
This equation is solved for w using the Newton-Raphson method given the nodal displacements (and so a
) once the crack is formed and thus n and b are also known.
4.
APPLICATION EXAMPLE
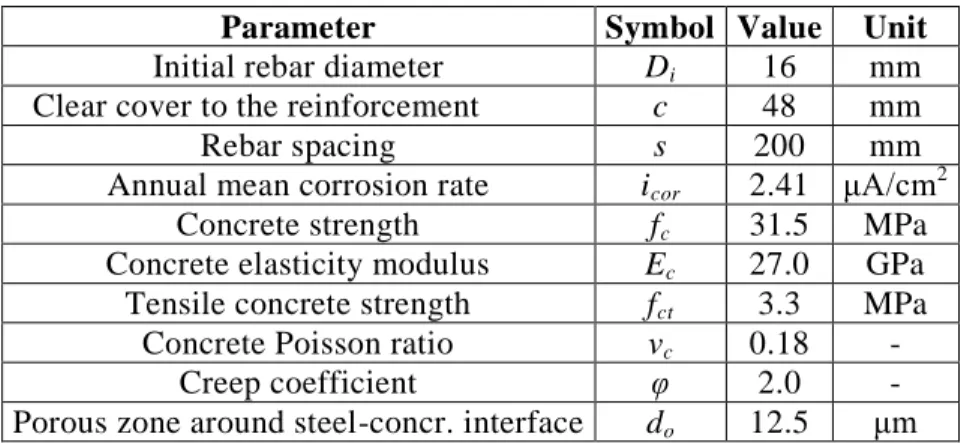
Table 1: Experimental data of slab specimen L1 (Liu et al. ,1996) Parameter Symbol Value Unit
Initial rebar diameter Di 16 mm
Clear cover to the reinforcement c 48 mm
Rebar spacing s 200 mm
Annual mean corrosion rate icor 2.41 μA/cm
2
Concrete strength fc 31.5 MPa
Concrete elasticity modulus Ec 27.0 GPa
Tensile concrete strength fct 3.3 MPa
Concrete Poisson ratio νc 0.18 -
Creep coefficient φ 2.0 -
Porous zone around steel-concr. interface do 12.5 μm
For the sake of simplicity, the mechanical properties of oxide products are adopted as the steel ones, in accordance with the assumption offered by Bhargava and Ghosh (2003). A contact element in the steel (oxide)-concrete interface is necessary to localise cracking and avoid tensile stress in the reinforcement bar. A perfect sliding contact was chosen here.Additionally, a porous zone around the bar is considered, taking into account that corrosion products accumulating around the reinforcement bar do not exert any pressure on the surrounding concrete until they fully fill voids between steel and concrete. Oxide production is modelled as an increment of area in the rebar section, as usually adopted in the literature. The initial radius of steel bar Ri is reduced to Ri*, while corrosion products would reach a radius Ri + Δ if not constrained by concrete. Uniform corrosion around the bar is then assumed. In addition, the plane strain condition is considered, as well as the exponential function for a softening curve with an estimated value of GF = 100 N/m. Loss of steel mass js is related to the amount of current icor using Faraday’s law:
(17)
where MFE is the atomic weight of iron (55.9 g/mol), n the valence of the reaction (typically, n = 2 or 3) and F the Faraday’s constant. Through knowing the ratio of molecular weight of iron to the molecular weight of the corrosion products μw, the density of rust can be evaluated through the following expression:
(18)
where μv defines the ratio of volume of expansive corrosion products to the volume of steel consumed.
If icor is assumed constant (not always applicable, especially in a highly varying aggressive environment), the rate of the loss of steel mass js and, consequently through μw parameter, the rate of rust production is constant. However, some authors (e.g., Liu et al., 1998) consider that the rate of rust production is not unchanging but inversely proportional to the amount of corrosion products, i.e., decreasing with time. These models are based on a time-invariant parameter kp used to fit experimental data, but differing by more than one order of magnitude among the
Fe cor s
M i
j
nF
s r
w v
P 525 - 526 Congreso de Control de Calidad en la Construcción CONPAT-Colombia
proposed values in the literature. In this analysis, the rate of rust production is set constant and expressed by means of the Faraday’s law, in order not to underestimate the rate of steel loss caused by corrosion. Specifically, μw = 0.613 and μv = 3.39 (Bhargava and Ghosh, 2003) were assumed. For a steel density of 7,860 kg/m3, rust density equals to 3,780 kg/m3. The time t is related to radius increment Δ through the expression:
2 2
( ) ( 2 )
4 ( 1)
s
i i
i s v
t D D
D j
(19)
Additionally, an increment in time to cracking around 90 days is due to the fill of porous zone around the rebar as previously commented. Estimation of time to cracking is slightly lower than the experimental ones (1.84 years, Liu et al. 1996). However, if amount of corrosion products that has been accommodated within the open cracks during the progress of cracking is taken into account, experimental values are tallied.
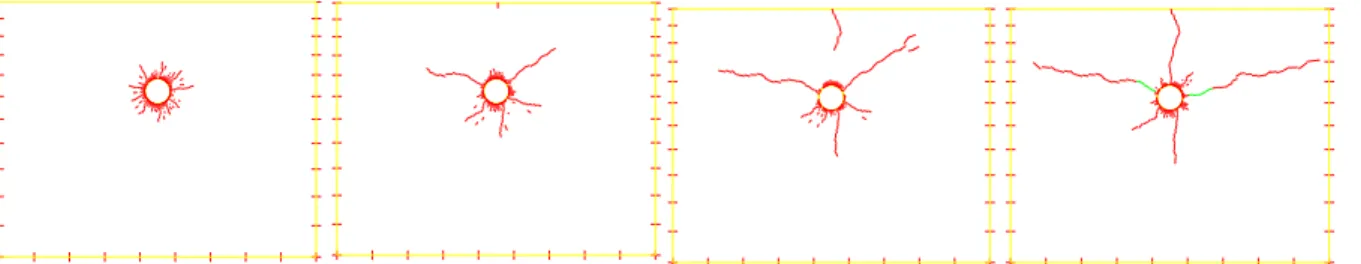
Conversely, the crack patterns obtained adequately reproduce those observed in the experiments (Figure 4). Firstly, a multiple diffuse crack scenario around the reinforcement bar is clearly shown.
Figure 4: Crack pattern in slab specimen L1 (in green, consolidated cracks with width > 0.1mm).
5.
CONCLUSIONS
This work deals jointly with the two phases widely adopted in the literature concerning cover cracking of concrete due to rebar corrosion induced by chloride penetration: the initiation stage and the propagation stage. While in others these phases have been traditionally analysed separately, in this paper the models for both phases are incorporated in the same finite element program.
process. Moreover, the rust mechanical properties need further analysis. In addition, the crack patterns obtained agree well with experiments. As an example, crack patterns obtained by the application of the model to actual bridges match expectations.
6.
ACKNOWLEDGEMENTS
The authors gratefully acknowledge the financial support for the research provided by the Spanish Ministerio de Ciencia e Innovación under grants IPT-42000-2010-31 and DPI2011-24876.
7.
REFERENCES
Andrade, C.; Alonso, C. and Molina, F.J., 1993. Cover cracking as a function of bar corrosion: part 1- Experimental test. Mater. Struct., 26: 453-464.
Bhargava K., Ghosh A.K. (2003). Analytical model of corrosion-induced cracking of concrete considering the stiffness of reinforcement. Struct. Eng. Mech., 16: 749-769.
Bhargava K., Ghosh A.K., Mori Y., Ramanujam, S. (2006). Analytical model for time to cover cracking in RC structures due to rebar corrosion. Nucl. Eng. Des., 236: 1123-1139.
Chen D. (2006). Computational framework for durability assessment of reinforced concrete structures under coupled deterioration processes. Ph.D., Vanderbilt Univ, Nashville, Tennessee. Guzmán S., Gálvez J.C., Sancho J.M. (2011). Cover cracking of reinforced concrete due to rebar corrosion induced by chloride penetration. Cem. Concrete Res., 41: 893-902.
Guzmán S., Gálvez J.C., Sancho, J.M. (2012). Modelling of corrosion-induced cover cracking in RC by an embedded cohesive crack finite element. Eng. Fract. Mech., 93: 92-107.
Liu Y., Weyers, R. (1998). Modeling the time-to-corrosion cracking in chloride contaminated reinforced concrete structures. ACI Mater. J., V. 95: No. 6: 675-681.
Martín-Pérez B., Pantazopoulou, S.J., Thomas, M.D.A. (2001). Numerical solution of mass transport equations in concrete structures. Comput. Struct., 79: 1251-1264.
Molina F.J., Alonso C., Andrade, C. (1993). Cover cracking as a function of rebar corrosion: Part 2- Numerical model. Mater. Struct., 26: 532-548.
Saetta A.V., Scotta R.V., Vitaliani, R.V. (1993). Analysis of chloride diffusion into partially saturated concrete. ACI Mater. J., V. 90, No. 5.
Samson E., Marchand J., Snyder K.A., Beaudoin, J.J., (2005). Modeling ion and fluid transport in unsaturated cement systems in isothermal conditions. Cem. Concrete Res., 35: 141-153.
Sancho J.M., Planas J., Gálvez J.C; Reyes E., Cendón, D.A. (2006). An embedded crack model for finite element analysis of mixed mode fracture of concrete. Fatigue Fract. Engng. Mater. Struct., 29, 1056-1065.
Sancho J.M., Planas J., Cendón D.A., Reyes E., Gálvez J.C. (2007). An embedded crack model for finite element analysis of concrete fracture. Eng. Fract. Mech., 74: 75-86.
Sergi G., Yu S.W., Page, C.L. (1992). Diffusion of chloride and hydroxyl ions in cementitious materials exposed to a saline environment. Concrete Res., 44: 63-69.
Tuutti K. (1982). Corrosion of steel in concrete. Stockholm: Swedish Cement and Concrete Research Institute.