Income distribution consequences of agricultural price supports in Colombia
35
0
0
Texto completo
(2) PROGlWI OF DEVELOPHENT STUOIES 121 Sewall Hall l/ILLUII MARSH RICE UNIVEF.SIT'i Houston, Texaa 77001. Paper No. 43. INCOME DISTRIBUTION CONSEQUENCES OF AGRICULTURAL PRICE SUPPORTS IN COLOMBIA By l/ayne R. Thlrsk. Pall, 1973 !he author lo Aoolstant Profesoor of Ee.onomic. at Rice University. Thl. paper reports research related to AID contract no. cod-3302, on Di.tribution of Gains, l/ealth and Income from Deve1opment. Program Discuooion Papers ara preliminary material. circulated to stimulate discusolon and critical comment. Refereneeo ln publlcations to Discussion Papero should be eleared vith th. author to protect the tentatlva character of these paper ••. •. ,.
(3) Ineame Distribution Consequenees ot ~ricultural Price Supports in Colombia l.. Introduction. Colombia ia not alone in purouing agricultural policies that ambiguou.l! embrace the concept of market competitiun.. In many countries, internal dome.tic poI-. icies typically strive to creata and preserve the relatively small scale, family farm unit of production and the competitiva market structure implied by the preservation of that unit.. On the other hand, there are few eountrtes whieh do not. 6ttl!l4pt to s,hieId their agricultural producers from the rigor. of campetition st the international level.. Most developed countries have adopted • protectiv.. acheme of either tariffs of deficiency payments as a means of inaulating dam•• tlc producer prices ar,:I {ncomes from the vagad .. and hazards of ... rld :>riee changoa. Common Market countries, for example, reIy on a common extelnal tariff to el.vate tha pricas of domestic cereals above the import price of a comparable item bought on the world market.. The United Kingdom, Canada and the United.States. hav~. all. to soma extent depended on a system of deficieney paymento and produetion controls to raioe farm incames beyond ket for farm commodities.. th~. level that would be determined by the mar-. A number of lass developed countries, including Colombia,. have introduced policies seeking to inhibit the influence of international on domestic pricea. Although sometimes disguised as an aid to price stabilization, me.sure. for supporting domestic agricultural prices have been more frequently proposed on the income distribution basi. of improving inter-sectoral equity by raising relstively low average agricultural ineames.. Making poor farmera leas poor haa been the most. consiotently voiced objective of these programs.. •. Econamic analysi. of the •• pro-. grams initially facused on their efficiency implications and eithar ignored, or.
(4) - 2 wa. le•• eoncerned with. the abl1ity of these programa to meet their di.tributional obJectlve •• l. ,. f. ¡. Without exception these studlea indieate a loss in economie ef-. fieieney will reault froc the imposition of prlee support programl.. The nature. of th. 10 •• varid' with the speeific type of program implemented but in general the lo •• ariles from the fact that at the margin the cost af an extra unit of output 11 worth aither more or less than the value to the consumero. Recently.. however. there has besn a reawakenlng of interest in the distributional iseue and new afforta have been made to determine the extent of income redistribution for wbieh price aupport programa are responsible.. A raft of recent research exam-. ining the experienee of the United Stetes provides the best example of this renewed interest.. Bonnen concluded that for a wide range of commodity programl it. requir.d from twanty to one huno red dollars of program benefit to provide one dolhr to the bottom 20 per. ~ent. of farmers.. 2. .. The distr"ssing cspacity of larm. programa to enrlch the nonpoor has been also emphaslzed by Schultze.. 3. Sehultze. que.tlonl the deairabl1ity of a program whose subsidies aeerue in the main to tho •• who.e iDcome. exceed th. nonfarm average and whieh apparent1y do 1itt1e for th. low !neame farmar whose p1ight provided the original motivation lor the progrem... Lidman take. ilsue with these. res~lts. in that they are not aehieved within. the fremework of a mode1 that incorpora te s supply adjustments as one of ita main 1. Two of th. best attempts to ascertain the output 10sse8 or effieiency cost of these programs might be mentioned. These are T. D. Wsllace. "Mes sures of Social COlt of Agricultural Programs," Journa1 of Fsrm Economics. May 1962. pp. 580-594 .nd Rachel Dardls and E. W. Learn. Measures of the Degree and Cost of Economic Protection oE Agriculture in Selectad Countries. U.S. Department of Agriculture. Eeonomic Researeh Service. Technleal Bulletln 1384. November 1967. 2. James T. Bonnen. "The Distribution of Benetits from 5e1ected U.5. Farm Progr ....... Rural Poverty in the United Ststes: A Repore ol ehe President's Nationsl Advisory Commis8lon on Rural Poverty. Washington, D.C., 1968, pp. 461-505. 3 . Charles L. Schult"e. The Dlstribution of Farm Subsidiel. A Staff Papero The Brookings Institutlon, Washington. D.C •• 1971..
(5) ¡. I. - 3 -. features.1 Instead they implieitly assome supply elastieities (and demand elaatlelties, as well) for all crops are zero.. Vsing a spatial linear programming. model of the agrieultural sector, Lidman estimates the priee and output ehangea that would follow from the abandonment of the farm programs. suggest that. eurr~nt. His ealeulationa. farm programs augment the net ineomes of farmera in different. sales elasses almost proportionately.. Despite the tendency of farm programa to in-. slgnifieantly alter the disperaion of farm incomes, Lidman seores the undesirable "trickl1ng up" of benefits to the higher ineome groups. Almost all of the previous work in the Vnited States and elsewhere haa negleeted to deal with the effeet of price supports on the uses of income. when relative priees change, people in any wors~. !bat is,. income group can become eomparatively. or better off either beeause their nominal ineome is altered or beeause their. consumption pattern is more or less skewed than the average toward eommoditiea with relaUvely higher vaIues.. In its eoncentnUon on changes in the sourees of ineome.. and failure to treat ehanges in the uses of. ineom~previous. reaeareh has been un-. able to say much abo.. t how the real ineome of different income groups is modified by price supports.. lbis paper intends to breach this analytical gsp by taking ac-. eount of the manner in which priee supports in Colombia have operated on both the earning and expenditure aides of the lncome statements of dlfferent income claares.. !bis paper is divided into four remaining sections.. !be next section di.-. cusses the history of agricultural priee supports in Colombia and furni.shes some detailo on the methods uoed to achieve the goal o of the price oupport programo !ben the model that i8 relied upon to mea8ure the income rediotribution due to price supports is described.. Its limitations and maintained hypotheseo are also. IR. ,M. Lidman, !be Distribution of Benefits Di Ma10r Agricultural ProgramB, unpublished University of Wisconsin Pn.D. thesis, January 1972..
(6) - 4mentioned.. Introduced in the same settion are the data and data sourtes that. vere meeded to anower the counterfattual queation of which income groups would benefit or lose i f domestic crop prices were brought into line with adjusted international values.. Sinee the hypothetleal experiment of ebandoning the price support. programo (though not uecessari:y its stabilitation aspects) involves an effieiency change in the slloeation of reeources, these aspeets of current price supports are analyzed in a subsequent. secti~n.. A final section drawe th. resulte of various sec-. tiona together and points out sorne indirect effects of priee supports which must be considered in reaching 6n overall ev.lu.tion of the wlsdom of 2.. pri~e. support programa.. Tbe Development of Colombian Price Supports. Protection of Colombian agriculture dates from the depression of the 1930'0 when ter!ff legialation vas introduced which sharply ralred import duties on a11 agricultural products.. 1. Subaequently, rigid import quotas vere applied to basie food-. atuffa both during snd after World War 11.. In 1944 a semi-official marketing agency,. lBA (Instituto Nacional de Abastecimiento), vas established for the purpose of setting minimum prices for rice, corn, beans and wheat.. As part of an overall import. 8ubstitution Btrategy of economie development, the avowed goal of lNA was self8ufficiency in agricultural production. ln the hand. of t:he. I. ¡ 1 I. I. War 11 with. var1.~us. govenv~ent. Support prices for other erop. were left. cOlllll1Od1ty organhationa that .... re formed after Wor1d. encouragement.. Tbus the coffee grovers federation 8upported. coffee prices, the tobacco institute maintained tobacco priees and the cotton development orgsnlzatlon became concerned witb the setting of sesame, cotton, cot-. tonaeed and other oi1 seed pricea.. ~uch of the factual material in thi. and succeeding paragraph. borrows heavily from T. Goering, "Colombian Agricultural Price and Trad. Polities," Facultad de Agronom1a, Palmira, Valle, Colombia, 1961..
(7) ----------~. 5 -. INA became tbe national instrument for importing crop goods and uled ita import position to establiab desired differentials between support pricel .nd domastic market prices.. Usually the latter prices ver. kept aboye the former. prices to prevent en averloading af INA's limited storage capacity.. In 8ffact. INA's almo.t exclusive ability to impart under a regime offoreign axcbange licensing was u.ed to validate its aystem of price .upport... !be level of support. vas based on the average co.t, includíng a normal rate af return, oE producing the crop in Colombia. obaervation in the prices has. ~ften. !bis proce.s of establishing support prices prompted an. lB rly. 1960s tbat "tbe difference between domestic snd world. been substantial, reflecting in part the strong motivation far. .aving fareign exchange thraugh import subst1tution.". 1. INA's cost of intervention in the market, 1.e., tbe costs of .torage, operating, etc., was entlrely underwcitten by the sizeable prof1ts acb1eved from import1ng commodities ae world pricel and reselling them at higher domeltic prices and from the arbitraging af domestically praduced crops over time aud space.. In. te~. of its import replacement goal, !NA was successful in reducing. dependence on foreign scurce. af 8upply for a large number af ·cropa, the ouly. not~. Iu some instances producera were able to pre •• ure !NA. able exception being wbeat.. iuto restricting imports whenever they felt price movement. tnreateDed the. prof1t~. ability of their activities. 2 Vith a limited storago eapacity tbat iu tbe early 1960s. permitted the purchaae of only about 5 per cent af the total produceiou. of 8upported crops !NA never accumulated unsold aurplusea that could only be oold abroad at a substantial lo.s. port substitution phase was. In fact cotton represents a case in wh1ch an 1m-. foll~by. an export phase that required only a small. ~ale Adama ee al, Public Law 480 and Colombia' s Economic Development, Miehigan State University, 1964, p. 39. 2. In the book by Adama et al,. ~.,. p. 212, a case in wh1ch the cereal.
(8) - 6 and temporary subsidy before the crop was able to compete in world marketa without .ssl.stance. Prom 1951 to 1958 INA was known as the Corporacion de Defensa de Productos Agr1colas.. In 1968 lNA was superseded by a new government controlled body called. IDEMA (Instituto de Mercadeo Agropecuario).. In most important respects IDEHA. closely resembles its predecessor except that ita range of functions and powers la w1der than before.. Inventories of domestic erops and imports provide the supply-. side control of domestic prices and constitute the source of the budget for IDEMA. as 1n the pasto. At planting time IDEHA announees floor prices for a wider erop. sssortment including rice, sesame, barley, edible beans, corn l sorghum, soybeans,. wheat. potatoes and ani... 1. IDEMA attempts to buy all that is offered st these. prices but uses it8 import power to insure floor prices are less than open market. priees and the bulk of the crop is therefore handled by. p~lvate. interests.. Floor. prices are still pegged to average production costs inclusive of normal profit, are uniform for all parts of the eountry, and are baBed on delivery to purchase or storage points owned and operated by IDEMA (or more preeisely by the storage affiliate known as INAGRARIO).. IDEMA 1. also empowered to offer especlslly attractive in-. eentive priees (precios de fomento) to stimulate the supply of particular products. It may also purchase on-farm crap supplies at an intervention prlce somewbat less than the market price in arder to restraln short run price inereases.. Farmera are. entieed to sell at these priees because IDEMA will lower its quality standards (aceept a higher moisture and trash eontent) and absorb a portion of the farmers' gravers organization (FENALCE) brought about the rever sal of INA plana ta import P.L. 480 foodgralns ls documented. 1 Another government agency, the Superintendencia Nacional de Precios,. cantrols the priee and absorption of agricultural products used ao an input in manufacturing processes and aloo distribution margins in the case of milk and meats.. Ii.
(9) - 7 transport cost... Normally mast farmera must sccept a higher transport ehsrge be-. cause of the limited number of IDEMA purchase points.. However. in bath the lsnd. reform and colonization projects sponsored by the government lsnd reform aseney there are no deductian. ta the farmer for transport costa. In 1969 IDEMA purchasea conatituted approximately 11 per cent of the velu. of the totsl output of thase commodities enjoyins price 8upport.. However. 87 par. eent of the total purehase8 rade by IDEMA during the 1968-70 period ~rated. ~ere. concen-. on the tbree products, corn, rice, and wheaL. whlch are most important in. terms of acreage, value, and foreiga exchange use, respeetively.. With the sSliet-. ance of 10a"8 from.the Inter-American Development and U.S. Export-Import Banka IDEMA embarked on a progrsm in 1969 of expanding its storage capacity by SO per cent.. By the end of 1913 IDEMA. ~uld. be in a position to purchase about 20 par. cent of the annual output of major grain crops.. According to FAO estimatea thi,. capacity would be suffieient to guarantee price Itabilizstion. l This is not the place to attempt a detailed evaluation of the luceeaa of IDEMA in meeting its own goa18.. There are, however, some crude indieator8'of. the appropriateneS8 of IDEMA policies.. Prices for any crop may be judged too. high if they induce import deficit8 in other crop8 and export 10s8e. for that crop.. There have been instanees ln which 8upport prices have either dl.torted. production choices or resulted in 1088eo on export 8ale8.. For example. ln Valle. the policy of higher catton prlces in the middle 1950. led to a growth in cotton acreage and a. cons~quent. glut in cottonleed cake at the asme time there wao a. lThis is a caoe in whieh suceess breed. on itse1f. lf market participants expect IDEMA to secure price stability thelr behavior will help to realize tho8e expectations. ThuB the existence of larger lDEMA capacity msy mean it ia never futly utilized in achleving stabillzation..
(10) - 8 -. reduetion in corn-bean acreage and a shortage of corno. 1. In 1969 rice and maize. exports required a sizeable budgetary subsidy of 32.5 million pesos (about 1.8156 milI ion U.S.) whith vas granted in response to the growlng accumuIation of stocks in these tva groups.. It is not possible to say whether instantes of this kind re-. flect an inevitable lack of foresight about the strength of internat and external demand or instead represent correctable defects of the price Bupport palicy. are varth noting ln any case.. !hey. A second criterion for judging the impact of 1.DEMA. policies is the ability of IDEMA to reduce the seasonal variance in agricultural priees.. One study of thls matter eoneluded that government lnterventlon through. IDEHA had achieved .little effect in redueing the varianee of either farm prices or 2 farm incomes. A before-and-after comparison of the kind in this study is not conelusive, however, for it fails to indicate whether the instability in prices'without intervention would have been greater, the same, or less in the later period when the government aetually intervened.. Perhaps the fairest judgment ls that from. the perspettive of aehieving self-sufficlency and reducing prite instability there ie no evidence of either dismal failure or unquestionable Buceess.. 3.. An Income Distribution Model. of Price Supports. A number of alternative approachea are ayaiIable in quantifying the distrtbutional impact of a price support programo. Por examp1e, one could compare bene-. fita as a fraction of groas income for different income groups.. Another pos.ibil-. lty i . a comparison of the percentage distributlon of ineome in the absence of lThis situation is deacribed in greater tength by Goering, 22. ~., pp. 9-10.. ~eBtor Gutierrez Aleman, Costos Soclales de los Precios de Sustenacion en Arroz, Instituto Colombiano Agropecuario, Bogota, Colombia, August 1972, p. 87..
(11) - 9 .upport. vith th~ pareentage distribution of program benefits. l. Thia approach. vould land itsel! to ea.y interpretation ainee Giai eoefrieients .0uId be caleulated to determina tha ehangea in ineome diatribution at'ributable to priee .upporta.. While th •• a methods of evaluation are of some interest they are not. used har. beeause they foeua excluaively on ehangea ln nominal lneame. A mora completa analysis of the problem ls to consider changes in real income and to recogui.e that the real gains von by any lncome group muat be realized at tha expense of other, less fortunate, income groupa. to achleve i! sn income slze elas. ls treated as the unit of. This goal ia 11mple a~alysis. and redia-. tribution vithin any :lass is ignored co that only the net positlon of the group is allowad to count in assessing gatns and losses •. Tha .nlly.ls basins with the 8"ralshtforward proposition that the sum of the purchas •• of domestie output for all lneome elasses, valued at producer prieaa, ta equal to the ineame earned by all incame classes.. When certain behavioral. 10-. aumptton. are introduced,thia aeeounting identlty 1. converted into a u.eful vahicle for examlning ineome redlstributlon. To fa.l11tate e.posttion, the follovlng notatton vl11 be used: C • amount ol cropj consumad by the tth incame clas., j - l ••• m; i - 1••• D ij P • producer price for erop j, j • l ... m j Qij • amount of erop j produeed by farmers who belong to the ith ineame cl.a •• Mij • amount of imports of crop j consumed by the kh~ncom. class. Importa are .old to consumera st priee P , the s.me .s domastic output. Total purchaae.. J. of crop goods by all income elassas are distributed between domestic output snd 1. Hetbo~olog!es of th!. k1nd have been adopted i~ the work of Bonnen and Schultze, 22. ~., for the United States. Bonnen concluded tbat the bulk of the expenditure on commodlty programs eluded the poekets of the marginal farmer. !he recent U.S. wheat sale to Russi. illustrates the inadequaey of this approaeh to lncoma dlstrlbution. The hue and ery ralsed by higher consumer prices for food wal not considered at the tlme of the aale by the USDA which was concemed only with improving nominal farm lneomes..
(12) - 10 importo: (1). t t:. Ci / j •. f r~lj + f f. Mil j. 18norln8 the subseriptson the summatlon slgns for the moment And taking first differenees of equatlon (1) ylelds. This last express ion provldes the basle aeeounting framework for the study of pr{ee supports.. A number of assumptions need to be made and then discussed. In order to emplrlcally implement this framework. f~r. ColombiA.. ternatlve to price support. Is no support 3t nl1, the chango in thet !s. envls1.on~d. Since a major alc~op. priesa ÓPj. invo!ves e-11owing dome5tic crop prlces to be ruled by world. prlce levels adjusted for overvaluat{on of the peBo. trlbutlon experiment looks at the real. ~neome. Thst 1S, the Ineome dls-. galns and losses of different groups. vhen domestle crop prices are adjusted to world prlees that take into account the dl.tortlon In th. current exehange rateo. It Is allumed that world prlees of the. varlous erops would be unaffected by the abandonment of the support programo natura of the exchange rate adjustment la consldered later on.. The. Distribution mar-. gln. between the prlces pald by consumera and the prlcea recelved by producers are ignorad throughout and assumed to be unchanglng vhen domestic prlce supports are removed.. Thus the full extent of any change in producer pricea Is aseumed to be. p•••• d on to the consumero. Sinee most crops compete at the margln with Imported sup-. pliea it i. aloo asoumad that tQj • -AM offaet by more or fewer imports.. j. or that changes in domast!c output are exactly. Where initial imports are a negliglble fractiorrof. total output it i. alternatively a.sumed that AQj • O or that there is a zero supply.
(13) !iu (,add,) Wodd Support HatUt. Xaer. b:!U. 19!4. TAIL& 1,. ~rket.. lupport 'rice. KlrklC. l1li"$. l!.!S!. Prlce. 470. 400. 571. 710. WS!. 'upporc Vorl' Prlcl. ~. Vorld Prlc •• by ero, ('.'01), 1".-1970. !!"..!!l. Support. Karltet. lIW. Pr1ce. Vorld ~. 385. 3BO. 39S %71. SuppotC. ~. ... Karut. .,..,. lW.!. !Wi. !orbe'!!. 19S5. 400. 475. 542. 642. 650. 197. 415. 400. 1956. 440. 485. 520. 642. 680. 190. 470. 425. 1951. '12. 615. 725. 760. 402. 498. 4BO. 1958. 840. 750. 856. 870. 509. 620. SBO. 690. 550. "0. 19n. 840. 770. 921. 940. 494. 684. 630. 608. 6S0. 1,050. .s,. 1960. 840. BU. 921. 880. 50S. 684. 624. 800. lOO. U,. 1961. 1,006. 95.. 911. '" 957. 598. 760. 637. 567. coo. ase. m. 651. 642. 575. eso. 900. PI. 1,200. 1,039. 1,600. 1,042. 845. 843. 825. 1962. 1,006. 9". 921. 196'. 1,260. 1,046. 1,098. l,on. 807. 828. 1964. 1.260. 1,347. 1,428. 1,394. 732. 898. 720. 1965. 1,260. 1,703. 1,428. 1,S2S. 806. 999. m. 1,460. 1,700. 1,064. 1966. 1,720. 1,684. 1,714. 1.75S. 1,020. 1,284. 1,162. 1,460. 1,8SO. 1,446. 1967. 2,OSO. 1,914. 1,714. 1,756. 1,052. 1,Z74. 1,262. 1,680. 1,930. 1,111. 1968. 2,OSO. 2.106. 2,\00. 1,956. 1,100. 1.490. 1,148. 1,680. 196'. 2,000. 1."6. 1,450. 2,100. 2,0!9. 1,1.50. 2,000. 1,600. 1,260. :Z,OOO. 1,600. 1,260. 1970. 2,250. 1,8SO. 1,785. '.100. 1,933. 1,2". 2,000. 1,592. 1,415. 2,000. 1,SU. 1,415. 1.650. 1,B96. ""to... (1) lnfor.aUoa oa .upport pl'lclI C" pt'SUrUy frOll ch. &OVlrnMl'I.t .artot1nc "IDC, u.a .. v •• luppl....tld la ••rl1tr y•• r. by the publllbe4 .. tart.l 01 otbar lovaram.nt of,ln1aattOQl. _ .... peleN tw euh CI'Op Ue ¡NbU.hald upluly by tba hace d. 11 bpubUta. N..-rout; .ourc •• accouatn 101' tha dlta GIl ... 1' (Ctr. Aet_uc pore ot ColOMbia) pric... t.Aeludiq .,.c1al repon. OD Colombia 01 the WOl'ld Baü (uaD), Cha ..... , de eo-rclo laurior of tbe "*Uonal Statillt1cal Alcey ~~ ullpub~t.ta.d 1DDIA deca ••anual repone 01 rAO 1M aClttared bitl el individual rea.lrcb on Coloabian I,rleultur •• Br••u 1za Iny priu ..rt... indicac. 10 Mlt .... • tanca. tbe uaraliabllity 01 the data rltber thall Lt. noaavIL1.biltt1 • • 12 ...
(14) I , 1. ¡. ¡ ,. - 11 -. when only a .1ngle prlce 1. altered and so the 8ssumptlon of no quantlty responsl may not be extreme.. lt could in any event be removed if eatimates of lupply. elaaticltles were ava11able.. Sim11arly, it. asa~d. that the responsa of cOQ-. sumers is imperceptible by lnvoklng the sama rationale as in the case of aupply. In additlon to the dearth of demand alasticlty eatimates, the fact that a l_rge numbar of crop pricas are permitted to vary together makes the assumption tbat ~Cj. • O not unreasonable. When these restrlctions ere imposed on equation (2) the result i.. Equation (3) ia a firat-order approxlmation of the income redistribution resulting from a change in crop prices.. There sre two features of. th~s. equation worth noting.. Por any incame group the term E(C ij - Mlj )AJ j measures thechangea in income on the uaes slde whl1e the term EQ1j6Pj measures the lncome change on the aource. sida. The dlfference between these two measures lndicates how the real incame of ehe partlcular group la altered.. Moreover, the sum of the real gaina and loa.ea aprlld. over a11 groups 1& zero and the hypotheslzed prlce change therefore generatea a pure or zero-aum redlstrlbutlon of lncome among the varlous lncome group •• The data needed to implement thls approach are contained ln Tabl •• 1, 2, aed 3. Frlce information on. tl~. eight crops that were considerad ls presentad ln Tabl. 1.. Obtaining a consistent set of price data over time for any crop la dlfficult in vlew of the uncertalntle. and potentlal di.tortlon. that. ~eault. from var1abl11ty in. the compositlon of crop grades, from dlfferent time intervals for th. availabl1ity of particularprices, and from conflict among various .ources whlch often originat ••.
(15) UBU 1 (cont.). X!!!:. Support ~. Cotg K&rkat. Wor14. ~. !!!:! 279. ."'pport ~. PotUo.. Kerk.t Vorld !!!i! ~. Bean'. Support. Ka""'iket. ?rlco. ~. Wor14 ~. s...... S'upporc. j¡i¡;t. Vorld. !ll5.!.. ~. !!ill.. 318. 319. 192. 1,140. 621. 588. 300. 311. 211. 159. 1,070. 566. 686. 319. 350. 311. 312. 575. 1,360. 559. 833. 1957. 319. 430. 311. 311. 1,440. 1,837. 1,323. 1958. 440. 385. 360. 370. 621. 1,440. 1,490. 1959. 440. 450. 384. 360. 304. 371. 1,280. 1960. 440. 474. 300. 360. 350. 555. 1961. 560. 629. 511. 504. 69.. 1962. 750. 526. 600. 291. 19',3. 850. 794. H84. 925. 1.040. 1965. 925. 903. 1966. 1,020. 1,104. 1967. 1.250. 1.203. 1968. 1,010. 1,294. 1969. 1,300. 1970. 1,350. 1954. 280. 330. 1955. 280. 1956. 347. 590. 1,280. 1,350. 1,323. 1,400. 1,350. 1,323. 1,250. 1,280. 2,000. 1.5'0. 1,S19. 1,280. l,7w. ~.277. 1,640. 1,"0. 1_617. 1,319. 2,066. 1,873. l,5iO. 2,250. 1,562 2,'0'. 730. 863. 2.419. 2,SS5. 2.100. 2,450. 1.050. 1,047. 2,987. 2,lIt2. 2,100. 3,283. 612. 3.200. 3,477. 2,164. 2,100. ',283. 983. 3,200. 3.662. 2,630. 2,900. 3.682. 876. ',200. 3,393. '.500. l.934. 942. 822. 6,800. ',230. 4,691. 3,700. 3.111. 1.319. 994. 1,260. 4.500. 4,995. 4,"6. '.700. ".371. 1,490. 1,000. 1,040. 4,'00. 4.774. 3,700. .,79'. 901. 2,05%. ',670. Note.: (2)The follQWtns Irade cl ... tfL~.ttonl ..r~ ..ant to spply to tba support pricc.: ryp. l. eata.ar, A lar paddy ri~e, hLsh arad •• for vhe.t (hard wha.t) an4 barlay, ev.r.Sa grada. tor aoybeaa., yall~ an4 Yhlta h1¡h grade como attcl 'I'ype II, estegory A (CdbWI. Nial vutetie.) fQr bu"". ~r~.t an4 World prit •• vera iapp•• lbl. to control oa a consl.tent quality ot Irade baal. and .uch of the apparaQt unreliab111ty of th. data could be r.lat.d to tbb proble.. - 13 -.
(16) - 14 -. when the same data ls reported for different geographie loeations.. An attempt. has been made to seeure comparability of the price series by excluding data wbich could concelvably introduce significant quality variationa.. Gaps in any year for. IUpport pricea, ClF import prices or for market prices received by producers reflect dtber the absence of any information or a vote of nonconfidenee in it. The relinblllty of the ClF values is most worrisome sinee that serie a derlves from a. n~ber. of diverse sources, quality was diffieult to standardize and. the crop deflnltlons and cla.slfleationa used by any single source often underwent bewl1derlng revisions. 'An important issue i. the appropriate basis for the comparison of domestic with international prices.. Since announced support prices were intended ta act only. ." a floor or mínimum return and market prlces are a reflectlon of the import pol-. icy of the price support agency, it is clear that current marke, prices would no longer be received by producers if 'internaCional prices rulad.. From the point of. vlew of a buyer of the crop (a miller or vholesaler) his optlons conslst of purchasing the crop at lts landed ClF prlee or relylng on the sales of domestie farmers.. lf the average distanee between the port of entry and the buyer ls roughly. the same as that between the domestic farmer and buyer, the relevant price compar-. iBon ls CIF vls-a-vis ex-farm or market priees.. There 1. no need to adjust either. the ClF or the market prlees for transport margino in determlning the alternative prices tbat would be recolved by producers vlth the price support program and without lt. l Another matter that requires some consideration 1. the eholce of uslng either. ~ere the assumption oí offsetting transport costs 18 obviously lncorrect the market price should be compared to the CIF price plua transport costs to the point of use les s transport costs from a Colombian farm to the S&me destination..
(17) - 15 the actual exchange rate or an estimated shadow rate to mak. vllue converaions. In mest Latin American countries the adoptlon of import sub.tituting industriali%ation strategies of economic development has led to the erection of high barriera to trade in industrial goods. in the. n~inal. The result of the.e policiel is a decline. exchange rate with respect to domestic price level. and th. creation. of an . artiflcial inducement to import food products which di.courages dome. tic agricultural productlon.. Colombia iB no exception to thi. pattarn.. This initial. trade situation suggests two important reasons for adJusting the nominal exchange rate in order to make appropriate price comparisons for a situatlon with price supports and one without supports.. In the first place, it is clear that elimination of. price supports would elicit large sea le imports of products ln whlch there l. currently a close balance betwaen domestic demand and 8upply (rice, corn, beana, beans, and barley) and al so. th~se. presently being imported (maínly wheat).. 80y·. La~ger. imports of food products would eventually generate pressure for depreciation of the Colombian peso.. In the 'absence of a fully specified model of the economy lt ia. h1ghly des1rable to account for as many relative prlce change. 5. poss1ble· in comparing actual and hypothet1cal 1ncome distributions.. Otherwl.ó, the situation ex-. pacted to occur under the hypothesis may not be realized and th. comparison would not be meaningful.. Secondly, there is some interest in determining the 1ncome. tribution implications of moving to a more eff1cient allocatlon of resourc.a.. ~is. A. particular resource allocation can be deemed efficient if the dom •• tic·r•• ource cost of earning or saving a unit of foreign exchange is the samO for every actlvlty. In Colombia thi. crlterion implies that prlce supports should avoid surpluses that can be sold only at a sub.idy larger than the 15 per cent CAT subvention available to mlnor exports and also should avoid import replacement if th. required degree.
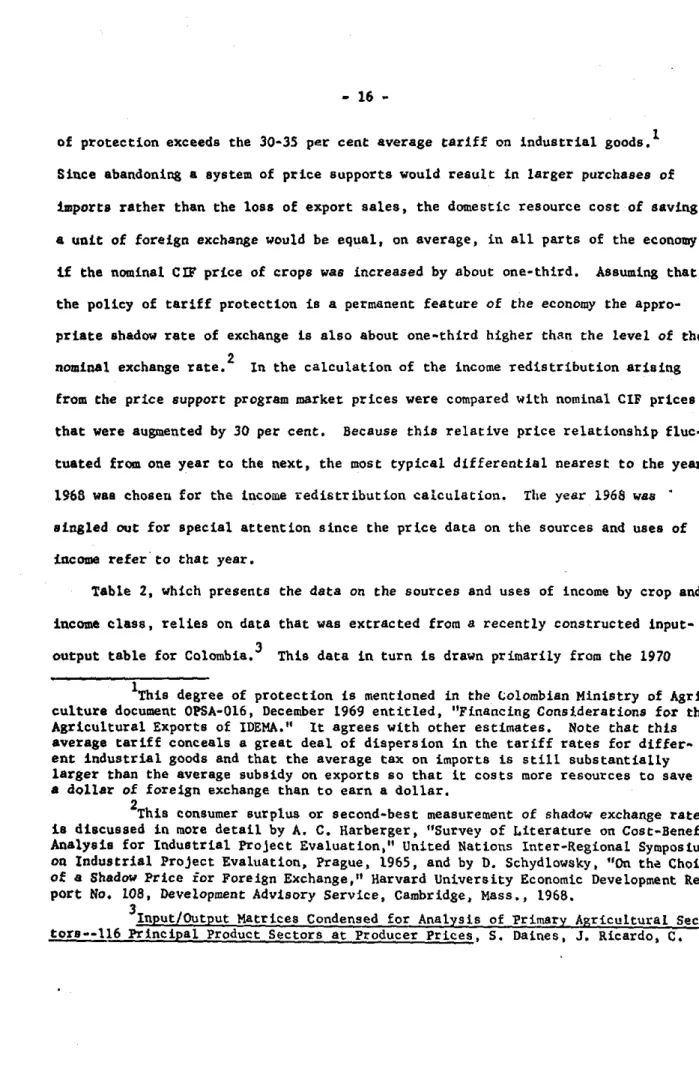
(18) - 16 -. of protection exceeds the 30-35 per cent average tariff on industrial goods. 1 Sinee abandaning a Bystem af price BupportB would reBult in larger purcha8e8 of importa rather tban tbe 10BB of export Baleo, the domestic reoouree cost oi saving a unit oi foreign exchange would be equal, on average, in all parts of the economy lf th. nominal CIF price of crops was increased by about one-thlrd.. ABBuming that. the policy of tariff protectlon is a permanent feature of ehe economy ehe appropriate 8hadow rate of exchange i8 also about one-ehird higher than ehe level af the nominal exehange rateo 2 In the ealeulation of the income redistrlbution arising from the price support program msrket prices were compared with nominal CIF prices that were augmented by 30 per cent.. Secause this relative price relationship fluc-. tuated fran one year to the next, the most typieal differential nearest to the yesr 1966 waa chosen for th. lneome redistributlon calculation.. Ihe year 1968 was. singled out for speeial attention since the price data on the sourees and uses of income refer·to that year. table 2, whlch presenta the data on the souree8 and uses oí income by erop and lncome clas., relies on data that was extracted from. 8. recently constructed input-. output table for colombia. 3 this data in turn i. drawn prlmarlly from the 1970 1. This degree of protection ls menttoned in th. Lolombian Ministry of Agriculture document OPSA-016, Deeember 1969 entitled, "Ftnancing Considerationa for th. Agricultural Exports of IDEMA." lt agrees with other estimates. Note that thi. average tariff coneeals a great deal of dispersion in the tariff rates for different industrial goods and that the average tax on importa is still substantlally larger than the average subsldy on exports so that lt costs more resources to save. a dollar of fore1gn exchange than to earn a dollar. 2. Ihis consumer surplus or second-best measurement af shadow exchange ratea. ia di.cus.ed in more detail by A. C. Harberger, "Survey of Literature on Cost-Benefit Analy.is íor Industrial Project Evaluation," United Nations lntor-Regional Symposlum on Industrial FroJeet Evaluatlon, Prague, 1965, and by D. Schydlowsky, "On th~ Choice oE a Shadow Frica ior Foreign Exchange," Harvard University Eeonomic Development Report No. 108, Deve10pment Advlsory Servlce, Cambridge, Mass., 1968. 3. Input/Output Matrices Condensed íor Analysis oí Primsry Agricultural Sectora--l16 Principal Product Sector. at Producer Prices, S. Daines, J. Ricardo, C..
(19) TABU: 2:. Sources and Uses of Ineame by Crop and Income elasl. (Thouaanda of 1968 Colombian peaos) Sources. !!!!!. lncome. Clas. :. 1. II. III. IV. V. 1. Il. III. IV. Y. 69,931. 141,348. 20,441. 40,391. Crop potatoes Besns. 272,891 243,788 ll2,268 78,373. 69,949. 28,202. 33,207. 86,223. 8,008. 20,908. 255,575 173,952 107,371 65,614. 47,267. 31,727. Corn. 387,103 346,787 174,236 60,813 196,450. 335,472 275,423 197,762 122,691. 214,041. Riee. 502,688 453,624 211,281. 77,323 144,042. 363,833 299,384 242,466 156,240. 327,035. \/heat. 452,060 405,510 185,148. 71,347 127,517. , Sarley. 37,282. 30,227. 24,146. 15,726. 33,482. 33,589. 19,285. 6,575. 25,9;-j'~. 28,341. 22,872. 18,449. ll,560. 41,374. Sesame. 44,517 39,933. 14,293. 4,906. 8,236. 36,758. 25,633. 16,374 10,592. 22,528. Soybeans. 88,549. 28,430. 9,760. 16,399. 58,930. 48,445. 37,588. 53,182. 37,193. 79,431. 24,424. Notes: (1) This table 18 based on data contained In Inp~t/Output Matrice. Con densed for Analysis of PTimary Agricultural Sectors--116 Principal Product Sector. at Producer Prices, S. Daines, J. Ricardo, C. Gleasan, G. Poynor. St4tistical Working Doeument 12, Agency for International Development, Ma~ch 1972.. (2) lntervals for the flve ineome groups ln pesoa per month are definId ln the fo11owing manner: Group 1 - less than 500 pesos, Group 11 - 501 to 1,000 p.'OI, Group 111 - 1,001 to 1,500 peaos, Group IV - 1,501 to 3,000 pesos, 4nd Group V - moro th_n 3,001 pesoa. (3) Total uses glve a sum whlch closely approxlmates grosa output valu. and total sources have be en adjusted to agree with total uses for purposes of analyale. The gross output figures contained in the input-output table are in close agreement with independent estimates made by J. Atkinson, Changes in Agricultura! Production and Tech~ology in Colombia, Washington, D.C., U.S. Department of Agritulture, EconomLc Research Service, Foreign Agricultural Economic Report No. 52, June 1962.. - 17 -.
(20) - 18 aurvey of urban houaeholda whleh dlsaggregated all familias ineo fiva lneome elassea. Having only five ineame siza eaeegoriea ia lomewhat eonflnlng for econamic analy"ia ainee the ineome variation within eaeh broad. inco~. clas8 Ls negleeted and thare-. fore the total varianee of ineome earned i" understated.. However, there i. prea-. ently no substituta for the information contained in the input-output table whieh la ao far unlque in linking uses end aoure.s of income by ineome size and type of production aetivity.. Another ahorteoming of thia data ts ehat the aggregate dis-. tribution of ineome auggeses more equaliey ehan ia in !aee likely to existo. In. the input-output table the two bottom ineome groups, whieh togecher compri.e 72 per cent of total incóme earners, reeeive about 46 par cent of total ineome while the DAN! (National StaciscLc8 Agency). dat~. on which. ~h.. table is based. indieaced. that the Lncame ahare of thes. two groups was only 32 por eent.. Nonethelesa, after. eertain adJustmenta are made to the raw data in the table th. rattern of sources and uaea by income class ia highly plausible.. For all of the cropa eonsidered an. extra dollar added to the price of thc erop would reault in greater Lncreasa. in expenditures than in earninga for the low Lncome group. and larger incrementa to earnings than to expenditures lor the higher income groups. %he adjustments to the raw data in the input-output table used in derivLng rable 2 wer. twofold.. lhe uae. data in lable 2 repreB.nt th. sum of dLrect and in-. direct uses in th. input-output tableo cropa wLth no Lndirect uses.. Potato.s, beans and Boybeana were the only. Wheat and rice were usad Lndirectly in milling.. Seaame waa used entirely in olla snd in other foods.. Corn and bar ley were used. as input. in che livescock actLvities of e8gs, milk, pork, eattle and eattle ralalng. i. ¡ I ¡. Because the consumer purchsses gresa output while the producer on the Bources. Gleaaon and G. Poynor. StatiBtieal Working Development. Mareh 1972.. Doeu~nt. 12, Ageney for !nternational.
(21) - 19 side reeeives that amount les s intermediate input purchase •• total uaes of erop alwaya exeeeded the &mount of total aoureea. been adjusted proportionate1y so that. tc~al. a~. In Table 2 the aourees have. aourees equ.'l total uses.. 'Ihis ad-. justment is in keeping with the ear11er asaumpt10n of a zero aupply elaaticity when a11 erop pr1ce. are changed snd preaumes that purchasea of intermed1ate gooda would remain unchanged as the eonsumer paya an extra dallar more or less. for crops whenever price supports are introduced or abandoned.. A a1milar type. of reason1ng is emp10yed in the effective proteetion literature where the influenee of tariff changes on an aetivity's value-added is examined.. In the case at. hand the adjusted aourees permit measurement of income change. accruing to the on-farm resource. of land and labor 1n response to changes in price supports. For potatoes, beans, corn. rice and barley, the foregoing procedures were. felt to lead to reasonable adjustments in the data since thc :um of diract and. indirect uses closely approximated the value of gross output in each crop.. 1. However, this was less true for sesame and Boybean. whose relatively 1arge assignment to the inventories category could not be directly traced to any incame elas8.. In the case of these two eraps, bath the uses (in 011. and other foods). and sources of in come were adjusted proportionately to match the level of grosa output.. The remaining diffieulty concerns the disposition of wheat.. Wheat. POSP8. apecial problems for the analysis of price supports because, unlike the otber eropa, tt i. a significant import commodity.2 By the end oE 1971 ¿omeatic wheat production was only two-thirds its level in 1962 and accounted for onIy about 15 per cent of domestic eonsumption.. lt was explained earIier how IDEMA finanees. 1 Total uses did not exactly equal gross output value due ta the omission of Some sma!! indirect. uses of the crop. 25ma !1 and sporadic imports of corn, rice and bar ley have occurred but there has be en no consistent tendency to ~port sny of these crops. Recently, bar-. ley has been a more frequent entry on the side of imports but the amounta involved have been a neg1igib1e fraction of domest1e output..
(22) - 20 -. lta operations through 1ts sbility to import wheat at world price., or even lower prices in the case of Vnited Ststea P.L. 480 wheat, and sell thes. producta at higher domestie prices.. In effect the budgetary funds for IDEMA are raised from. s regresslve sales tax on food consumption.. If this peculiar tax were removed a. aubstitute aource of finance would have to be found, presumably from the regular tax system.. In Table 2 the uses of wheat far exceed the sourees of lneame from. wheat to reflect the importance of initial wheat imports.. If wheat prices fell. to adjusted international values consumera in all in come classes would experience real ineome gains due to the repeal of this regressive consumption tax.. However,. since the budget of IDEMA would be met by 1neresses in other forms of taxation the gain ln real ineome through lower prices wouId be offset by lower disposable lneames.. Tbis offset is not taken into accQunt in 6ubsequent calculations beeause. there 1s no reliable way of telllng which taxes would be compensator11y raised. Nonetheleas, "it is unlikely the government would replace one regre.slve sales tax with another so the prlce-cum-tax ehange would be expected to result in a redisttlbutlon of income from rich to poor.. As it will be seon, this r.distributivo. effect would be similar to those realized for the other crop price changea. In Table 3 ia presented alternative estlmates of consumption patterns by erop and by income position.. Eaeh estimate, ineluding the one which utilizes the aame. data found in Table 2 on aources and useS of incorne, suggests the expected pattern in whleh the fraetion of ineome spent on each erop declines monotonically as lncome increases.. Por the combined expenditure on all erops the data derived from. AID sources indicate that the ratio of expenditure to income i. 4.17 times greater in the highest income bracket than in the lowest lncome braeket.. lf it LB recog-. nlzed that the defLnitionsof highest and lowest incorne bracket differ, the.
(23) TABLE 3: lncome Clasa: a). Alternativa Estimates of Consumption Ratioo by Crop and Incame C1ass (per cent). I. III. IX. t'. b). IV IU'. lI'. V IV'. Crop Potatoes. 1.17. 1.27 4.0 .37. Beans. .33 2.74. Corn. 1. 73. 2;35. 2.17 9.2. Wheat (bread). 2.11. Ses ame Soybeana (oil). 2.91 .41. Total Crops. 3.9. .74. 19.4. .42 .98. 1.14 .16 1.50. 7.5 14. 1.3. 2.38. 1.55. .47. 1.19. 1.62 .23. 10. .07. 4.08. 2.4. .64. 1.29. 1.49. 2.67 .38. .37. .42. 6.84. .07. 1.01. 1.71. 1.94. 11. .98. .77. .28 .46. .13. 1.41. 1.34 Rice. 1.11 .23. 1.66. 1.81. .ss. .91 2.27. .38 .05 .83. 4.4. 9.38. 2.64. 3.5. Notes: (1) The columns representing the income ela •• e. I through V use the data described in Table 2. Columns l' through IV' represent data contained in the Final Report of the Rural-Urban Intermarket Pralect (PIMUR) based on a ConSumar aurvey in 1968 of people in Cali and the department of Valle and pub11shed by Michigan State University in 1970. The income intervals in this study differ significantly from thase in the first study making the comparison of consumption ratio. acros. the .tudles imposaible. Differences in crop definition also add an element of noncomparability. (2) Only one other attempt to measure food consumption patterns by income class has be en made. Thls 10 the CEDE study by R. Prieto entitled Estructura del Gasto y Distribucion del Ingreso Familiar en Cuatro Ciudades Colombianas 1967-1968, Parte Tercero, Univeraity of Los Andes, Bogota, May 1971. Unfortunately this study treats crops at only an aggregate leve! and C8nnot be decomposed for the study of. particular crops. However, for the aggregate entity cereala and derivativos the pattern of expenditures ls similar to that in Table 3 for total crops as the loweBt income group spend~.3 per cent of its ineame on cereals anó derivatives compared to 4.7 per cent for the richest income group.. (3) Each entry refers to the per cent of total incame spent on a particular crop for any income group.. - 21 -.
(24) - 22 comparable ratio for the PlMUR data ia 5.5 while that for the CEDE data is about 3.3.. Ibe overall eonsisteney oi the AlD data with other Bourees of information. meana that some degree of confidenee in the distributions of Table 2 would not be entirely misplaeed. Table 4 summarizes the income distribution ealeulationa using the data in the preceding tables.. Prie. relationshlps prevaillng in 1969 were used for rlee,. barley, eorn and beans while the priee changes for wheat and soybeans refer to the yeara 1968 and 1970 respectively.. No satisfaetory price data were felt to exist. for potatoes and sesame so these erops are excluded in Table 4 •. A glance at Table 1 confirma that had 9ther years been. ehose~. lnstead--assuming that data on sources. and usea were available for thes. yeara--the estimates of income redtstribution WQuld have displayed considerable variation.. Despite the annual variability in. relative prieea the ealeulationa ahown in Table 1 are probably of the right order of magnitudé.. Four types of priee compartsona were admitted in Table l.. The. first estimate compares market prices with unadjusted CIF values while the second estimate allows for 30 per cent overvaluation of the exchange rateo estimates compare support price levels with adjusted and. unadjuste~. !he final two ClF values.. Vith these two calculations the hypothetical sltuation ls explored in which IDEMA 1. able to guarantee lts floor price to all producers.. lt ls assumed that if IDEMA. had posseased more storage eapacity in those years it would have been succe.sful in preventing market prites from falling beneath the level at which prices were to be 8upported.. Deeause low income groups invariably spend more. on a crop than they earn in produclng it,and the opposite ls true for hlgher lncorna groups,abandonlng the price 8upport program would, with few exceptions, result in elear-cut equity gains.. Only.
(25) Note.: (1) ,or .ach cro, che ,.~c.ftt... ,ric. chana' ~.'I.et. the follovlaa p~le. compartaoa.s Martec prte •• vlth u~dluae.d world pric.a ~ lb. flr.t colu.a; lIuk_t prle .. ",teb IIdJ\lua4 '11«1' ,rice. 14 th. . .caa4 col .... ' urport prtc.a vleb unadJuet.d vorld prte•• la colu.a ebrea aad, liDAll" ,uppGrt ,rtc •• vtth adJ~t.d vorld prlc" in tbe la.e colu.a. (2) ne thlrd ad fcurth col ..... 'al' .ayb.. na en b.clUn .upport prtc •• ver •• ub.tlDttall, belov ~~e ,rte •• In ebat Y"r and le v .. f.lt thal ehi. oueco.a v•• ID accld.at rath.c lbeu • d'et8ft of polley, () ,.renc••• ,rtc. c....... I'd)' O.Q data .in rabt. 1. !'h. produce 01 th. p.rcenta¡. pl'lce eha1\l' ... Che dUhrenc:. betv••u .oure . . . . . . . .. tal: • .eh lacOllll el ... la T.lth 2 1'" tM taco.. cbaftl.' tor .&eh erop.. .t"'q. o. ZS. o.
(26) ,<1. • ~ •. ;. l'. "'-r.,. .- '·24.,- .•:.. ln the case ln whlch market prlc •• for rlce and bar ley coincide with adjusted internatlonal value. would no change occur tf pricesupports were dlsmantled. Beans provided the only instane. in which lncome tran.fers would move the other way because adjuated lnternaUonal valuea for this crop exeeeded actual market priees.. Generally apeaklng, the maln feature of the eurrent prlce support program. ls a ttan.fer of real lncome from groups wlth below average ineomes to groups whieh enjoy income. above the mean. ducers and conSumera at each. l~v.l. Taklng aecouat of the position of both proof. iDCODO,. most of the burden of priee sup-. ports lo borne by low lncome cOnsumers while most of the benefits flow to high 1ncGme producers.. If the monetary galns of the two bottom lncome groups 1 and 11 are .ummed for the varlous prlce altetnaUves lt can b. seen that " total galn of 476,113 thousand pesos would be su.tained lf market prlces fell to current world prlces, 185,877 thousand pelo, lf market prleea feU to adjústed world prlces, 577 ,683 thousand pesos lf rullng support prlces were reduced to existing world price levels and 310,726 thousand pesos tf rullng 'support prices were brought into line l with adjusted world pr1ces. The llst est1mate is probably most representative of the magn.itude of income redistr1butiontowards the rlch under the current pdce suppor:.: program slnce t except for corn and l!J.o,ybeans, lt aSSumes that levels of. price supports were actually realized in the market. An lmportant policy question is the relative size of these income transfers. Whl1e lt ls imposslble to objectlvely determine at what point a transfer becomes slgnificant for poliey purposes, Table 4 offero some notion of the relE.Uve magl.rhe last two estímatea' use mfll'ket 'rather than support prlces' for corn and soybeans because the fact that the former price was substantially below the. latter most likely represents Bn unlntentional aspect oi prlce policy which would be corrected in otber yeara.. ''o,.
(27) - 2S -. nitude of the ineome transfers.. Por rice about 21 to 22 par cent of the changa. in the &maunt of expenditure that wou1d occur wlth no pr1ce .upport wou1d b. transferred to low income groups frolD the higher income c1as"es.. Correaponding. pereentages are rough1y 107. for corn and for beana (wlth a 8ingle exc.ption) and about 16 to 17 per cent for barley.. In the ca.e where the market pr1ce of ba.na. would rise by about 14 per cent in the absenee of priee supports, about 10 per cent of che extra expenditure on ehis crop would represene a transfer frolD low to high incame groups.. There 1. no reasan to belleve that lneome redl1trlbut10n. on the seale jUlt mentioned ls an lnconsequentia1 eoneern for·econom1c policy. Befare turning to an examination of the effieieney aspeets of prlce aupports some d1scussion of ehe funetional ineome di.tribution changes aa,oelated wlth supporta wauld. pa.~. das1rable.. !bis topie has hean oxp10.ed el ••wh.r~. uy. Ployd and others and the eonelusions reaehed ln thelr analysil are dlrectly app11cable to Colombia.. Beeause the demand for agrlcultural products la inelaatic. the lmposlt1on of above-equilibriu.. pdces through price 8upports will ;·aL.e total expenditure on the supported commoditieo.. Tbe diotribution of this extra expend-. iture between land and nonland faetors wlll depend on the eonflguratlon of supp1y elaaticlt1e. for these factoro and the slze of th. elastlelty of factor sub8tltutlon.. Those factor s lean elastie ln supply wlll expertenee the largest prlM. increase provlded it is not easy to technlcally substltute other factor. for thi. lThe seminal artlcle 1. by John E. Floyd, "The Effeets of Par .. Prlee Supports on the aeturns to Land and Labor in Agriculture," Journal of Polltical Economy, Aprl1 1965, pp. 148-158. Floyd relled on a two-factor neoclasslca1 framework to investlgate how factor returno and employment respond ta varlous prlce support schemes. His work ha. been extended by Flnls Weleh to con.lder tochnologieal ehange. See Fin1s Weleh, "Some Aspects of Struetural Change and the Olstrlbutlonal Ef~ects of Technical Change and Farm Programs," ln Seneflts _nd Burden. of Rural Development, Iowa State Univers1ty Press, Ames, Iowa t 1970, chapter 9..
(28) - 26 -. these.. Since in the long run (and perhaps in the short run a. well) the oupply of. labor and capital ls apt to be perfectly elastic to agriculture and the substitution elasticity between land and other factors is likely le.s than one, the impact of hi&her product prices will probabl, rals. the return and the incoee ohare of inelastlcally supplied land. descriptlon of the economy.. Aggregate data for Colombia tends to confirm this Over the period 1950-1968 average per capita incomes. in agr1culture were rising at an annual rate of about two per cent while the real. wage stayed virtually constant.. 1. Data otretching over a slightly longer interval. alBO indicate that the lncome shares of land and capital hsve risen at lhe expense of labor.. A higher ¡snd share in incomo would be a predictable outeome of price. supports in Colombia.. Beeause the ownerJhip of land io much more highly con-. centrated than the ownership af nonlsnd faetors, the higher land share would be translated into a larger disp.rsion of nominal ineomes.. Another way of illustrat-. ing this result is to note that the least labor intensive farms would gain the most from a program of price supports.. Farms with low labor intensity tend to be. larger farma so these farms with higher inltial incomes would tend to be th. primary beneficiaries of priee supports.. Ihis brief excuroion into funetional income. anolysls reinEorees the previous reBults for the size distribution oE ineames. Ibe eonclusion is ineseapable that the operation of priee supports contributes to income inequality in Colombia. 4.. Priea Supports and Eeonomic EfElcieney. Ihe effieLency problem of priee supports has received far greater attentLon 1. These income trend. and other avidenee pointing to an elastic supply of rural labor are discussed in R. Albert Berry, "Land Distribution. Income Distribution and the Productive Efficianey of Colombian Agricultura," Yale University, Economic Growth Center, Disc~ssion Paper No. 108, March 20, 1971..
(29) i. l I. - 27 -. in Colombia than the question of ineome distribution.. Henning vas among the first. to propase that for eífieieney reasons support prieea should be pegged to international prices adjusted for a shadow rate oí íoreign exchange. phasi~ed. 1. He correctly em-. that the alternative of tying price supports to average produetion costs. fails to eneourage effieient production praetices for any crop and also fails to stimulate the mix of crop commodities in which Colombia enjays a comparative advantage in world markets.. Gutierrez undertook the measurement of the social costa. of price supports in rice production.. 2. Using a cobweb model of production in. which the rice market does not clear either with or without government intervention, he estimates tbe value of the lost consumer and producer surplu8 that. results from IDEHA price supports.. For different years this cost fluctuates be-. tween .06 per cent and 16.5 per cent of the value of rice output. careful examination of price support policy in the case of wheat. 3. Dudley made a Invoking the. principle that to minimize the total cost of obtaining wheat the marginal social costs of domestic production and importation must be the same, Dudley adjusts CIF pricea of wheat for distribution costs, a 30 per cent overvaluation of the peso, and a 25 per cent deduction from private domestic praduction costs to allow for zero opportunity costs of unskilled labor and land used in wheat growing.. The. determination of the optimum support price is most easily seen in the diagram below.. PMC and SMC refer ta private and social marginal coSts, respectively, of 1. Robin G. Henning, "A Suggested Agricultural Price Policy for Colombia," IDEMA, Bogota, October 1971.. ~estor Gutierrez Aleman, Costos Sociales de los Precios de Sustenacian en Arroz, Instituto Colombiano Agropecuario (ICA), Bogota, August 1972. 3. Leonard Dudley, "An Analysh oí Alternative Policies íor the Wheat Market in Colombia," National Planning Department of Colombia (planeacion), Bogota, July 25, 1972..
(30) DlAGRAH 1:. Determination of Optimum Priee Supports. Prlee. Q. P represents the crF price adjusted upward for the estiM mated extent of overvaluation of the peso and for a distribution margino The domestic production.. optimum Bupport prlce is given by the intersection of P and SMC which determines M optimum domestic output of Q* and thus the requi.ed support price of p. needed to ellcit the amouut Q* from producers. th1s cxercisc and. th~t. Tbere ls on1y one questionable feature of. fs the inclusion of a distr1butiúu·transport marg1n in the. adjuatment of import priees.. !ccording to the discu.sion of lbi. issue in the. previou. aection, this margin probably ought te be excluded from the calculation. tu • subsequent paper Dud1ey and Sandilands probe the conf1ict between the prlcing policy of a profit conscious marketing agency and the prices needed to minimiza th. costs of procuring wheat. 1 They shew that a profit-maximizing marketing agency wi11 in general fail to price imported commodlties bigh enough to snsure optima1 results.. The!r conc1"sion iB that lDEMA sold imported wheat at a. price low enough to drastically cut back domestic production but still high enough to yield sizeable profits from the imports replacing domestic output.. As. a reBult 1.4 mil1ion tons of wheat were imported wh1ch could have beeo produced by domeatic aourees at lcwer opportunity costo. !bis pernicious and unintended. 1Leonard Dud ley . and Roger J. Sandilands, "The Side-Effects of Foreign Aid: The Cs.e of PL 480 Wheat in Colombia. u Nat10nal planning Department, Bogota, September 1972.. - 28 -.
(31) - 29 -. byproduct of PL 480 imports msde the value of this component of foreign econamic a1d bareiy pos1tive. In the remainder of thl. section, an attempt ls made to a •• ess the effieieney implications of price supports uSing a slightly different approach suggested by Johnson and Krueger. 1 Their framework hinges on the eoneept of the dome.tic reaource cost (ORe) of saving a unit of foreign exchange through import substltutlon versus the DRC of earning a unlt of exchange via more exporta.. An economy has. achieved aa effieient allocation of resources when the cost 18 the same for eaeh. alternative method of obtaining a unit of foreign exchange.. With a shadow rate. of foreign exchange this condition implies that no foreign exehange generating activity would have a ORe ratio in excess of unity.. Inefficiency then is defined. by the extent of the disperaton in ORC's for different ectivities contributing to the supply of foreign exchange. If the following conventional, but somewhat restrictive, set of assumptions is made the efficiency loss attributable to price supports can be measured &ccording to the formula P •. P. f (d. - Pf. P )i V where Pd 1. the prlce (cost) of do1 d mestic crop output, Pf is the import price adjusted by the extent of overvaluation (30 per cent) and Vi 1& the value of domestic crop output at domestlc prices.. Por. this measure to have some validity it is nece.ssry to assume that private factor costs adequately reflect opportunity costs, international terma of trade are fixed, costs of production are independent of output levels. eaeh crop employs the s&me. amount of direct and indirect imported input s , and that hame production would be. ~. Johnson, urhe Cost of Protection and the Scientific T.ariff," Journal of Political Economy, August 1960, pp. 327-45; A. Krueger, "Some Economic Costa of Exchange Control: The Turkish Csse," Journal of Pallticai Ecanomy, October 1966, pp. 466-80. DRe is defined as the ratio of vaiue-added per unit of output at domesCic opportunity costs plus the accounting valu. of nontraded input s to the difference between foreign exchange earned (or saved) and the amount of foreign exchange. used...
(32) - 30 -. entirely replaced by imports if P exceeded Pf' d. If these assumptions are met. tbe formula far P corresponda to Johnson's concept ef productlon cost In whlch the siZe of P measures the value of domestic resources at domestic prices whlch. could be extracted from tbe economy tbrougb resource rea11ocation and trade witbout affectlng final consumption of al1 goods and services.. Tbis measure of ex-. tractable surplus would be zero if every domest!c crop price equal1ed tbe adjusted import price.. As a m_asure of welfare loss it understates tbe trua cost. of prlce 8upports since lt ignores costs resulting from substitution in consump· tlou.. However, this omisslon may be counterbalanced by the presence of rent. elements In domestic costs and, if this were the case, P would provide a measure. of ebe total and not just the production cost of price supports. US1ng the dat& on uses af income in T&b16 2 and the perCenlúgé pric~ differ-. ences in Table 4 for tb. excess of domestic oVer adjusted world prices the pro~action. or about. cost of Colombian price supports is estimated to be 74,8l2 thousand pesos 4.85~. of the total value of output for wheat, soybeans and corno. tbese three crops had domestic prices in excess of adjustedAorld prices.. Only !he. domestic priee. of rice and barley equalled adjusted world price. while the dome.tic price of beans fell sbort of the adjusted world price.. lt seems to be a. safe conclusion on the basi. of thi ••omewhat crude calculation that the efficien:y cost of th. price Bupport program 1n Colombia i. not high. 5.. Conclusions. The main {indings of this study are twofold.. First, the operation of Col-. ombia's prlce support program appears to have exacerbatcd the inequality af income. distribution in that country.. The costs of the program have been borne by low.
(33) , - 31 income earners as a group while most of the banaflta have been obtained by h1¡har income groups.. Second, the atructure of relative pricea generated by th. price. support program imposes an efftciency co.t on the economy that resulta iroa ao inappropriate allocation of the eeonomy's resources.. However, both the .tc8 ot. the 1ncome redistribution effect aod the aize of the efficiency coat are 1ikely to be small in relatlve terms. In velghlng che de.irability of the present price support program it should be recognized that some indirect effects of the program have been neslected. These effects would need some consideratlon for a complete evaluation of the programo. In the likely event that th. bonefits of price supports are capitalized. into land values,aigner land values, by adding tO the wealth of large landownera, may make it e&s!er for this grcup to ga1n eccese to. r~t1on~~ crE~1t. Same time savings incentives for thls group are d¡minished.. wt.l1ú at th.. Higher land prlcee. al.o reduce the purchasing power of the budget for the land reform ageney lNCOIA and make it more difficult for that organization to redistribute land to amaller farmers.. Horeover, the windfall 10.s of wealth that would reault from termlnatlna. the program may hurt those who pald the capitalized land price and ral •• complaint. of capricious income redistribution.. Another indirect effect i. the redlltrlbution. of lncome amollg agricultural producer. arising from the poBit1on of cereal groven as input suppl1ers to the l1vestoek s.ctor (eattle, pork, poultry and eggl).. Be-. cause of this input-output linkage there ls little doubt that higher support prieea would harm livestock producer. by raising input co.ts. Alternative ways of me.suring equity mlght give a somewhat dlfferent plcture of the distributive effects oí priee supports.. For example, if producer. who re-. ceive price .upports are located in only a few are as reglonal income dlaparity. ~y.
(34) - 32 be locreased.. Moreover, dlsmantllng the aystem of price supports ahould reduce. average farm inceme and, as this average ia below that for the. ~hole. economy,. overa11 lnceme diatribution on the aources aide could woraen as the distribution of farm incomes Lmproved.. Nonetheless, on the fairly crude method. employed in. thi. study the disappearance of the price support program appears to offer the chance of simultaneoua improvement in both the level of total output and ita distribution..
(35) I ¡. ¡. PIlOGIIAM OF DEVELOPHJ:NT STUDIES. DlscuBsion papera No. 23. "Disguised Unemployment in .. Subsistence Economy" (1972) .............. .. No. 24. nA Proposal for Research - n 'D1stribuUon of Gdns, Wealtb snd lneome from Economic aud poHUcal Development'" (1972) .......... James W. Land. No. 25. "Optimal Wage and Education Policies with International Higration". • ••••••••••••••••••••••••••••••••••••••••••• Jose Haml1ton. I. I I ! ,I. Gondl~. Silva. (1972) •••••••••••••••••••••••••••••• R. Albert Berry and Ronald Sallgo No. 26. "Harketing and Eeonomie Development: A Sra.iUan Case Study, 1930-70" (1972) •••••• Gordon lit Sm1th t. ••••••• t. ••••••••• t. ••• t. • • • • • • • • • • • • • • • • tI •••. NO. 27. "lndigeni8ation of lndustry and Frogress of the Seeond Nigerian Nat10nal Development Plan" (1972) •••••••••••••••••• Gaston V. Rtmlinger. No. 28. "The Distribution lncomes and the Short-Run Burden of Taxe_ in Turkey, 1968" (1972) ............. Harian Krzy.aniak and SUleyman Ozmueur. No. 29. "The Proper Use of lndirect Taxation in Latin America: The Practice of Economic Marksmanshl p" (1972)~ •••••••••••••••••• Charles E. McLure. Jr.. No. 30. "I)istributianal E:¡uity, lnflation, and Efflc1eney in th. Braz1J.ian Fluetuating Exchange Rate System" (1972) ••••••••••••• Danald L. Huddle. No. 31. "A Diagrammatie Exposition of General Equllibr ium Tax and Expenditure Incidence Analysis wlth One Immoblle Flictor"(1972) Charlea E. HeLur. Jr.. No. 32. "Social and Economic Condltiono and Pol1tiea1 Violenee" (1972) ........ • •••••••••••••••••••••••••••••• Fred R. von der Mehaen with KLm Q. Kl11. No. 33. "Ineame Diatrlbution. Effleiency and the Experience of Colombian Farm Hechanizatlon" (1972) •••• , ••••••••••••••••••••••••••••• Wayne R. Thlrak. No. 34. "Eaae of Factor Subat1tution in Agrieulture" (1972) .... Wayne R. Thirak. No. 35. "The ContributLon of Traditional and Small Scale Culture Goods in International Trade and in Employment" (1972)Yhi-Min He and I)onald Huddle. No. 36. "The Distrlbution of Incame and Tax lncidence in Panama, 1969" (1972) • ................................................. Charles E. McLure. Jr.. No. 37. "General Equil1brium lnc idence AtlA1ysia: Tha Harberger Hodel after Ten "lears ll (1972) ................................. Charles E. McLure. Jr.. No. 38. "00 the General Equllibrium Analys1s of Tax Ineidenee" (1973) ......... . • •.•••••••••••..•••.•••.•••..•.• J. Gregory Ba11entine and lbrahim Eria. No. 39. "rhe Impaet of Demand on Labor Absorption and the Distributlon of Earninga: The Ca_e of Brazil" (1973)5amuel A. Horley & Jeffrey G. Will1.... on. No. 40. "A Note an Z Goods, Marketed Surplua and the Labor lntenaity of Small Farm Agriculture" (1973) .................................... Wayne R. ThlrBk. No. 41. "The Incidence of Colambian Taxes, 1970" (1973) .. Charl._ E. HcLure, Jr.. No. 42. ''What to Do Abollt Fore1gn Direet lnv.atment: A Host Country Perspect1ve tl (1973) ..... , .................................... Samuel A. Morley. No. 43. "lncome Distr1bution Con_equeneea of Agricultural Price Supports in Colombia" (1973) •••••••••••••••• , .••••••••••••••.••••• , Wayne R. Th1rsk D1scussion Papero are available upon request to individual Beholara and researchers and librarie. of educational institutions.. l. ~:. O".
(36)
Figure

Documento similar