Assessing changes in household access to financial services in Mexico: an analysis of the BANSEFI/SAGARPA panel survey 2004 2007
39
0
0
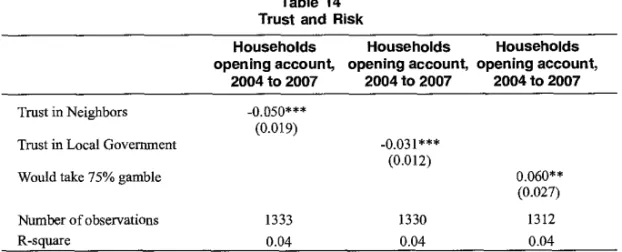
Texto completo
(2)
(3) WELL-BEING AND SOCIAL POLICY VOL 5, NUM. 1, pp. 75-111. ASSESSING CHANGES IN HOUSEHOLD ACCESS TO FINANCIAL SERVICES IN MEXICO: AN ANALYSIS OF THE BANSEFI / SAGARPA PANEL SURVEY 2004-2007 Christopher Woodruff* University of California, San Diego [email protected]. José Martínez** University of North Texas Jose.Matinez@untedu. Abstract n March 2004, BANSEFI and SAGARPA began a project to examine the impact on households of the Program to Strengthen the Popular Credit and Savings Sector (Programa de Fortalecimiento del Sector de Ahorro y Crédito Popular), which was designed to help non-bank financial intermediaries to abide by the Ley de Ahorro y Crédito Popular (LACP), passed by the Mexican Congress in 2001. During the spring of 2004, 5,768 households were surveyed. The survey was repeated each of the next three years. Attrition over the survey period was substantial, but in 2007, 3,723 of the households surveyed in 2004 were interviewed for the last time. This report analyzes the household survey data in an attempt to shed light on the impact of the Program. The principal findings of the report are:. I. 1) The penetration' of popular sector financial institutions increased markedly between 2004 and 2007. A conservative estimate shows that penetration among households in the surveyed communities increased by 20 percentage points (from 33 percent to 53 percent) over the three years. 2) Among survey households which were unbanked in 2004, households with higher expenditure levels in 2004, and households whose heads have higher levels of formal schooling, were more likely to have opened an account before 2007. This pattern is consistent with the tendencies in the baseline data. That is, in 2004, households with accounts were wealthier (measured by both expenditure levels and ownership of durable assets) and had higher education levels.. • Associate Professor, University of California, San Diego. Professor, University of North Texas. ' Measured as the opening of new bank accounts. 2 The term "banked" refers to the existence of at least one household account. -Assistant. 75.
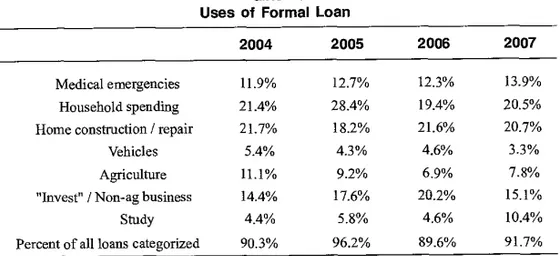
(4) ASSESSING CHANGES IN HOUSEHOLD ACCESS TO FINANCIAL SERVICES IN MEXICO: AN ANALYSIS OF THE GANSER / SAGARPA PANEL SURVEY 2004-2007. 3) There is substantial attrition in the sample, and the attrition is clearly not random. Households with higher income and education levels are more likely to be dropped from the sample. However, when we take the characteristics of the households dropping from the sample in their entirety, we do not find that attrition has a significant impact on the estimated penetration rates. 4) We find that respondents expressing more confidence in neighbors, other Mexicans and various levels of government are more likely to have opened an account between 2004 and 2007. This suggests that i f the regulatory scheme of the LACP was successful in increasing the confidence in popular sector financial institutions, this was likely one channel leading to higher penetration rates. We do not find any association between the measures of risk taking in the survey and opening accounts, though risk appears to have been measured with a significant amount of noise in the survey. 5) There is a substantial amount of variante in the policies ofpopular sector financial institutions regarding membership, savings accounts and loans. Institutions also vary in the degree they report serving women, poor households, agricultural communities, and so forth. But we find only weak (and statistically insignificant) evidente that the characteristics of institutions along either of these dimensions is associated with how quickly the branches included in the survey expanded. 6) We find no relationship between opening an account during the 2004-2007 period and starting either an agricultural or non-agricultural business over the same period. We also find no substitution between use of the popular sector financial institutions and informal savings mechanisms. Indeed, we find both those with an account in 2004 and those opening an account before 2007 are more likely to participate in at least one Tanda. In rural areas, there is no relationship between use of formal financial institutions and ownership of livestock, another common way of holding assets. 7) The percentage of households in the sample taking a new loan in the 12 months prior to the survey falls between 2004 and 2006, and rebounds only partially in 2007. Three quarters of the loans taken by panel survey households have terms of one year or less. Households most commonly report using the loans for regular expenditures and housing construction or repair, but a significant share of the loans were used for investment purposes. According to household responses, about a quarter of the loans were invested in agricultural or nonagricultural businesses. The BANSEFI /SAGARPA panel data set representa one of the richest and most detailed data sets on use of financial services by households in Mexico. This report summarizes some of the patterns in the data, but we are certain that analysts in government, academia, and the financial services sector itself Will find the data useful for further analysis. — Key words: Microcredits, Mexico. JEL classification: G21, 012.. 76.
(5) WELL-BEING AND SOCIAL POLICY VOL 5, NUM, 1, pp. 75-111. 1. Description of the Surveys and Data. T he main survey on which the analysis in this report is based is the BANSEFI / SAGARPA panel 1 survey of households. The survey was conducted annually between 2004 and 2007. The baseline survey was conducted between March 30 and July 2, 2004. By design, the baseline sample was evenly split between households which were clients of popular sector financial institutions and households which had not had an account in any financial institution at least since 1999. The client sample was selected in two steps.3 In the first step, branches of popular sector financial institutions were selected randomly with probability proportional to their size (measured by number of accounts). For each selected branch, 30 clients were selected at random from the registry of clients. Then, an equal number of households from the same or a nearby community who were not clients of any financial institution were selected by mean of a screening survey. The screen eliminated households where any member had had an active bank account within the 5 years prior to the survey (that is, in 1999 or after). Data on the number of households surveyed in each round is shown on Table 1, broken down by whether the household had an account in 2004 and by subsample (described below). The 2004 sample included 5,768 households, 2,975 having accounts in popular sector financial institutions and 2,793 having no accounts in any financial institution. In May-July 2005, an attempt was made to resurvey all of the households included in the 2004 survey. Of the original 5,768 households, 4,676 were resurveyed in 2005, implying an attrition rate of 17.6 percent. Some households were added to the survey in the second round. Ninety of the additional households were clients of microfinance institutions (Promujer, CAME and Financiera Compartamos), and 90 were clients of Banco Azteca. These 180 households were resurveyed with some attrition) in 2006 and 2007. In April and May 2006, the panel households were surveyed for a third time. Of the 4,676 households surveyed in both 2004 and 2005, 3,914 were resurveyed in 2006. The implied attrition rate of 16.3 percent overstates the true attrition somewhat, because PATMIR did not attempt to reinterview all of its 2005 households in 2006. Budget limitations reduced PATMIR's target sample size from 1,218 to 738 in 2006.4 In the final survey round, conducted between September 1 and November 20, 2007, 3,723 of the original sample of households were resurveyed. The target for PATMIR households was increased for round 4 to 910 households. As a result, some households not surveyed in round 3 were surveyed in round 4. The PATMIR target of 910 households was reached before all of the baseline households had been resurveyed. Therefore, no attempt was made to resurvey 153 of the PATMIR households surveyed in the first two rounds.. All four waves of the survey were carried out by Berumen, which produced methodological reports following each wave. The description of the sample and survey methods are based on information from Berumen's methodological reports. ° This target was exceeded slightly, so that the total PATMIR sample in 2006 was 761 households. We don't have information on the true attrition from this sample for the year, because we don't know how many households the survey firm attempted to survey in order to reach the 761 completed surveys. 3. 77.
(6) ASSESSING CHANCES IN HOUSEHOLO ACCESS TO FINANCIAL SERVICES IN MEXICO: AN ANALYSIS OF THE BANSER / SAGARPA PANEL SURVEY 2004-2007. In the analysis for this report, we focus primarily on the balanced panel of 3,723 households surveyed in rounds 1 and 4. After eliminating households with key missing data, the balanced panel is 3,473 households. Of these, 268 are PATMIR households which were not surveyed in the 2006 round. The survey instrument used in each of the four waves was modified in only minor ways across the four rounds on the survey. For the baseline survey, questions related to the use of financial institutions—e.g., savings balances, frequency of use, etc.—were asked only of households with accounts. In tater rounds, the survey included a screening question asking all households if they had opened or closed an account within the previous year. In the fourth round, a survey module measuring willingness to take risks and confidence in people and institutions was added to the survey. This module was administered to the households remaining in the panel, and to an additional 1000 households. In general, the data across all four waves appear to have been gathered in a consistent manner allowing for good comparability across waves. One exception to this is that the distribution of savings account balances changes markedly between wave 3 and wave 4. We have not been able to identify any change in the questions across the rounds which might have caused this shift. But more than 75% of households with an account in 2007 either fail to respond to the question on savings account balances or say they have a zero balance on the account, compared with less than 25% in each of the other three rounds. Therefore, we have chosen not to use these data. Additionally, the questions measuring risk aversion appear not to have worked well, as we discuss in more detail Tater in the report.. 1.1 Sample sizes and attrition The sample was designed to provide information on several distinct segments of the popular financial sector, and to provide representation by size of institution and by geographic region. The distribution of households by type of institution is shown on Table 1. The table shows both the size of the initial sample, and the size of the resurveyed samples in each of the four years. For each year, households are grouped according to whether they were a client of an SACP in 2004 or not. Of course, some households which were not clients in 2004 opened accounts after the baseline survey. We discuss these movements in Section 2 of the report. For the purposes of this section, those households remain in the "no account" group. The sample is divided hito seven groups on the table. The largest group is clients of SACPs not associated with PATMIR and not including BANSEFI. We refer to this group in the report as the "Caja sample." Just over half of the baseline sample (3,076 out of 5,768 households) are clients in the Caja sample, or the matched set of non-client households located in communities which are part of the Caja sample. Clients ofPATMIR (and unbanked households in the same communities) are the second largest subsample, with 1,496 households in the baseline sample. The third group of regular clients is 319 households are clients of BANSEFI branches, or are unbanked households located in those same communities.. 78.
(7) Table 1 Number of Households Surveyed by Round and SubSample Round 1 No Account Acc ount Total. SACP. tD. Interviews Attrited Dropped. 1595. SACP Interviews (Oportunidades Attrited - Procampo) Dropped. 210. 155. 365. BANSEFI. Interviews Attrited Dropped. 153. 166. BANSEFI Interviews (Oportunidades Attrited - Procampo) Dropped. 210. Interviews Attrited Dropped. 60. Crédito ala. palabra. 1481 3076. Round 2 Account. 1314 281. Round 3. No Total Account. No Account Acc ount Total. 1170 2484 311 592. 1145 169. 175 35. 108 47. 283 82. 173 2. 105 3. 319. 128 25. 137 29. 265 54. 128 0. 182. 392. 184 26. 139 43. 323 69. 60. 120. 58 2. 45 15. 90. Round 4. 1036 2181 134 303. Account. Attrition Rate. No Total Account. Account. No Total Account. 987 158. 941 95. 1928 253. 38.1. 36.5. 37.3. 278 5. 173 0. 101 4. 274 4. 17.6. 34.8. 24.9. 128 9. 256 9. 117 11. 106 22. 223 33. 23.5. 36.1. 30.1. 151 33. 117 22. 268 55. 120 31. 110 7. 230 38. 42.9. 39.6. 41.3. 103 17. 55 3. 37 8. 92 11. 53 2. 33 4. 86 6. 11.7. 45.0. 28.3. 90. 78 12. 78 12. 68 10. 68 10. 24.4. Banco Azteca. Interviews Attrited Dropped. SAGARPA. Interviews Attrited Dropped. 747. 749. 1496. 605 142. 613 136. 1218 278. 436 -53 222. 325 30 258. 761 -23 480. 449 107. 464 114. 913 221". 30.4. 37.6. 34.3. Total. Interviews Attrited Dropped. 2975 0 O. 2793 5768 0 0 0 0. 2554 511 0. 2212 4766 581 1092 0 O. 2166 166 222. 1748 3914 206 372 258 480. 1967 319 0. 1755 3722 246 565 0 0. 31.5. 37.1. 34.3. <C13. Note:" Account" and "No Account" indicates status at the time of the baseline survey in 2004. 1/ Includes 154 households for which no attempt to resurvey was made because the 2007 target sample size had been reached.. ern r. .10G) z> c el cn -...o - c-1 1 rZ. -4-o 9' 0. -,ñ. ...< -.K.
(8) ASSESSING CHANGES IN HOUSEHOLO ACCESS TO FINANCIAL SERVICES IN MEXICO: AN ANALYSIS OF THE SANSER / SAGARP.4 PANEL SURVEY 2004-2007. The sample also includes households which participate in government social programs, including PROCAMPO, OPORTUNIDADES, and Crédito a la Palabra. Many of these households were brought into the popular sector financial system when accounts were opened for by government agencies. These accounts allowed the agencies to make regular transfers to the families electronically. Some of these accounts were opened (or were to be opened) in Cajas (365 households in the PROCAMPO or OPORTUNIDADES programs), and some were opened in BANSEFI branches (392 households in the PROCAMPO or OPORTUNIDADES programs). There were 120 households in the Crédito a la Palabra program, half served by BANSEFI and half by Cajas. (We do not separate the Crédito a la Palabra sample by institution in the sample, because of the small size of this subsample.) The seventh and final group shown on the table is the clients of Banco Azteca, 90 of which were added in 2005. As indicated on Table 1, the original sample was reduced significantly over the four years by attrition and by the intentional dropping of households.5 Of the 5768 households surveyed in the first round, only 3,473 were surveyed in each of the four rounds. The overall attrition rate measured from round 1 to round 4 is just over 34 percent. The rate is somewhat higher for households without an account in 2004 (37.1 percent) than for those with an account in 2004 (31.5 percent). Among the subsamples of households not in government social programs, attrition was highest in the Caja sample (37.3 percent) and lowest in the BANSEFI sample (30.1 percent). Attrition in the PATMIR sample was 34.3 percent. In the BANSEFI subsample, the difference in attrition rates for those with and without accounts in 2004 was especially large (23.5 percent for those with accounts and 36.1 percent for those without). Given the high attrition rate, we should ask if households dropped from the survey differ systematically from those that remained in the sample In other words: Can we call the attrition random? Table 2 shows a few of the characteristics of the households remaining in and dropping out of the sample. The data indicate that the households dropping out of the sample do differ significantly from those remaining in the sample. The attriting households are more urban, have heads with higher education levels, are less likely to have a head who speaks an indigenous language, are less likely to receive remittances. Those dropping out of the survey also tend to have lower home- and land-ownership rates, and to be less likely to own an agricultural and nonagricultural business. Most of these are consistent with a general finding that less mobile households are more likely to remain in the sample. Rural households are less likely to move than urban households, those who own their home, or own a business, are also less likely to move. On the other hand, urban households are more mobile than rural households. The pattem of attrition is not unexpected because more mobile households are likely to be more difficult for the survey firrn to relocate.. In the case of PATMIR, some households were dropped in round 3 but then re-surveyed in round 4. These households were not considered when computing the attrition rates.. 80.
(9) WELL-BEING AND SOCIAL POLICY VOL 5, NUM. 1, pp. 75-111. All of the differences shown in Table 2 are significant at the 1 percent level except for receipt of remittances, which is significant at the 5 percent level. Though Table 2 shows the data for the entire sample, the patterns across subsamples are similar. As we discuss in Section 2, we do not find that attrition has a large impact on the estimated penetration of financial services in the sample. The households attriting from the sample have characteristics which give them a predicted probability of opening an account which is similar to the households remaining in the sample during the three years of the panel.. Table 2 Characteritics of Households Attriting from Sample Non-Attrited 3205. Attrited 2563. Percentage Rural. 51%. 40%. Indigenous Language. 28%. 18%. Number of Observations. Schooling of head (max). 6.0. 7.6. Receives Remittances. 4%. 3%. Own Agricultural Business. 29%. 18%. Own non-ag Business. 32%. 29%. 1.2 Characteristics of households by subsample How much do the characteristics of households differ by subsample? Table 3 reports mean or median values for individual and household variables by subsample. We show the age and education levels of the household heads and the percentage of households in which both spouses are present. We also show the log monthly expenditures and the log value of household durable goods assets. Because the main purpose in showing these data is to provide characteristics of the types of households in the communities served by popular sector financial institutions, we report first round data based on the entire sample of 5,768 households. As the table indicates, two-thirds of the Caja and BANSEFI samples are located in urban areas, while less than one-third of the PATMIR sample households are in urban areas. Given differences in income and education levels in urban and rural Mexico, this difference by itself would lead us to expect the PATMIR sample households to have lower schooling and income levels. In fact, that is the case. We report the highest level of schooling attainment of either the household head or spouse. By this measure, the average PATMIR household has 6.4 years of schooling, compared with 7.2 in the Caja sample and 7.3 in the BANSEFI sample. Schooling levels are even lower among households participating in govemment social programs: 5.0 years for households in the Procampo / Oportunidades samples, and 3.9 for the Crédito a la Palabra. 81.
(10) ASSESSING CHANGES IN HOUSEHOLD ACCESS TO FINANCIAL SERVICES IN MEXICO: AN ANALYSIS OF THE GANSER / SAGARPA PANEL SURVEY 2004-2007. sample The pattern of monthly household expenditurest and durable assets7 is similar. We use monthly expenditures as an indication of household income.8 The measure excludes expenditures on durable goods and other purchases that are likely to occur less frequently. We multiply this by 12 to obtain an annual expenditure levet. The average of the log of annual expenditures by subsample is shown on Table 3. The PATMIR sample households have average expenditure levels about 40 Table 3 Summary Data by Type of Institution Crédito a la Procampo / Cajas PATMIR BANSEFI Oportunidades Palabra. 65.1%. 29.9%. 66.7%. 57.4%. 0.0%. 45.2. 45.4. 44.9. 46.6. 53.2. Education of Heads (max). 7.2. 6.4. 7.3. 5.0. 3.9. Both heads present?. 77.8%. 78.5%. 74.4%. 79.2%. 70.0%. Receives remittances. 2.6%. 5.5%. 5.2%. 5.5%. 1.7%. Owns Agricultural business. 16.2%. 28.6%. 16.7%. 42.5%. 74.2%. Owns Non-ag business. 33.2%. 38.7%. 26.8%. 22.3%. 24.2%. House has piped water. 93.4%. 79.6%. 90.7%. 86.5%. 87.5%. Log value of household durables. 8.7. 8.1. 8.3. 7.9. 8.7. Log monthly expenditures * 12. 10.5. 10.1. 10.5. 10.2. 10.2. Sample size. 3142. 1496. 246. 764. 120. % Urban Age of Heads (average). The survey asks for expenditures on groceries and other goods purchased regularly by the household over any period of time chosen by the household (daily, weekly, or monthly), and for expenditures on services such as telephone, electricity, water, etc., again over any period chosen by the household. We use these data to calculate monthly expenditures on goods and services which are typically purchased at least monthly. The expenditures do not include rent or imputed rent where the home is owned by household members. The survey also asks for expenditures on items like clothing and durable goods which are purchased less frequently. Nonresponse rates are higher for these items, so we do not use them in out measure of expenditures. 7 The survey asks whether the household owns any of 11 household durable goods, including a washing machine, a television, a motorcycle, and an automobile. Households reporting ownership are then asked about the replacement cosi of the item in question. The non-response rates on replacement costs are high. We replace missing values with the median response in the asset category given by responding households residing the same state. We use consumption data rather than income data because income tends to vary much more than consumption, especially in rural ateas. Given the more stable monthly pattern, consumption provides a more accurate picture of the economic condition of the household.. 6. 82.
(11) WELL-BEING AND SOCIAL POLICY VOL 5, NUM. 1, pp. 75-111. log points lower than either the Caja or BANSEFI sample households. The expenditures of households participating in government social program are slightly higher than the PATMIR sample households, but again, are well below the Caja or BANSEFI sample households. The pattern is generally similar with the estimated replacement value of durable goods owned by the household, though in the case of durable goods, households in the Crédito a la Palabra sample have somewhat higher average reported asset levels than do households in the BANSEFI sample. Aside from the government program participants, the PATMIR households are most likely to own agricultura! and non-agricultura) businesses. BANSEFI has the lower percentage of households who are business owners. Recall that the table shows the data for both account holders and nonaccount holders in the baseline survey. Among account holders, the percentage of households with agricultura! and non-agricultural businesses is even larger in all of the subsamples. Table 4 shows the same information for institutions with high and low quality ratings9 (measured in 2002),b0 households in the north, central and southern regions of Mexico, and Table 4 Summary Data by Type of institution Households in Communities Served by Cajas Only Aprobado. % Urban. 84.2%. B. C/D. Very North Central South Small 1/. 63.1% 61.3% 83.6% 80.7%. 35.0% 54.4%. Small Medium Large 1/ 1/ 1/. 68.8%. 65.7%. 77.3%. Age of Heads (average). 0.5. 0.4. 45.1. 47.0. 45.4. 44.1. 46.9. 44.7. 44.8. 43.5. Education of Heads (max). 7.4. 7.4. 7.0. 8.2. 7.3. 6.7. 6.9. 7.3. 7.4. 7.6. 77.9% 78.9%. 76.8%. 77.8%. 77.5%. Both heads present?. 78.1%. 75.6% 78.9% 76.2% 78.0%. Receives remittances. 2.3%. 2.1%. 2.7% 2.1%. 1.0%. 4.6%. 3.2%. 3.1%. 1.2%. 2.4%. Owns Agricultural business. 8.6%. 8.8% 20.6% 9.2%. 9.0%. 29.1% 25.9%. 14.8%. 12.6%. 5.5%. Owns Non-ag business. 31.3%. 34.9% 32.9% 28.3% 30.9%. 38.4% 35.8%. 32.1%. 31.9%. 32.2%. House has piped water Log value of household durables. 95.3%. 94.4% 92.7% 95.0% 95.0%. 90.4% 92.9%. 92.7%. 94.7%. 93.9%. 8.8. 8.7. 8.7. 9.2. 8.9. 8.2. 8.7. 8.6. 8.8. 8.8. log monthly expenditures. 10.6. 10.5. 10.5. 10.7. 10.6. 10.2. 10.4. 10.5. 10.6. 10.6. Sample size. 789. 702. 1216. 528. 1448. 1110. 954. 1002. 676. 510. Note: 1/Size measured by the number of savings accounts in the institution. Categories are: 1) Very Samll, <1500; 2) Small, between 1501 and 10,000; 3) Medium, between 10,001 and 100,000; and 4) Large, > 100,000 accounts.. 9 Quality ratings evaluate the Caja's financial performance (liability, liquidity, capital, etc.) and institutional organization (intemal control and govemance). A letter is assigned to each Caja according to its evaluation results, ranging from Aprobada (Authorized) to B+, B, C or D (the worst possible rating). The 2002 quality measures are not available for all of the institutions represented in the household sample. More recent data (December 2006) are available. We use these later in the analysis of a separate survey administered to the financial institutions themselves.. 83.
(12) ASSESSING CHANGES IN HOUSEHOLD ACCESS TO FINANCIAL SERVICES IN MEXICO: AN ANALYSIS OF THE BANSEFI / SAGARPA PANEL SURVEY 2004-2007. households in communities served by institutions are various sizes. The sample on Table 4 is limited to households located in communities served by Cajas. The PATMIR sample is almost exclusively in the southern region, and all of the PATMIR branches in the sample were rated A (aprobado, or approved) or B at the time of the baseline survey. The Caja sample has the best representation across the subgroups used in Table 4. There are surprisingly few differences in the households served by high- and low-rated institutions. The higher percentage of households with agricultural businesses served by institutions with lower financial ratings suggests that perhaps rural institutions have lower ratings, on average, than urban institutions. On the other hand, the differences by region are quite marked." A much higher percentage of the surveys in the southern region are in rural areas. (Recall that the data on this table exclude the PATMIR and BANSEFI samples). Consistent with this, almost a third of the households in the south have agricultural businesses, compared with lens than 10 percent of households in either the northern or the central regions. Education levels are highest in the north, but higher in the center than in the south. And both household durable asset ownership and expenditures on goods purchased at least monthly are lower in the south than in either of the other two regions. With regard to the size of the institutions, the smallest institutions serve more rural, agricultural households. Education levels, expenditures and durable asset ownership are all somewhat lower among households in communities served by the smallest institutions.. 1.3 2007 Module on risk and confidence in institutions In the 2007 round of the survey, a module measuring attitudes toward risk and confidence in institutions was added to the survey. In each household, the survey was administered to the same person who answered the household survey. Risk attitudes were obtained from a set of seven hypothetical lotteries. In three of the scenarios, the respondent was asked whether s(he) would prefer to receive 500 pesos for certain, or an uncertain payment determined by drawing a immber between one and twenty. For example, in one question, the risky option paid nothing if the number 1 was drawn, 50 pesos if numbers between 2 and 16 were drawn, and 1,000 pesos if numbers between 17 and 20 were drawn. In another, the risky option paid zero if the number drawn was between 1 and 4, and 1,000 pesos if the number drawn was between 5 and 20. The expected value of the first gamble if 237.5 pesos, while the expected value of the second gamble is 800 pesos. Nevertheless, a significant minority of the respondents (29 percent) chose the risky option for the first question, and the safe option for the second. These responses suggest that at least some part of the sample may not have fully understood the options presented to them.. " The north includes the states of: Aguascalientes, Baja California, Baja California Sur, Chihuahua, Coahuila, Durango, Nuevo Leon, San Luis Potosi, Sinaloa, Sonora, Tamaulipas and Zacatecas. The Central region includes Colima, Distrito Federal, Estado de Mexico, Guanajuato, Hidalgo, Jalisco, Michoacan, Morelos, Nayarit and Queretaro. The south includes Campeche, Chiapas, Guerrero, Oaxaca, Puebla, Quintana Roo, Tabasco, Tlaxcala, Veracruz and Yucatan..
(13) WELL-BEING AND SOCIAL POLICY VOL 5, NUM. 1, pp. 75-111. This added module also contained two other sets of questions. The first asked respondents to suppose they had received a windfall gain of between 500 and 1250 pesos, and asked how much of the gain they would put in the bank, how much they would spend on household consumption, invest in animals or equipment, etc. For each of the four amounts, respondents said they would place about 20 percent of the windfall in the bank. Not surprisingly, those with accounts opened by 2006 indicated they would puta larger percentage of the windfall in the bank. But 15 percent of those without accounts said they would put part or all of a 500 peso windfall in the bank, and 25 percent of those without accounts said they would put part of all of a 1250 peso windfall in the bank. These responses suggest that unbanked households are willing to open accounts in at least some circumstances. The second set of questions asked respondents how much confidence they had in various groups of people (neighbors and other Mexicans) or in institutions (e.g., the press, the church, various government entities, and various financial institutions). These questions are straightforward and easily understood, and the response rates are high. There is a strong pattern in data in that respondents express decreasing confidence in each institution asked. So confidence in the press (asked fifth) is much higher than confidence in commercial banks and cajas de ahorro (asked 17'h and 18'). This may be because people do in fact have more confidence in the institutions nearer to the top of the list. But it may also represent some fatigue an answering a fairly long series of closely related questions. It does not appear that the ordering of the questions was varied in the surveys, so we are not able to separate these two possibilities. We report more on the responses to the questions included in the risk and confidence module in Section 2.3 below.. 1.4 2006 survey of institutions In 2006, a survey was administered to the institutions in the panel survey. The survey was administered to a total of 134 institutions, and included questions on the organization of the institution, the characteristics of key personnel (age, gender, education level), policies for opening savings accounts and making loans (including fees, use of guarantors, and the like), the characteristics of clients, and the growth of the branch over the preceding five years according the various measures. A statistical appendix asked for detailed balance sheet data. Only about half of the surveyed institutions returned the statistical appendix, and none were completed entirely. (For this reason, we do not use the data from the statistical appendix in this report). Not all of the institutions with clients in the baseline survey agreed to answer the institutional survey. Those declining to participate were replaced with other institution, where possible in the same communities. Similarly, the branches of BANSEFI with clients in the panel survey were not included in the survey because the policies governing accounts in the branches are centralized and cannot be changed at the discretion of the individual branches. These branches were replaced with other cajas in the same geographic arcas. In the final sample, then, all of the institutions surveyed are located in or near the communities surveyed, but not all have clients in the survey.. 85.
(14) ASSESSING CHANGES IN HOUSEHOLD ACCESS TO FINANCIAL SERVICES IN MEXICO: AN ANALYSIS OF THE BANSEFI/ SAGARPA PANEL SURVEY 2004-2007. Of the 134 branches targeted for the survey, only 107 completed the majority of the survey. 82 of these institutions correspond to institutions in the household survey. The other 25 are substitutes for BANSEF/branches and for other institutions who could not be interviewed. Keeping in mind the small size of the sample, the following section presents some results based on the responses from the institutional survey. Initially, we use data from 107 institutions that responded to the survey.12 We limit the sample to the 82 institutions which can be matched to the household panel survey when we look at data on penetration rates later in the section. Table 5 presents some of the characteristics of the financial institutions according to their size. Size is measured by the number of savings accounts for the entire institution, regardless of the number in the particular branch which responded to the survey. Very small institutions have 1,500 or fewer accounts; small institutions 1,501 to 10,000 accounts; medium institutions 10,001 to 100,000 accounts; and large institutions more than 100,000 accounts. There are some patterns in characteristics by size of institution. On average, institutions with more than 100,000 accounts report having higher profits (total earnings minus total expenditures), while both those with fewer than 1,500 accounts and those with more than 100,000 accounts charge lower fees for opening savings or time deposit accounts, pay higher interest rates on savings accounts, and require lower minimum initial deposits to open a savings or time deposit account. Their clients are more likely to own land, work in agriculture, and have had a member of the household migrated to the U.S. Institutions in the medium and large categories (that is, those with more than 10,000 accounts) are more likely to process remittances from abroad. Also, institutions in the largest category have the lowest loans-to-savings ratio and the lowest default rates on loans. Institutions with fewer than 10,000 accounts, on the other hand, tend to have more clients they classify as being poor and more clients who are non-agricultural business owners. The very smallest institutions, those with less than 1,500 accounts, are more likely to be in rural arcas and be the only financial institution in their community. Between 2004 and 2007, institutions of all sizes have increased their penetration rates among households in the panel survey sample. However, the cate of increase is much larger among the smallest institutions (16.7 percentage points), and declines monotonically with the size of the institution. This suggests that the smallest institutions may have benefitted most from the changes brought about by the LACP, or simply that they are doing a better job of outreach. We speculate that the LACP might have had a greater impact on the smallest institutions for two reasons. First, the increase in the regulatory structure generated by the LACP may have led to an increase in confidence, particularly in the smallest institutions. Larger institutions, particularly those operating a large number of branches over a large geographic area, are more likely to have had a sophisticated, electronic, accounting system even before the LACP was passed. The smallest institutions generally kept only paper account records, which might have been seen as easier to manipulate. Second, the accounting requirements might have forced the smallest institutions to improve their information systems, allowing them to handle a more rapid growth in accounts. Larger institutions, often operating with multiple branches, might have already had more sophisticated information systems. The pattems in the data are qualitatively identical if the sample is lim ted to the 82 institutions which can be matched to the household panel survey.. 86.
(15) WELL-BEING AND SOCIAL POLICY VOL 5, NUM. 1, pp. 75-111. Table 5 Summary of Institutional Survey Data Size of Institution. Very Small. Observations. Small Medium. Large. 13. 46. 40. Average Size. 840. 4,671. 29,736. 474,434. Savings Account Opening Fee (Pesos) u. 304. 534. 551. 71. Time Deposit Account Opening Fee (Pesos) I/. 493. 648. 779. 350. 63. 198. 77. 28. Minimum Initial Deposit Savings Account (Pesos) Minimum Initial Deposit Time Deposit Account (Pesos). 8. 1,225. 2,197. 2,397. 500. Interest Rate Paid Savings Account. 4%. 3%. 3%. 4%. Receives Remittances Payments (%). 23%. 41%. 78%. 50%. Change in Percentage of Households with Accounts. 16%. 10%. 8%. 9%. Interest Rate Agri-Business Loans. 33%. 28%. 28%. 24%. Interest Rate non-Agri Business Loans. 33%. 29%. 31%. 23% 23%. Interest Rate Car/Machinery Loans. 21%. 18%. 22%. Interest Rate Mortgage Loans. 30%. 22%. 23%. Percentage Poor Clients. 40%. 30%. 27%. 29%. Percentage Land Owner Clients. 67%. 70%. 63%. 76%. Percentage Agriculture Main Activity Clients. 52%. 41%. 28%. 53%. Percentage Business Owner Clients. 42%. 39%. 42%. 29%. Percentage U.S. Migrant House Member Clients. 45%. 62%. 35%. 51%. Percentage Indigenous Language Clients. 29%. 17%. 40%. 23% 9.3. Assets per Client/Member (000 Pesos). 8.2. 10.3. 7.2. Loans per Client/Member (000 Pesos). 3.9. 7.1. 4.7. 6.8. Deposits per Client/Member (000 Pesos). 5.6. 7.3. 4.7. 8. Loans to Savings Ratio. 1.3. 2.3. 1.3. 0.8. Default Rate (Default Loans / Total Loans). 12. 10.8. 9.3. 0.1. In a rural community?. 54%. 33%. 20%. 38%. Another Financial Institution in the Community?. 85%. 80%. 93%. 75%. Note: 1/Fees for opening accuonts include the quota charged to become a member. These fees may be refundable when the account is closed.. 87.
(16) ASSESSING CHANGES IN HOUSEHOLD ACCESS TO FINANCIAL SERVICES IN MEXICO: AN ANALYSIS OF THE BANSEFI / SAGARPA PANEL SURVEY 2004-2007. prior to the LACP. Alternatively, it may be that the largest institutions had already reached a much higher penetration rate in their communities at the time of the baseline survey. Unfortunately, we do not have data to differentiate between these possibilities. In the Table 6, we show the changes in penetration rates by quality of institution. The data indicates that institutions of all quality levels (measured in December 2005) increased their penetration rates between 2004 and 2007. However, the institutions rated C or D in 2005 actually expanded most rapidly between 2004 and 2007. This may reflect the fact that these institutions experienced the largest improvement in financial practices over this period, something we explore in Table 7. Those rated B in 2005 expanded most slowly. Because larger institutions tend have better quality ratings, this is in part reflected in the size pattern shown on Table 5. What both tables suggest is that smaller/lower quality institutions are growing faster than larger/higher quality institutions. Table 6 Institutions by Quality 2005 Quality Rating C/D. B. B+. 2005 Rating. 75. 23. 3,695. 3,218. 1,861. Change in Percentage with Accounts. 12%. 6%. 17%. Is there another institution in the community. 81%. 85%. 79%. 25. Observations Size. Do institutions which grow more quickly also improve their financial indicators? In the table below, we analyze whether Mercases in quality ratings are correlated with positive changes in penetration levels. The data show that institutions that improved in their quality rating between 2005 and 2008 saw an Mercase on average in their penetration rate of about 9 percent. This was the same rate of Mercase as institutions whose quality rating remained unchanged. Only five institutions had lower quality ratings in 2008 than in 2005, but interestingly, institutions with falling quality ratings experienced a drop in penetration levels between 2004 and 2007. Since the quality improvement is measured between December 2005 and September 2008, perhaps the best interpretation of this pattern is that growth which is too rapid can cause financial strains on the institutions. Table 7 Change in Quality 2005-2008 Higher Grade. Same Grade. Lower Grade. Observations. 73. 42. 5. Change in Percentage of Households with Accounts. 9%. 9%. -2%.. 88.
(17) WELL-BEING AND SOCIAL POLICY VOL 5, NUM. 1, pp. 75-111. In sum, most of the financial institutions represented in the panel survey increased their penetration levels between 2004 and 2007. Although bigger institutions have lower fees and minimum balances and pay higher interest—factors which should allow them to expand more rapidly—they had smaller increases in their penetration levels over the period of the panel survey. The smallest institutions are more likely to serve poorer communities. They also have relatively low minimum deposit requirements and low fees to open a savings account. The smallest institutions expanded most rapidly. In terms of quality ratings, higher quality institutions tend to be larger, have moderate increases in penetration rates and are more likely to retain their initial quality rating, while low quality institutions tend to be smaller and have larger increases in penetrations rates.. 2. Evolution of Accounts, 2003-2007 In this section, we analyze the opening and closing of accounts among households in the Panel Survey. While there are no exogenous shocks to financial access during the survey period which allow us to cleanly identify why certain households become banked, the data are well suited to differentiate the characteristics of those households which are banked and those which are unbanked. First, the baseline sample contains nearly equal numbers of randomly selected clients of popular sector financial institutions and randomly selected non-clients residing in the same neighborhoods. Second, between 2004 and 2007, the number of sample households transitioning from unbanked to banked is large. So even though we are not able to identify with great confidence a causal relationship household characteristics and use of financial services, we are able to provide a very clear description of who was banked, and who became banked over this period.13 In this section, we address the following questions: • What characteristics differentiate banked households from unbanked households in the baseline (2004) survey? • Are the same characteristics associated with transition from unbanked to banked over the survey period, that is, between 2004 and 2007, or has the expansion of financial services reached new types of households? • What role do risk aversion and trust play in determining which households open accounts? • After controlling for household characteristics, do the characteristics of the financial institutions affect which households become banked?. The number of households with accounts in 2004 who closed those accounts over the three follow-up survey years is much smaller. For this reason, we are not able to say as much about the types of households which are at risk of disconnecting from financial services.. 89.
(18) ASSESSING CHANGES IN HOUSEHOLD ACCESS TO FINANCIAL SERVICES IN MEXICO: AN ANALYSIS OF THE SANSEF1 SAGARPA PANEL SURVEY 2004-2007. We focus most of the analysis in this section on the balanced panel of 3,473 households surveyed from the first to the fourth round. This includes the 3,205 households surveyed in all four rounds and an additional 268 PATMIR households which were surveyed in rounds 1, 2 and 4. These 268 households were not surveyed in round 3 dueto budget reasons. The sample of 3,473 households represents 60% of the baseline sample. As we discuss tater in the section, the households dropping out of the sample differ in significant ways from the households in the balanced panel. However, the predicted probability of opening a bank account between 2004 and 2007 is similar for those dropping out of and those remaining in the sample. Thus, attrition does not appear to have a large impact on the overall estimates of use of financial services.. 2.1 Changes in financial penetration rates Figure 1 displays changes in the banking status of households during each of the four years of the survey, defined as whether a household has at least one account with a financial institution. For the figure, we use only households which were surveyed in all four rounds—that is, we eliminate the 268 PATMIR households who were not surveyed in round 3. We also eliminate the households in the subsamples of the Procampo /Oportunidades, and Crédito a la Palabra subsamples, since the timing of opening an account was determined by the programs rather than the households for these subsamples. The remaining sample of 2,462 households comes from communities served in 2004 by Cajas, BANSEFI and PATMIR. On the figure, dark arrows indicate movement to banked status, while light fines indicate movement to unbanked status. The top half of the figure shows the households surveyed in each of the four rounds which did not have an account in the baseline survey. For example, of 1,212 households without an account in 2004, 200 (17 percent) opened an account before the 2005 survey. Of these 200 households, 183 continued to have an account in 2006, and 180 continued to have the account in 2007. On the other hand, 17 of the 200 opening an account before the 2005 survey had closed the account by 2006; 6 of those 17 households reopened the account again before the 2007 survey. In general, many more households move from unbanked to banked status than move from banked to unbanked status. Put another way, opening the first account is not as rare as closing the last account for a household. Overall, the data suggest there was a very substantial increase in the percentage of households with bank accounts. Almost 36 percent of households without an account in 2004 had opened an account before 2007. Only 9 percent of households with an account in 2004 had no account in 2007. The percentage of households in the sample with at least one account increases by 14 percentage points, from 49 to 63 percent. The increase in penetration rate varíes markedly by type of institution, and the changes measured in the panel data likely reflect different changes in the underlying population, or several reasons. First, for the Cajas and PATA/Hl? branches, the sample was designed to include roughly the same number of clients and non-clients. Inn fact, in most of the sampled communities, clients likely represented less than half of the households in 2004. For households participating in Procampo, Oportinidades, or other govemment programs, the Caja or. 90.
(19) WELL-BEING AND SOCIAL POLICY VOL 5, NUM. 1, pp, 75-111. Figure 1 Changes in Account Status by Survey Round. 788 906. 118. 1,012. 3 106. 1,212. 103 11. 17. 6. 200. 3 180. 16 30 14 72 42. 3 39. 1,250 60 98. 38. 1,178 37 1,080. 91. 1,043.
(20) ASSESSING CHANGES IN HOUSEHOLD ACCESS TO FINANCIAL SERVICES IN MEXICO: AN ANALYSIS OF THE BANSEFI / SAGARPA PANEL SURVEY 2004-2007. BANSEFI branches selected were ones where electronic transfers of monthly payments were planned. We address these issues in more detail below. But before estimating what the panel data imply about the overall increase in use of financial services, we look first at the changes in penetration rates in each of five distinct subsamples of the panel. These are shown on Table 8. This table shows the data from all of the subsamples in the balanced panel, including those for the government programs. Table 8 Penetration by Sub-sample and Year by Institution / Program 2004. 2005. 2006. 2007. Cajas (N=1825). 47.9%. 54.8%. 55.8%. 61.4%. BANSEFI (N=137). 35.8%. 44.5%. 51.1%. 60.6%. PATMIR (N=894). 46.1%. 48.6%. 54.0%. 59.4%. 55.1%. 60.4%. 3.5%. 36.0%. 58.1%. 73.3%. Oportunidades / Procampo (N=531) Crédito a la Palabra 2/ (N=86). 11. 48.5%. 2/. Notes: 1/Some households in the PATMIR survey were not surveyed dm-Mg 2006. 2/A part of this subsample is served by BANSEFI, and a part by Cajas.. The largest group of households, representing just over half of the sample, are located in communities served by Cajas. 61 percent of households in these communities had one or more accounts with a financial institution in 2007, an increase of 13 percentage points from the 48 percent which had at least one account in 2004. The change in the penetration rate in the Caja subsample is similar to the change in the full sample. Households in communities served by the PATMIR initiative make up just over one-quarter of the sample, and are the second largest group of households. Here, Table 8 shows a much smaller change in penetration between 2004 and 2007. The percentage of households served by PATMIR institutions with at least one account increased from 46 percent in 2004 to 49 percent in 2007. The slower increase in penetration rates among the PATMIR sub-sample is offset by a more rapid rate of increase in the three remaining subsamples: BANSEFI, Procampo / Oportunidades, and Crédito a la Palabra. Note that the data shown on the BANSEFI line of Table 8 do not include the participants in the Procampo / Oportunidades, and Crédito a la Palabra programs who are served by BANSEFI. Among BANSEFI clients who are not participants in these programs, penetration increased quite markedly, from 36 percent to 61 percent over the three years. The two remaining sub-samples are households participating in one or more government social programs.. 92.
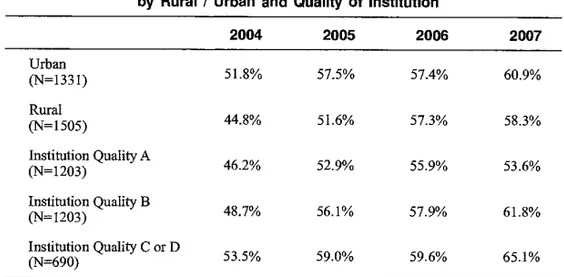
(21) WELL-BEING AND SOCIAL POLICY VOL 5, NUM. 1, pp. 75-111. In cooperation with the govemment agencies managing these programs, BANSEFI began paying some recipients through bank accounts opened in a branch ofBANSEFIor other Caja. The increase in penetration for these subsamples is important to note, but should be viewed as distinct from the organic process of growth arising from the Cajas themselves. For those in the Procampo / Oportunidades sub-sample, electronic transfer began before the baseline survey in 2004. The increase in the penetration rate from 54 percent in 2004 to 60 percent in 2007 might therefore be interpreted as growth in addition to that generated by the electronic transfer program itself." But in the case of the Crédito a la Palabra sub-sample, only 3 percent of households had an account in 2004. The rapid increase in penetration—to more than 70 percent by 2007—should be interpreted as a result of the electronic transfer program itself. Table 9 breaks the sample in two additional dimensions. First, we compare changes in urban areas with changes in rural areas. Second, consultants working for BANSEFI graded the popular sector financial institutions in 2003 according to their financial balances. Not all of the institutions in the sample were graded, but among those that were, we split the sample into those which were judged to be the most sound (graded aprobado), those graded close to being ready to be certified (graded "B") and those which were less sound (graded "C" or "D"). The increase in penetration rates across the four rounds is smaller for those rated "aprobado" than for those rated in one of the three lower categories. There is little difference in the change in penetration rates among those rated B, C, or D. In urban areas, penetration in the sample increased 52 percent in 2004 to 61 percent Table 9 Penetration by Sub-sample and Year by Rural / Urban and Quality of Institution 2004. 2005. 2006. 2007. Urban (N=1331). 51.8%. 57.5%. 57.4%. 60.9%. Rural (N=1505). 44.8%. 51.6%. 57.3%. 58.3%. Institution Quality A (N=1203). 46.2%. 52.9%. 55.9%. 53.6%. Institution Quality B (N=1203). 48.7%. 56.1%. 57.9%. 61.8%. Institution Quality C or D (N=690). 53.5%. 59.0%. 59.6%. 65.1%. Note: Sample for 2006 does not include 268 households in the PATMIR sub-sample who were not surveyed that year.. " We believe the process of bringing social program recipients into the banking system was potentially one of the most important aspects of the LACP. However, the panel data are not well suited for analyzing the impact of this part of the banking reforms, because the majority of program participants in the panel survey were banked before the 2004 baseline survey.. 93.
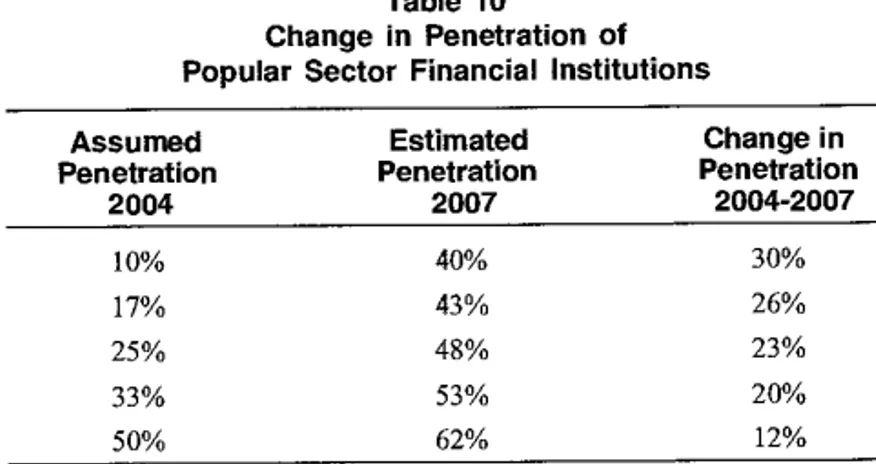
(22) ASSESSING CHANGES IN HOUSEHOLD ACCESS TO FINANCIAL SERVICES IN MEXICO: AN ANALYSIS OF THE BANSEF1 / SAGARPA PANEL SURVEY 2004-2007. in 2007, while in rural areas the comparable increase was slightly lamer, from 45 percent to 58 percent. Penetration among households served by higher quality institutions increased from 47 percent to 57 percent over the three years, while penetration among households served by lower quality institutions increased from 54 percent to 65 percent. Neither the urban / rural differences nor the high quality / low quality differences are large in magnitude or statistically significance. What do the panel data suggest about the overall increase in financial penetration in the surveyed communities? The raw data on Tables 8 and 9 likely understate the increase because households with and without accounts in 2004 each represent 50 percent of the baseline sample (by design). Almost certainly, households with accounts actually represented much lens than 50% of all households in the community in 2004. The increase in use of financial services by households which were unbanked in 2004 would therefore represent a process occurring in a larger share of the population. To obtain the estimated change in the penetration of financial services in the community, then, we should weight the households without accounts in 2004 to reflect their larger share of the population. If, for example, only 1 in 10 households in the surveyed communities had an account in 2004, then each surveyed household without an account should be weighted to represent vine times as many households as each surveyed household with an account. Unfortunately, we have no hard data which allows us to estimate what the appropriate weights should be. Instead, we estimate the change in penetration by popular financial sector institutions using initial (2004) penetration rates ranging from 10 percent to 50 percent. These are shown on Table 10.15 Assuming that one-third of households were banked in 2004—a percentage Table 10 Change in Penetration of Popular Sector Financial lnstitutions Assumed Penetration 2004. Estimated Penetration 2007. Change in Penetration 2004-2007. 10%. 40%. 30%. 17%. 43%. 26%. 25%. 48%. 23%. 33%. 53%. 20%. 50%. 62%. 12%. Note: Sample include Cajas,BANSEHandPATMIR branches, but escindes participares in the Procampo / Oportunidades and the Crédito o la Palabra programs.. " Twenty percent appears to be a reasonable estimate for the 2004 penetration rate. A BANSEFI census of popular sector financial institutions conducted in 2002 indicated there were about 4.4 million separate accounts in these institutions at the time. The 2000 population census in Mexico indicates there were just over 22 million households in Mexico in 2000. Of course, some households will have multiple accounts, and penetration in and around Mexico City (where little of the panel survey sample is located) is particularly high. Offsetting this is the fact that penetration rates in communities with financial institutions in 2004 (like all of those included in the baseline survey) will be higher than penetration rates in communities without financial institutions.. 94.
(23) WELL-BEING ANO SOCIAL POLICY VOL 5, NUM. 1, pp. 75-111. which seems likely to be too high—the panel data suggest that penetration increased from 33 percent to 53 percent, or by 20 percentage points. This represents quite a substantial change. Using lower initial penetration rates results in even higher estimates of the growth of financial services in the surveyed communities. There are two caveats which should be kept in mind when interpreting the estimates shown on Table 10. First, since every household in the sample is in a community with at least one financial institution, the table may overstate the increase in penetration of financial services for the country as a whole. Households in communities without financial institutions are less likely to have opened accounts. Second, there is a possibility that use of financial services by households in the sample was subject to "Hawthorne effects." By focusing the household's attention on issues of financial services, the survey itself may have increased the probability an unbanked household decided to open an account. Lacking comprehensive national data on the use of financial services over this period, we have no way of knowing how much either of there factors affects our estimates of the increase in penetration rates.. 2.2 Characteristics of households using financial service The observed use of financial services by households implies both that the services were offered by one or more institution and that the household demanded the services. In this section, we analyze the characteristics ofhouseholds which are associated with having an account in a popular financial sector institution. The design of the baseline survey is well suited to uncovering the factors which differentiate households with and without accounts. Assigning a direction of causation is more problematic. For example, if we find that wealthier households are more likely to have accounts at formal fmancial institutions, do we interpret this as indicating that wealth increases the demand for financial services, or that access to financial services allows households to accumulate wealth? We alleviate this concern somewhat in the panel data by using characteristics of the households measured at the time of the baseline survey to categorize households adding accounts between 2003 and 2007. But the comparison of characteristics associated with baseline use of fmancial services and the characteristics associated with the incremental use of financial services is in itself of interest. This comparison tells us something about the nature of the expansion in the popular sector financial sector. With this in mind, we present both the baseline cross section and the intertemporal analyses here. What are the characteristics of households that had accounts in 2004? We will divide the discussion into factors which are likely to have been determined by the time the account was first opened, and those which are likely to have been determined (at least in part) alter the account was opened. The age and education of the household head(s) are examples of the formen Income and business ownership are examples of the latter. Table 11 shows the results of probit regressions for use of financial services. The dependent variable is defined as one if the household has an account with any financial institution, and zero otherwise. The table shows the marginal effect of a change in each independent variable. The first two columns use data from the baseline survey,. 95.
(24) ASSESSING CHANGES IN HOUSEHOLD ACCESS TO FINANCIAL SERVICES IN MEXICO: AN ANALYSIS OF THE BANSEFI SAGARPA PANEL SURVEY 2004-2007. and the third column uses data from the 2004 and 2007 surveys. The sample in the third column is limited to households without an account in 2004. Thus, the dependent variable indicates a change in status from unbanked to banked between 2004 and 2007.. Table 11 Characteristics of Account Holders. Account 2004. 6 years of schooling 7-9 years of schooling 10-12 years of schooling More than 12 years of schooling Average age of heads Average age of heads squared Head speaks indigenous language. 0.104*** (0.023) 0.156*** (0.027) 0.347*** (0.027) 0.459*** (0.022) 0.030*** (0.004) -.0002*** (0.00003) 0.124*** (0.020). Female head in labor force Household rece ves remittances (International) Own agricultura) business Own non-agricultura) business Log durable assets (value) Log expendittures Number of observations R-square. 3472 0.07. Account 2004. Households opening account, 2004 to 2007. 0.068*** (0.024) 0.095*** (0.029) 0.250*** (0.033) 0.365*** (0.034) 0.021*** (0.004) -.0002*** (0.00004) 0.177*** (0.021) 0.041* (0.022) 0.058 (0.043) 0.052** (0.021) 0.056*** (0.020) 0.067*** (0.007) 0.065*** (0.016). 0.052* (0.031) 0.074** (0.037) 0.188*** (0.056) 0.248*** (0.090) 0.006 (0.004) 0.000 (0.000) 0.005 (0.028) 0.042 (0.029) M.102* (0.051) 0.095*** (0.027) 0.039 (0.027) 0.030*** (0.009) 0.051*** (0.020). 3464 0.11. 1815 0.03. Notes: Robust standard errors in parentheses. *Means significant at 10% leve). **Means significant at 5% levet.. ***Means significant at 1% levet.. 96.
(25) WELL-BEING ANO SOCIAL POLICY VOL 5, NUM. 1, pp. 75-111. Several demographic characteristics are strongly associated with being banked. Recall that the sample is limited to households located in communities with popular sector financial institutions, so these differences can be interpreted as being driven by demand for financial services, or by the effect of marketing efforts by the financial institutions. Households whose heads have higher levels of formal schooling are more likely to be banked.16 The excluded education group is households where both the head and spouse (ifpresent) have less than 6 years of formal schooling. Compared with this low-schooling group, households where the head or spouse has at least six years of schooling are 10 percentage points more likely to have an account, and those with seven to nine years of schooling are 16 percentage points more likely to have an account. The effect of high school or some post-high school education is even larger. Households where at least one head has completed high school are 35 percent more likely to have an account, and those where at least one head has some post-high school education are 46 percent more likely to have an account. More than 83 percent of households in the highest education group had an account in 2004. There is also a strong pattern with respect to age. The probability of having an account in the baseline survey is increasing in the age of the household head until about age 75. The impact of an additional year of age decreasing as the head grows older. Note that since few households close accounts once they are opened, a similar pattern with respect to age could be generated by a hazard function with some random probability of opening an account in each year. Alternatively, since income and wealth increase with age, on average, the pattern may reflect an increase in demand for financial services as families age. Finally, a somewhat more surprising result is that the likelihood of having an account in the baseline is about 12 percentage points higher if the head or spouse speak an indigenous language. The second column adds several variables for which the direction of causation is much harder to discern. Of note, we find that those who own an agricultural or non-agricultural business, and households with higher expenditure levels and more assets, are more likely to have an account. Households operating an enterprise are about 5 percentage points more likely to have an account. Expenditures and assets have somewhat larger effects. A one standard deviation increase in expenditures (about 3 log points) is associated with a 20 percentage point increase in the probability ofhaving an account. A similar increase in household assets (2.5 log points) increases the likelihood of having an account by 16 percentage points." Indicators of whether the female head works and whether anyone in the household receives remittances from outside of Mexico are positively associated with having an account, but the effects are statistically much weaker. We note that both education and age are still strongly associated with having an account, though both effects are reduced in magnitude by 20-30 percent. This is likely because education and age are positively. We define schooling as the maximum of the schooling attainment of the household head and spouse when both are present. '7 Assets are valued at replacement costs by the respondents. Where the value is missing, we use the median response from households owning and reporting a value for the asset. Even so, assets are missing for 7 percent of the households. To retain the observations, we replace the missing data with zeros and include in the regression a dummy variable indicating the asset data are missing. We follow a similar procedure for the nine percent of the households which have missing expenditure data. 16. 97.
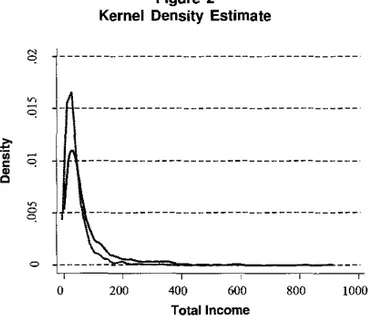
(26) ASSESSING CHANGES IN HOUSEHOLD ACCESS TO FINANCIAL SERVICES IN MEXICO: AN ANALYSIS OF THE BANSEFI / SAGARPA PANEL SURVEY 2004-2007. correlated with income and assets. Failure to control for the latter in the first regression may result in an upward bias on the coefficients. In the third column, we examine the factors associated with households which did not have an account in the baseline sample, but which opened an account before 2007. This regression can be interpreted as telling us something about the nature of the expansion in the sector. In the baseline survey, we find that wealthier, higher educated households are more likely to have accounts. Among those without accounts in the baseline, are the wealthier, more highly educated households also more likely to open an account during the panel period? Or did the financial institutions reach further down the education and income spectrum to acquire new clients? The probit reported in Column 3 of Table 11 suggests an affirmative answer to the first question. Opening an account is positively associated with education, assets and expenditures (both measured at the baseline). The coefficients are somewhat smaller in Column 3 than in Column 2, but the mean of the dependent variable is also smaller. Only about a third of those with an account in 2004 had one in 2007, while half of the baseline sample had an account. Relative to the dependent mean, then, the impact of education, expenditures, and wealth are similar in the baseline sample and the sample measuring new clients. Figure 2 shows the relationship between income and opening an account in a slightly different way, but tells a similar story. The figure shows the kernal density of the distribution of income among households without an account in either 2004 or 2007, compared with the distribution of income among households opening an account between 2004 and 2007. The latter is shifted to the right, and the former has much more mass in the left-hand tail. This confirms the fact that new clients carne disproportionately from among the higher income households without accounts in 2004. Figure 2 Kernel Density Estimate. 600 400 Total 'acorne — No Account Round I — Account Round 4 kemel = epanechnikov, bandwidth = 5.6229. 98.
(27) WELL-BEING AND SOCIAL POLICY VOL 5, NUM. 1, pp. 75-111. We find similar patterns when the sample is split between urban and rural areas (see Table 12). Age, wealth, and expenditures all have strong positive associations with baseline accounts in both urban and rural areas. The association with education is much stronger in urban areas than in rural areas. Business ownership has no significant effect, and a lower measured effect, in rural areas. In terms of accounts opened between 2004 and 2007, only education and household assets have any significant association in urban areas. Wealth, expenditures, and especially ownership of an agricultural business are all significantly associated with opening an account among rural households. Finally, a note on the effect of attrition on the estimates of changes in financial penetration discussed in Section 2.1 aboye. As we saw in section 2, there was a substantial amount of attrition from sample over the four survey waves. Moreover, the attrition was not random. More educated, higher wealth households were more likely to drop out of the sample. Since these characteristics are associated with higher probabilities of opening an account, this suggests that attrition might lead to an upward bias in the change in financial penetration estimated from the balanced panel. However, since business owners were less likely to drop out, and more likely to open an account, this suggests that the estimate might be biased downward. We estimate the net effect of attrition on the estimated increase in financial penetration by using the regressions coefficients from Column 3 of Table 11 to predict whether the households who dropped from the sample opened accounts between 2004 and 2007. We find that the attriting households were slightly more likely to open an account than were the households remaining in the sample for the fourth round. The difference was small-34 percent of attriting households are predicted to open an account compared with 33 percent of non-attriting households. It is important to note that this estimate is based only on measured characteristics. There may be unmeasured characteristics associated with both opening an account and dropping out of the sample. Nevertheless, the measured variables suggest that attrition did not have a large impact on the increase in penetration estimated from the data.. 2.3 The role of trust and altitudes toward risk Depositing money in a financial institution requires trust in the institution. The Ley de Ahorro y Crédito Popular was designed in part to increase the security of deposits and hence the level of trust in popular sector financial institutions by providing a regulatory structure for the sector. How much should we expect an increase in the trustworthiness of institutions to increase the demand for financial services? Since the law was rolled out all at once, there is no direct way to measure that. However, households participating in the panel survey were asked how much they trust friends, neighbors and various local and national institutions. The relationship between these measures of trust and the use of financial services is interesting because that relationship provides indirect evidence on the importance of trust in the institutions. Of course, we should expect account holders to have more trust in financial institutions themselves. They have more experience dealing with them, and personal experiences on which to base that trust. Moreover, they have indicated at least a minimal level of trust by choosing to open an account. So their responses to questions related to generalized trust (friends, neighbors) or trust of government institutions are arguably more interesting in this context than the responses related to trust of financial institutions.. 99.
(28) ASSESSING CHANGES IN HOUSEHOLD ACCESS TO FINANCIAL SERVICES IN MEXICO: AN ANALYSIS OF THE BANSEFI / SAGARPA PANEL SURVEY 2004-2007. Table 12 Characteristics of Rural and Urban Accout Holders Rural. Urban. Households Households Account Account opening account, opening account, 2004 2004 2004 to 2007 2004 to 2007. 0.045. 0.037. 7-9 years of schooling. (0.041) 0.139***. (0.054) 0.102*. (0.036) 0.020. (0.045) 0.006. 10-12 years of schooling. (0.046) 0.297***. (0.059) 0.238***. (0.043) 0.101. (0.054) 0.172**. (0.062). (0.086). 6 years of schooling. 0.085. 0.056. 0.086. (0.045) 12+ years of schooling. 0.231*. 0.353***. (0.143). (0.049) Average age of heads. 0.005. 0.026*** (0.006). Average age of heads squared. (0.007) 0.000. -.0002***. (0.00006) 0.274*** Head speaks indigenous language (0.037) 0.034 Remate head in labor force. (0.00007) 0.066 (0.060). 0.316*** (0.060) 0.015***. 0.176 (0.133) 0.003. (0.000) 0.137***. (0.007) 0.000 (0.000) 0.017. (0.029). (0.038). (0.006) -0.0001**. -0.036. 0.091**. -0.001. (0.039) 0.025. (0.051). (0.039) 0.181***. (0.053) -0.152*. Own agricultura! business. (0.084) 0.109**. (0.115) 0.024. (0.058) 0.013. (0.072) 0.096***. (0.063). (0.029). (0.036). Own non-agricultura) business. (0.043) 0.087***. 0.036. 0.046. Household rece ves remittances (International). 0.085. (0.033) Log durable assets (value) Log expendittures Number of observations R-square. 0.084*** (0.013) 0.070** (0.031). (0.047) 0.035** (0.017). (0.041) 0.037*** (0.014). 0.039 (0.037). 0.055*** (0.024). 0.096*** (0.030). 641 0.04. 1329 0.17. 0.054. (0.031) 0.056*** (0.011). 1502 0.08. 828 0.05. Notes: Robust standard errors in parentheses. *Means significant at 10% leve!. **Means significant at 5% levet.. ***Means significant at 1% leve!.. 100.
(29) WELL-BEING AND SOCIAL POLICY VOL 5, NUM. 1, pp. 75-111. What do the data suggest? Table 13 shows the average responses of the full sample, and then splits the sample of those without account in 2004 jato those who opened an account between 2004 and 2007 and those who did not.'8 Respondents were asked to report trust on a scale of I to 5, with 1 representing "much confidence" and 5 representing "no confidence." Confidence in neighbors, other Mexicans and government institutions are uniformly higher among those who opened accounts between 2004 and 2007 than among those who did not. The differences are not large in magnitude, but they are statistically significant. For example, those opening account given and average score of 1.37 in trust of neighbors, while those not opening account have an average score of 1A8. Confidence in local government appears to be more important than confidence in national government.. Table 13 Confidence in People and Institutions Without Account 2004 Trust in:. Full. Account,. No Account,. p-value,. Sample. 2007. 2007. difference. Neighbors. 1.44. 1.37. 1.48. 0.01. Other Mexicans The Church. 1.75. 1.70. 1.81. 0.04. 1.99. 1.92. 2.03. 0.05. The Press. 2.52. 2.55. 2.47. 0.28. The National Government. 3.29. 3.25. 3.34. 0.20. The State Government. 3.44. 3.36. 3.52. 0.02. The Local Government. 3.60. 3.69. 3.50. 0.01. The Bureaucracy. 4.07. 4.01. 4.11. 0.09. Note: Question asked: "How much confidence do you have in...". Numbers shown are average responses, with 1 representing "much confidence" and 5 "no". p-values shown for t-test of difference between Colutnns 2 and 3. Bold indicates significance at the .05 level or better, italics significance at the .10 level.. The fact that trust is correlated with opening an account suggests that potential depositors see some risk in using financial institutions. Are those who are more willing to take risks therefore more likely to open an account as well? The 2007 round of the survey asked respondents whether they preferred certain payoffs or gambles in a variety of scenarios. For example, respondents are asked whether they prefer 500 pesos with certainty, or a gamble based on drawing a random number between 1 and 20. The gamble would pay nothing if the number 1 were drawn, 50 pesos if. " The table shows data from the sample of unbanked households in all of the survey communities. But the results are very similar if the sample is limited to households in communities served by Cajas.. 101.
Figure
+3
Documento similar
These two models are then used to calculate the number of SLSNe-I, in bins of ∆z = 0.5 width, centred on multiples of z = 0.5 up to z = 3.5 which is consistent with the highest
In that context, this paper exploits information about intrahousehold transfers from employed to unemployed spouses in the Spanish Survey of Household Finances to study the
Asociación de Emprendedores de México (ASEM) is an association focused on the development and promotion of the entrepreneurial ecosystem in Mexico, offering access to
The survey data analysis together with the team evaluation of problems faced during the course, allowed teachers to learn on the necessity to introduce changes
The purpose of the research project presented below is to analyze the financial management of a small municipality in the province of Teruel. The data under study has
the lack of support and guidance for professional and work development is the one issue on the working conditions of the staff where there is more room for improvement,
Following the literature of collective households (see Chiappori and Donni 2010 for a recent survey), the utility of each individual in the household carries a weight,
In the “big picture” perspective of the recent years that we have described in Brazil, Spain, Portugal and Puerto Rico there are some similarities and important differences,
