Social capital in labor market access and poverty in Mexico
25
0
0
Texto completo
(2)
(3) WELL-BEING AND SOCIAL POLICY VOL. 9 NUMBER 1, pp. 49-71. SOCIAL CAPITAL IN LABOR MARKET ACCESS AND POVERTY IN MEXICO Héctor H. Sandoval' University of Wisconsin — Madison [email protected]. Martín Lima National Council for the Assessment of Social Development Policy (CONEVAL) [email protected]. Abstract. S. ocial capital, defined as the set of social networks that a person has in order to obtain benefits, is used by the population as a mechanism for providing resources, to cushion shocks in consumption and to obtain information on available employment opportunities. This study employs a logistic model to characterize the manner in which people access the labor market in Mexico through the use of their social networks (bonding social capital). It also takes poverty levels finto account. A cycle in the use of social networks was observed in which job searches are initially conducted with the help of family, there friends and co-workers, and, lastly, neighbors. This cycle is robust in the case of the poor, who rely primarily on friends and co-workers to enter the labor market. Keywords: Social capital, poverty, labor market, social networks, logistic models. Classification: Z13, 22, J64.. Introduction. T. he literature has used the term social capital to highlight the importance of social networks, which include trust, sympathy, reciprocity, and which are governed by certain formal or informal tales. Social capital exists in the form of networks and is inherent to the structure of relationships between actors; refers to the ability or authority to seek and secure resources through social networks to which an individual belongs. Social networks, for their part, play a fundamental role in the flow of information. Using the links that they have, individuals can capitalize on various types of assistance in times of need. For example, help getting a job if unemployed or aspiring to a better job.. The authors wish to acknowledge Patricia Espinosa and Rocío López-Rodríguez for their support during the preparation of this study. Comments from Liliana Meza, an anonymous referee and our fellow participants at the Universidad Iberoamericana seminar were greatly appreciated. Funding for this study was supplied by a grant from the Ministry of Public Education and the Government of Mexico, in the person of flector 11. Sandoval. Comments expressed in tisis document do not necessarily reflect the institutional views of the CONEVAL, the SEP or the Government of Mexico. Any errors or omissions are the sole responsibility of tbe authors.. 49.
(4) SOCIAL CAPITAL IN LABOR MARKET ACCESS AND POVERTY IN MEXICO. Woolcock and Narayan (2000) argue that in developing countries such as Mexico, social capital is mainly made manifest through social relations that permit individuals to address poverty and vulnerability by creating mechanisms to protect against measures designed to decrease consumption, and, as such, it is appropriate to differentiate the analysis for people in poverty. Based on data from the 2011 National Survey of Social Capital (ENCAS), this paper provides empirical evidence on the phenomenon of social capital, as well as said capital's relation to labor market access and poverty in Mexico. Its main purpose is to characterize how people in Mexico access the labor market through the use of networks (as proxy of social capital), determining their well-being levels by controlling for poverty using (asset) income2. To do this, a logistic model is employed in order to analyze individuals" decision-making processes, as well as access to the labor market through social capital, conditioned upon the fact that an individual has needed help to find work during the survey period. It should be mentioned that said individual may or may not actually seek help from their networks in order to find work. Alesina et al (2010) find that individuals who inherit stronger family ties are less mobile, earn lower wages and are employed less frequently. Freitag and Kirchner (2011) demonstrate that European regions with high levels of social capital tend to have lower unemployment rates. Krug and Rebien (2011) found no effect, in monetary terms, between obtaining employment through social networks versus traditional media. They did, however, identify an effect in nonmonetary terms. Cingano and Rosolia (2006) show that the probability of finding employment in Italy increases in direct relation to the use of contacts. Using data from Mexico, Sandoval and Lima (2013) found that the three stages were linked to the work cycle. In the first stage, linked to the first approach to the labor market, individuals mainly rely on the family to find work. In the second, linked to the period of greatest productivity, workers opt for friends and colleagues. In the last stage, linked to the period of old age, people seek help from neighbors. The present study finds that people living in poverty utilize their networks for information and access to the labor market more often than the population which makes up non-poor networks. In particular, this support comes from friends and coworkers. The study by Sandoval and Lima (2013) goes even further, stating that the three stages linked to the labor cycle are robust in a context of poverty. This document is divided into six sections. The second section presents the conceptual framework and review of the literature related to the study of social capital, its classification, as well as its relationship to the labor market and poverty. The third section presents a discrete choice model to analyze access to the labor market. The fourth section details the sources of information and relevant details for the empirical implementation of the model. The fifth section presents the results. The sixth and final section concludes the study with a discussion of the findings.. 1. Review of the literature Social capital refers to the ability or aptitude to seek out and secure resources via the social networks to which an individual belongs. However, the obtainment of said benefits is facilitated, and in many cases achieved, by certain network attributes. Networks are strengthened by attributes such According to the methodology for estimating poverty income employed by the Technical Committee for Poverty Measurement (CTMP, 2005), asset poverty refers to the lack of disposable income to meet the needs of food, health, education, clothing, housing and transportation; i.e., even when all income is dedicated to meet these ends.. 50.
(5) WELL-BEING AND SOCIAL POLICY VOL. 9 NUMBER 1, pp. 49-71. as cooperation. The array of attributes includes confidence, expectations of reciprocity, formal and informal rules that each individual practice inside and outside of their networks, and sympathy. Within the literature, these characteristics have been associated with the definition of social capital. The multifaceted nature of social capital, therefore, is evidenced by the presence of these attributes. Putnam (2000) states social capital refers to connections between individuals. These may include social networks, norms of reciprocity or the trustworthiness that arise from them. Fukuyama (2001) defines social capital as specific informal norms that promote cooperation between individuals, such as reciprocity between friends based on complex and articulated doctrines. Finally, Robison and Hanson (1995), as well as Robison and Siles (2012), define social capital as the sympathy of a person or group of persons have for another person or group that can produce benefits and potential advantages, in addition to preferential treatment. In this article, social capital refers to relationships characterized by trust, reciprocity and sympathy, through which people can secure benefits and resources. The capital is found in social networks, and to be inherent to the structure of interpersonal relationships. Moreover, it arises spontaneously and naturally from the repeated interaction of agents in any situation. However, it can also arise if individuals are looking to gain a reputation based on honesty and responsibility. Many of the consequences of interpersonal relationships are unexpected and unanticipated. While the immediate reasons in many relationships may be pleasure-related, economic benefits are sought through social interactions and sometimes occur as side effects. Arrow (1972) finds that social connections can, dueto a lack (or high cost) of legal structures, facilitate investment and other financial transactions, such that social relations can facilitate transfers between economic agents. Social networks serve as a tool in the flow of information and facilitate the emergence of new terms of trade Schmid and Robison (1995) demonstrated that, if an individual has an excellent credit record, then getting a loan is easy, regardless of other personal factors; but in cases of marginally-creditworthy individuals, social capital impacts the ability to receive credit. Thus, social capital facilitates negotiations and generates transactions through its use of information. However, social networks are also likely to generate negative externalities. In this regard, Portes (1998) cites the exclusion of outside groups, as well as restrictions on the freedom of individuals, as examples of such negative externalities. Because social networks are migue, they can produce inequalities. For example, the inclusion of some members may depend on the exclusion of others. In the literature, social capital is typified in a variety of ways. Some of the most widely-used characteristics include: network strength, which Granovetter (1973) defined as strong or weak tiesa; structure type, which Coleman (1988) uses to typifies social networks as either horizontal or vertical structures; and, according to Cooley (1909), groups types (either primary or secondary). The classification of Woolcock (1999) is widely used in the literature, it classifies social capital in three types, bonding social capital, bridging social capital and linking social capital'. 3 According. to Granovetter, the main feature of relations between people relates to how strong or weak the ties that bind are. The closer two people are, in terms of social proximity, the stronger their links will be. Additionally, the more distant two people are, the less close the ties between them; even if they are very similar in physical or social characteristics.. 4 it should be noted that many authors use the same nomenclature, although some studies interchange bridging and linking social capital; i.e., Robison and Siles (2012).. 51.
(6) SOCIAL CAPITAL IN LABOR MARKET ACCESS AND POVERTY IN MEXICO. Bonding social capital is of particular interest for this study. It occurs between individuals through a strong feeling of sympathy and develops over time, as well as through personal contact between individuals. These relationships can be "among family members, committed couples, long-time business partners, or members of an oppressed minority" (Robison and Siles, 2012). Furthermore, these relationships often develop horizontally and between people with similar characteristics (Coleman, 1988). Bonding social capital is similar to the concept of strong ties, but the two concepts are not interchangeable. Bridging social capital occurs in relationships between groups of people who are not alike in every way, but who do share conu-non interests; i.e., members of associations or clubs (Woolcock and Narayan, 2000). This concept is similar to weak ties; however, the two are not interchangeable. Linking social capital signifies the bonds between people who Jack a shared hierarchical or authority level. There is, consequently, a decidedly vertical aspect; as opposed to the previous two horizontal types.. 1.1 Social capital and the labor market Social networks play a fundamental role in information flow and facilitate the emergence of new terms of trade. López- Rodríguez and De la Torre (2010) show how social capital functions as a mechanism to acquire resources vis-á-vis market failures. In the labor market there is no institution that circulates solid, accurate and up-to-date information regarding job opportunities or workers. Young people rarely find work for themselves. Instead, they find jobs through parents or other adults with whom they are acquainted and who may be members of the community (Granovetter, 1974). Granovetter (1974), a pioneer in the study of networks and labor market access, revealed the role of interpersonal relationships in channeling information on jobs, as well as job seekers. A large proportion of jobs are allocated based on personal recommendations and information that is passed by word of mouth. Granovetter coined the phrase "strength of weak ties" to refer to the power family and friends have as an employment reference system. In the same vein, Chwe (1999) shows that weak and sporadic ties are better for information, while strong and dense ties are better-suited to collective action. Another example in the literature is Fafchamps and Minten (1999). They find evidence that commercial farmers generally rely on interpersonal relationships for information about working conditions and in order to identify new opportunities to do business. Reingold (1999) also find empirical evidence that social networks and personal contacts play an important role in finding employment among poor urban residents. Cingano and Rosolia (2006) find that Italians who use contacts significantly increases their probability of finding work. Apart from facilitating job searches, social networks can reduce the problems of information in the hiring process. This facilitates better matching between worker skills and productivity in a given position. In this scenario workers receive, on the one hand, a higher wage; i.e., a wage premium for possessing an above-average quality of work. On the other hand, employers are also able to use better filters for unobserved characteristics during traditional hiring processes. These allocation mechanisms can reduce search costs for employers. In this sense, the use of interpersonal relationships would be expected to result in wage premiums. 52.
(7) WELL-BEING AND SOCIAL POLICY VOL. 9 NUMBER 1, pp. 49-71. However, empirical evidence appears to refute to the latter arguments. Bentolila et al. (2010) found no effects of the use of networks on European wages. Delattre and Sabatier (2007) found networks had a negative effect on income in the case of France. More recently, in a study using data from Mexico, Rodríguez-Oreggia (2012) discovered a wage premium for individuals who did not use their social networks, as compared to those who did. 1.2 Social capital and poverty. The population living in poverty often depends on unstable and informal jobs. Additionally, it does not have access to financial services (López-Rodríguez and De la Torre, 2012), health or social security. Poverty, therefore, correlates to disease and consumption shocks. The access of the population in poverty to financial services is limited because most transaction costs related to obtaining a loan or credit are higher. Access to life insurance is primarily restricted by two conditions: 1) for the insured, the large share of income needed purchase raid policy; and 2) for insurers, the high risk of the population involved. In this sense, interpersonal relationships facilitate the flow of information and collective action through cooperation. They also help provide an opportunity for formal and informal protection mechanisms or rules to be created. These, in tul-ti, can then be used as contingencies or to address risks. The literature points out a relationship between social capital and income level, as well as between social capital and inequality. Several studies provide empirical evidence of the positive effect that social capital has on income levels and well-being in a variety of countries. For example, Narayan and Pritchett (1999) found that social capital rural Tanzania has a positive correlation to household incomes. Households in communities with higher participation rates in social organizations have, on average, a higher level of per capita income5. In studies such as Woolcock and Narayan (2000), developing countries such as Mexico were found to have social capital that is mainly manifested in interpersonal relationships that provide the means to address poverty and vulnerability; i.e., social capital is used as a system of social protection to reduce risks and diminish the effects of consumption shocks. In developed countries social capital is manifested in interpersonal relationships that occur during participation in associations, clubs and voluntary groups; each of which having consequences that involve separate types of externalities. Narayan and Pritchett (1999) state that social capital can be an informal source of social security. For example, they mention that, in the case of the population living in poverty, social capital can be used to acquire resources which cannot be accessed through the formal economy. López-Rodríguez and de la Torre (2012) confirmed these results for Mexico in their study. Portes (1988) mentions that daily survival among the urban poor frequently depends on interaction between family and friends, who also live in poverty. However, the study notes that the biggest problem is that such ties seldom leave their circles, thus depriving citizens of information sources for employment opportunities elsewhere. For example, in the case of Mexico, LópezRodríguez and de la Torre (2012) found that people in poverty mainly used bonding social 5 Dasgupta. (2005) presents a growth model which explains the differences observed in income derived from social capital, and which references results from Narayan and Pritchett (1999).. 53.
(8) SOCIAL CAPITAL IN LABOR MARKET ACCESS AND POVERTY IN MEXICO. capital as a resource to obtain employment, loan and health services. However, Granovetter (1974) argues that strong and intense relationships (family, neighbors and close friends) are more common in poor and rural populations, while other relationships are less common. Consequently, this study seeks to ascertain whether information filtered through strong and intense ties (bonding social capital) has an effect on the labor market, especially with regards to finding a job.. 2. Discrete choice model for labor market access In order to access the labor market, an individual ordinarily uses social networks to find, among other things, information and/or recommendations for available job opportunities. Based on this information, individuals select contacts (from their social networks) who can provide this kind of help effectively; i.e., family, neighbors, friends and coworkers. Assuming job searches involve certain costs, and that the networks to which an individual belongs or resorts to in order to find employment do not overlap, and are exhaustive and finite, an individual will use the option that optimizes (minimizes the cost of) their entry into the job market, based on the knowledge he has of their networks, their confidence and interaction that characterizes their relationship with same. In formal terms, individual i has a choice of alternatives which exist in set { 0,1,... K -1 } of K number of alternatives. Each alternative provides a level of utility U k . In this study, the alternative provides a net well-being via an opportunity to enter the labor market. Controlling for individual characteristics, the individual chooses the alternative, k, that optimizes their search and guarantees access if > (fu for any Whereas there are certain unobservable (to the analyst) characteristics relevant to the decision-making process of the individual, said process may be decomposed as follows, U, k= k+ e„k , where the first term is a systematic component and the second is random. The systematic component is typically modeled as a linear function of observable attributes and characteristics that influence the decision of individual i: V4k=x, fik. Assuming that the component is random, s, k .151 EV, (0,1), the choice probabilities are as follows: ex iIk Pk. (1). Zf_ eX k. Based on there probabilities, it is possible to calculate the odds ratio between two alternatives (i.e., between k and 1) as exiflk —. p.. —. El-K:_ j exiflk. eX (fi. exifil Ef_ j exifi k. 54. (2).
(9) WELL-BEING AND SOCIAL POLICY VOL. 9 NUMBER 1, pp. 49-71. Based on the odds ratios, we can calculate the effect of the change (S) in one of the independent variables, m, keeping the other, vector -m, constant. Oddski (xj,_„„xi..-F (5) — e flk, >(<5 Oddski. (3). where flk„, is the coefficient of alternative k and independent variable m. The aboye model is known as a multinomial logistic modeló. Its estimation is achieved through maximum verisimilitude. In particular, the change described in Equation 3 (where 8 = 1) is the change reported in Section 5 below, in order to facilitate interpretation of results.. 3. Sources of information For the empirical portion of this study, the 2011 National Survey of Social Capital (ENCAS), which was performed during November-December 2011, is used. The 2011 ENCAS contains information on trust, participation in associations, collective action, public values and networks of individuals, inter alia. It employs a sample size of 5,391 households, with an interviewee in each household over the age of 18, and represents a total of 72,285,691 persons in a national context. The sample design of the 2011 ENCAS contains study domains for conducting analysis at the national, urban and rural context, as well as three regions finto which each Mexican state is grouped. Data for household income is primarily drawn from the 2010 National Household Income and Expenditure Survey (ENIGH), which was conducted by the National Institute of Statistics and Geography (INEGI). The survey's stated aim is "to provide information on the distribution, amount and structure of income and household spending". In other words, it provides an opportunity to perform an in-depth analysis of income-source origin, as well as up-to-date data on consumer-goods spending patterns.. 3.1 Implementation For the purposes of this study information on individuals who requested help from their networks with job placement, and who found work, is required. Using data from the 2011 ENCAS it is possible to obtain this information for people who requested said assistance from neighbors, family, comadres/compadres, friends and coworkers; i.e., in this study, support for entering the job market is categorized as bonding social capital. If an individual has requested help to find work thus far in the year7, then said individual has two choices: 1) to use their networks to request said help; or 2) to not use their networks. The first alternative equates to a lack of social capital, whereas social capital refers to relationships 6. Given the characteristics of the proponed model type, multinomial models are neither considered ordered mor conditional.. 7. Corresponds to Section 1.8 of the 2011 ENCAS 2011, questions 84b and 96-103 on the questionnaire.. 55.
(10) SOCIAL CAPITAL IN LABOR MARKET ACCESS AND POVERTY IN MEXICO. through which individuals can secure benefits by virtue of network membership. As such, the second alternative only takes effective help into account. In short, the social capital indicator used in this study is restricted to individuals requesting help from one of the aforementioned networks; that is, those who have received said assistance from at least one or more people. It should be noted that, for the purposes of empirical analysis, information on heads of households was selected because, within the dynamics of the household, it is the head of the household who generally provides and controls its resources; in addition, they make key decisions (McCrate, 1987). In fact, household heads are generally inserted into, or have a greater relationship with, the labor market. In order to enrich the analysis and better understand bonding social capital, a partition of the second alternative was performed. Within the bonding social capital, and based on survey data, one can distinguish five different types of networks. These networks were grouped as follows: 1) neighbors, 2) compadres /comadres and family 3) friends and coworkers. The results of both models are included in the following section. The information needed for the unofficial (multidimensional) poverty addressed by the CONEVAL requires very specific indicators that are not available for all Mexican data sources. As such, the definition of poverty used for this study is that employed before 2009 in Mexico. This definition is based on poverty lines and, as such, its only indicator is income. As such, a household is considered under the poverty line if the total per capita net household income (monetary and non-monetary) lies below a given monetary threshold (poverty line), which considers goods and services that are rationed to be necessary. It should be noted that a considerable amount of data is required to accurately determine total per capita net income. This process requires detailed information in the monetary, as well as the non-monetary, income for households. This involves extensive questionnaires, visits and continuous revisits to interviewed households, thereby increasing the cost of the survey. Since the 2011 ENCAS was clearly not primarily an income survey, the breakdown of income sources, as well as data captured on this subject, is not sufficient to completely construct an income indicator. Consequently, an imputation of this survey variable was performed.. 3.2 Imputation of income Elbers et al (2003) propose an imputation method which is based on income estimates from surveys that capture this variable in great detail. Using information based on the characteristics of the household, its members, of the locality in which they reside and other indicators the method estimates the level of income and imputes it into another source which has the same information captured for households. Employing this methodology, Sandoval (2013) performed the imputation necessary within the 2011 ENCAS database to identify the population in asset poverty. A brief description of the process and the results obtained are presented below. This paper's appendix includes a more indepth description of the methodology, as well the income distribution results that were obtained.. 56.
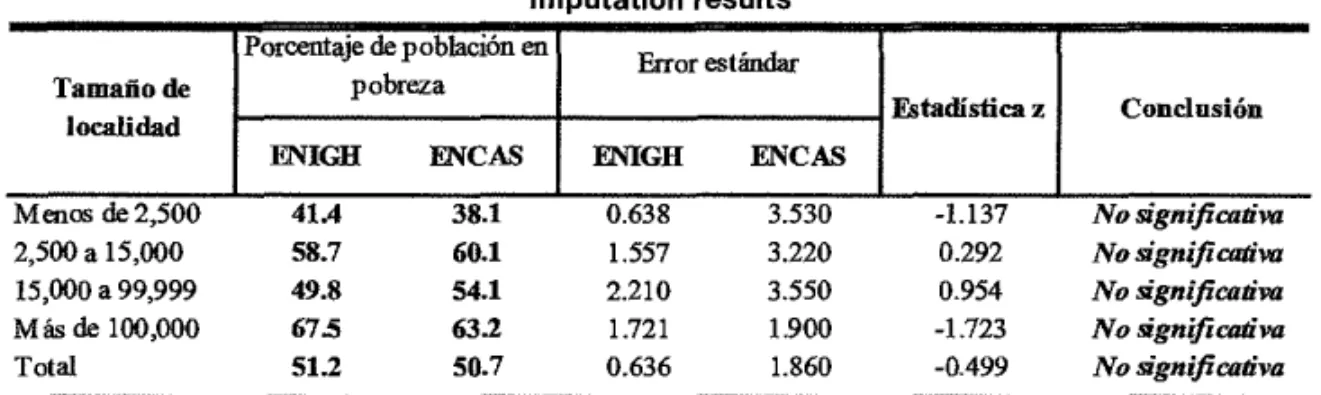
(11) WELL-BEING AND SOCIAL POLICY VOL, 9 NUMBER 1, pp. 49-71. The imputation of income uses data on income from the 2010 EN1GH because there said survey was not performed in 2011. However, because the model uses structural variables for imputation, there is no significant effect related to the fact that the all the data from the two surveys does not correspond to the same time period. The exercise uses the asset poverty line, which refers to a lack of disposable income to meet the needs of food, health, education, clothing, housing and transportation, even if the total household income is devoted to said needs. For urban areas (more than 15,000 inhabitants), the asset poverty fine corresponds to $ 2102.59 pesos. For rural areas, it is $ 1413.95 pesos. The asset poverty line was used for two primary reasons. The first involves the definition of this line, which incorporates many more elements. This is in contrast to the other two lines used in this methodology: that of food and capabilities. Additionally, asset poverty includes the population in poverty vis-á-vis both of these factorss. The second reason is relates to the sample size of the 2011 ENCAS. The objective of the survey is to identify the population in poverty and characterize its capital. Therefore, studying food poverty population, for example, would involve a fairly small sample size. Consequently, statistical inferences could necessarily be made with the same degree of confidence. Table 1 presents the imputation results°. According to the 2010 EN1GH, the percentage of people living in asset poverty is 51.2 %, while the figure obtained through the imputation of income in the 2011 ENCAS corresponds to 50.7%. This difference is not statistically significant, however1t. In Table 1 imputation results were also broken down by locality size, for which no significant differences were observed. Table 1 Imputation results Tamaño de localidad. Porcentaje de población en pobreza. Error estándar. ENIGH. ENCAS. ENIGH. ENCAS. 41.4 58.7 49.8 67.5 51.2. 38.1. 0.638 1.557 2.210 1.721 0.636. 3.530 3.220 3.550 1.900 1.860. Menos de 2,500 2,500 a 15,000 15,000 a 99,999 Más de 100,000 Total. 60.1 54.1 63.2. 50.7. Estadística z. Conclusión. -1.137 0.292 0.954 -1.723 -0.499. No significativa No significativa No significativa No significativa No significativa. Source: Sandoval (2013).. The food poverty line refers to the inability to meet one's nutritional needs as per a semi-standardized food basket. The capacity poverty fine, in addition to nutritional requirements, includes health and education needs. 9. Table 2 in Sandoval (2013).. I° The hypothesis test is based on the Taylor series expansion of random-variable ratio variance. See CONEVAL (2009) 2008. Application of Income-Povertv Measuring Methodologv and Hvoothesis Testing.. 57.
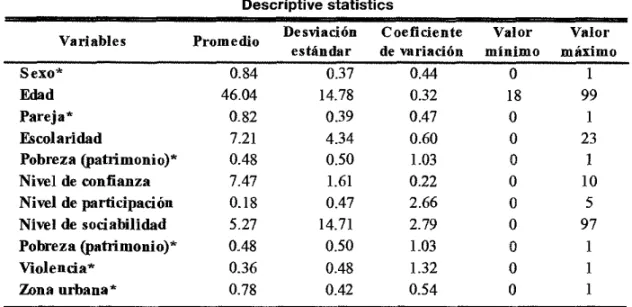
(12) SOCIAL CAPITAL IN LABOR MARKET ACCESS AND POVERTY IN MEXICO. 4. Empirical Evidence This section presents the results of the model described in the previous section, as well as a description of the most significant findings. It should be noted that the results only apply to bonding social capital, and with respect to effective help with finding work. Table 2 presents the descriptive statistics of the variables used in the probabilistic models11. It is noted that household heads are mostly men, at 84% of households. The average age is 46 years. 82% are married or in a common law relationship, and the average years of schooling is seven; i.e., they failed to complete secondary education. In addition to the model's sociodemographic variables, three other variables were included that estimate: confidence levels in organizations, groups or associations; participation rates in said groups; and the level of sociability in the surveyed population. Another two variables were also included: one for violence and another for urban context. These variables affect the use of networks, and consequently social capital, in different ways. For example, Huerta-Wong (2012) mentions that, in the case of Mexico, high levels of interpersonal trust, which occurs between close people, leads to greater participation of people in groups or associations and better feelings about the society in which an individual lives. This results in more interpersonal relationships, as well as increased social capital. By the same token, organizations, groups and associations generate an attachment value which people place on them. They also attract people with similar characteristics. This provides an opportunity to create social capital among people with shared characteristics who, had they not belonged to these organizations, would have never shared a link regardless of their similarity (Robison and Siles, 2012). This is how membership (or participation) in groups or associations promotes the development of social capital. Glaeser et al (2002) suggest that people who belong to groups, and who have more social capital, tend to Invest more in social capital for themselves. The effect of social networks on individual abilities, which are considered to be an approximation of social capital, is the result of social interaction. Therein rests the importance of people's sociability. Thus, it is to be expected that the more frequently an individual sees (more) people, the more solid their social capital becomes (López- Rodríguez and Soloaga, 2012). As mentioned aboye, confidence, participation levels and sociability are determinants of social capital. These three variables were estimated and included in the model as follows. The confidence variable was measured on a scale of 1 to 10. Confidence, as it relates to family, friends, neighbors, compadres and colleagues is a variable that, on average, has a value of 7.5. The participation variable was on a scale of O to 5 and assessed the participation levels of individuals in civic organizations, such as neighborhood groups, parent associations, unions, sports clubs and self-help groups. This variable had a mean value of 0.18. The sociability level variable was defined as an indicator ranging from O to 97, which refers to the number of persons, other than relatives or colleagues, with whom the respondent had met in the last month. For this indicator, a mean value of 5.27 was reponed. 11 The observations selected for these estimates correspond to interviewed heads of households. 58.
(13) WELL-BEING ANO SOCIAL POLICY VOL. 9 NUMBER 1, pp. 49-71. The violence variable has values zero and one, and is a context variable that captures other aspects that affect the decision of individuals; its incidence is 36%. This variable identifies whether the individual or any member of their household has been the victim of a crime so far that year or if someone in their borne had suffered violence during the reference period. The poverty variable contains values of zero and one. It identifies if the individual is in poverty based on asset income. It was noted that 48 percent'2 of the observations were in that category. Finally, the urban context variable has values of zero and one. It identifies the observations involving individuals living in cities with more than 2,500 inhabitants. 78% of respondents reported living in urban areas. Table 2 Descriptive statistics Promedio Desviación Coeficiente Valor Valor estándar de variación mínimo máximo Sexo* 0.84 0.37 0.44 1 0 Edad 46.04 14.78 0.32 18 99 Pareja* 0.39 0.82 0.47 I 0 Escolaridad 7.21 4.34 0.60 23 0 Pobreza (patrimonio)* 0.48 0.50 1.03 0 1 Nivel de confianza 7.47 1.61 0.22 0 10 Nivel de participación 0.18 0.47 2.66 0 5 2.79 Nivel de sociabilidad 5.27 14.71 0 97 0.50 Pobreza (patrimonio)* 0.48 1.03 0 1 Violencia* 0.36 0.48 1.32 1 0 Zona urbana* 0.78 0.54 1 0.42 0 Variables. Source: Author, using data from 2011 ENCAS. *Categorical variable.. Table 3 presents the results of multinomial logistic regression to model an individual's decision to use or forego bonding social capital for help in finding a job. The first column includes results, controlling only for individual characteristics. The second and third column contain context variables for an individual's levels of trust, participation and sociability are added, which capture other aspects of the aforementioned relationships. They are context variables, such as violence and locality size used in Model 3. Effects were considered at the regional level in other versions of the model (though not reported here), without any major changes. Due to sample size and the study domains of the survey it is impossible to include fixed effects at a greater level, municipal and/or local breakdown, and still have significance in these variables. In the case of schooling, López-Rodríguez and De la Torre (2012) show that the performance of social capital with respect to education has a parabolic behavior, explained by the opportunity costs of time that represent the use of networks by people with higher levels of schooling. Such behavior is observed in the results on the magnitude, more and less than one, of the coefficients of schooling and schooling squared, respectively. 12 This percentage of poor differs from the previous table because it corresponds to the population 18 years and over being interviewed, and because it uses the average (of 250 simulations) to calculate imputed income. Further details may be found in Sandoval (2013).. 59.
(14) SOCIAL CAPITAL IN LABOR MARKET ACCESS AND POVERTY IN MEXICO. An effect similar to that observed in education level occurs in the coefficients of age and age-squared, which are related to the effects of the life cycle as is the case in any other type of capital (Glaeser et al, 2002). Although the coefficient of the age variable suggests that older individuals use networks more often to seek employment, the coefficient of the quadratic variable shows that the consistency of network use reflects the life cycle; an issue which is evidenced repeatedly in the empirical literature. Based on the results, it appears that men are more likely to use social networks for employment than women. This is explained because men, given their role as the primary breadwinners in households in Mexico, are more involved in the labor market and therefore have more relationships through which to capitalize during job searches. However, being married or living with a partner reduces the likelihood of seeking employment through networks. One explanation for this is that these people look more formal jobs, and thus turn to the formal mechanisms of search. Additionally, a possibility lacking empirical evidence, is that being in this condition correlates to spending less time cultivating certain types of social networks. Transaction costs to seek employment by these mechanisms become increasingly higher, as a result. Of particular interest is the coefficient corresponding to poverty status. As can be seen, the population in poverty makes greater use of its capital to enter the labor market. Moreover, this effect is robust when the other control variables are included.. Table 3 Multinomial Mode! (Reference: no request for help) con controles de confianza y particpación. Modelo base. Modelo completo. Variable RRR*. Error estándar. RRR*. Sexo* Edad Edad al cuadrado Escolaridad Escolaridad al cuadrado Pareja Condición de pobreza Nivel de confianza Nivel de participación Nivel de sociabilidad Violencia Urbano* McFadden's adj R^2. Error estándar. RRR*. (2). (1) 6.9068. 0.1393 ***. 12.1563 1.1948 0.9979. 0.1043 *** 0.0014 ***. 23.6811. 1.2285. 0.0014 ***. 0.9976 1.0457. 0.0000 *5* 0.0030 ***. 1.0605. 0.0000 *** 0.0030 ***. 0.9845 0.0058. 0.0001 *** 0.0001 ***. 0.9812. 0.0002 ***. 0.9794. 0.0076. 1.3852. 0.0118 ***. 1.1300 1.1030. 0.0001 *** 0.0101 *** 0.0018 ***. 0.0033 1.1935 1.1137. 0.0367 *** 0.0010 *5*. 5.0734 1.0761. 3.2592 1.0698. 0.2110. 0.2510. 1.2292 0.9975 1.0118. Error estándar 0) 0.2244 *** 0.0015 *** 0.0000 *** 0.0028 *5* 0.0002 *** 0.0001 *** 0.0117 *** 0.0017 *** 0.0584 ***. 0.8470. 0.0011 *** 0.0063 ***. 9.0717. 0.0744 *** 0.3170. Significance levels *: 90%, **: 95%, and ***: 99%. RRR: Relative Risk Aversion (see Equation 3). Source: Authors' calculations based on 2011 ENCAS data. Note: The reference alternative is "no help requested". The coding of the dependent variable in this case corresponds to O and I.. 60.
(15) WELL-BEING AND SOCIAL POLICY VOL, 9 NUMBER 1, pp. 49-71. When including variables on levels of trust, participation and sociability in the model, higher levels of these variables are observed. The odds ratio between "no request for help" and bonding social capital use favors the latter. Moreover, including these variables shows that the model is robust to the specification, through its demonstration of a strong relationship between poverty and the use of social networks to find jobs. This indicates that trust is an important component of the concept of social capital. It also further reinforces the fact that social capital exists in social networks, which, in turn, increase in direct correlation to participation and sociability levels among individuals. Similarly, by including the violence variable in the model, which captures the context of insecurity, it is observed that if any act of violence is perceived in the colonia or town, or if an individual has been a victim of crime, the alternative most favored is "no request for help". That is, an environment of insecurity inhibits the use of bonding social capital because uncertainty limits interactions between people, among other things. Tables 4 and 5 break down bonding social capital into three groups according to the type of network through which help looking for a job was requested: 1) neighbors; 2) family and compadres /comadres; and 3) friends and coworkers. Table 4 uses the reference altemative "no request for help", as was the case in Table 3. Similarly, and with the idea of comparing the probabilities that an individual uses family help, as opposed to neighbors and friends, Table 4 changes the altemative reference to the family. In this table, the probabilities in relation to the "no request for help" altemative are omitted since they match the inverse of the corresponding coefficients in Table 3. In tercos of the age and education variable, no significant changes are observed with respect to previous results. The same overall behavior is observed with levels of trust, participation and sociability. While Table 3 shows that poorer populations make extensive use of social capital, when breaking down the network, it is the category corresponding to friends and coworkers that primarily captures the effect. If this idea is supplemented by the results in Table 5 and Figure 1, the odds first favor friends and colleagues, then family, and finally neighbors. Figure 1 is constructed based on the complete model (i.e., Column 3 of Figure 3). It is fixed to a reference individual (an average person), and the odds are calculated separately by considering said individual as poor and non-poor. The reference individual in this instance is a 46-year-old male (head of household) who did not complete his secondary education, does not participate in associations, visits five different people family per month during the survey period, whose confidence level is 7 on a scale of 10, who has not been the victim of a crime and who lives in an urban area where there has been no acts of violence.. 61.
(16) SOCIAL CAPITAL IN LABOR MARKET ACCESS AND POVERTY IN MEXICO Table 4 Multinomial Model (Reference: no request for help [Breakdown]) Familia y compadres. Vecinos. Variable RRR*. Error estándar. RRR*. (1) Sexo* Edad Edad al cuadrado Escolaridad Escolaridad al cuadrado Pareja Condición de pobreza Nivel de confianza Nivel de participación Nivel de sociabilidad Violencia Urbano*. 11.9399 1.6054 0.9949 1.0149. Error estándar. Amigos y compañeros de trabajo RRR*. (2). 0.1283 ***. 12.1298. 0.0026 *** 0.0000 ***. 0.9986. 1.0784. Error estándar. (3). 0.1210 *** 0.0013 ***. 63.6220. 0.6516 ***. 1.3173 0.9970 1.1348. 0.0017 *** 0.0000 ***. 0.0032 *** 0.0002 ***. 0.8974. 0.0000 *5* 0.0026 ***. 0.9830. 0.0002 ***. 0.9745. 0.0041 0.9676. 0.0001 ***. 0.0090. 0.0002 ***. 0.0013. 0.0101 *5*. 0.8987. 0.0090 ***. 1.9353. 0.0000 *** 0.0194 ***. 1.2621. 0.0023 *** 0.0612 ***. 1.1648 4.8942. 0.0019 *** 0.0566 ***. 0.9965 5.0732. 0.0016 *** 0.0587 ***. 0.0012 *** 0.0078 ***. 1.0959 0.6294. 0.0012 *** 0.0048 ***. 0.0700 ***. 11.9556. 0.1010 ***. 0.9828. 5.2170 1.0752 1.1860 5.9436. 1.0688. 0.0012 *** 0.0095 *5* 0.0530 ***. 1.0259 8.2623. 0.0033 *** 0.0002 ***. Significance levels *: 90%, **: 95%, and ***: 99%. RRR: Relative Risk Aversion (see Equation 3). Source: Authors' calculations based on 2011 ENCAS data. Note: The reference alternative is "no help requested". The coding of the dependent variable in this case corresponds to 0, 1, 2 and 3.. Table 5 Multinomial Model (Reference: family [Breakdown]). Variable. S exo* Edad Edad al cuadrado Escolaridad Escolaridad al cuadrado Pareja Condición de pobreza Nivel de confianza Nivel de participación Nivel de sociabilidad Violencia Urbano*. Vecinos. Amigos y compañeros de trabajo. RRR* Error estándar (1) 0.9843 0.0065 *** 1.4886 0.0016 *** 0.9963 0.0000 *** 1.1310 0.0019 *** 0.9998 0.0001 *** 0.4496 0.0031 *5* 1.0767 0.0050 *** 1.0835 0.0013 *** 1.0659 0.0034 *** 1.0059 0.0002 *** 1.1561 0.0046 *** 0.7194 0.0034 ***. RRR* Error estándar (2) 5.2451 0.0280 *** 1.2215 0.0006 *** 0.9984 0.0000 *** 1.2646 0.0016 *** 0.9913 0.0001 *** 0.1473 0.0008 *** 2.1535 0.0074 *** 0.8555 0.0006 *** 1.0366 0.0023 *** 1.0253 0.0001 *** 0.6135 0.0017 *** 1.4470 0.0052 ***. Significance levels *: 90%, **: 95%, and ***: 99%. RRR: Relative Risk Aversion (see Equation 3). Source: Authors' calculations based on 2011 ENCAS data. Note: The reference alternative is "family".. 62.
(17) WELL-BEING AND SOCIAL POLICY VOL, 9 NUMBER 1, pp. 49-71 Figure 1 Prediction of probability for changes in poverty. Predicción de probabilidades. Probabilidad. Pobre / No pobre. No pobre. Pobre. .11/11 NCS MEI Familia/Compadres. MI. Vecinos NUM Amigos/Compañeros tr.. Fuente: ENCAS 2011. Source: Authors' calculations based on 2011 ENCAS data. Note: Reference individual: jsexo=1, j edad=46, jedad2=2338, jpareja=1, jesc2=7, jesc22=70, confial ()al 0=7, part_nivel=0 sociable_nivel=5, violencia=0 and RurUrb=1.. In order to deepen the aboye analysis and understand more about the dynamics of social capital in access to the labor market, the following graphs illustrate the changes in the probability of choosing each of the alternatives by varying the age and level of education'3, as well as poverty status, separately, as was done in Figure 1. They do, however, employ the same reference individual. At any point in these graphs, the (vertical) sum of the probabilities is equal to one. As shown in Sandoval and Lima (2013), something really interesting is presented in the graphs covering changes in age (Graphs 2 and 3). Three clearly-evident stages are linked to the work cycle. At the beginning of the cycle, individuals use the help of family to get a job; but as they get older, ask friends and coworkers for help; as the years move on, they finally turn to neighbors. In the first stage, therefore, their first entry into the labor market is based on recommendations and support from their own family, as mentioned by Granovetter (1974). As the business cycle progresses, more opportunities come from friends and colleagues. People with whom they have established relationships and who are better apprised of their performance and productivity. However, support received from friends and co-workers reaches a maximum and decreases from approximately 50 years of age on. After 50, in the last stage, people start asking for help to get a job from neighbors. The latter is evidence that relationships with friends, and especially coworkers, weaken as people enter the last stage of life. As a consequence, their available networks are limited to those including neighbors. In other words, their social connections lose their strength and cease to be social capital. The latter is consistent with the inverted U which has been so amply documented in the literature (Glaeser et al 2002). It should be noted that this analysis is robust vis-á-vis poverty. While there are changes in the intensity (the likelihood) ofnetwork use between poor and non-poor, the three cycles remain unchanged. 13 An. analysis of other variables is available in Sandoval and Lima (2013) for models that do not address the poverty status of individuals.. 63.
(18) SOCIAL CAPITAL IN LABOR MARKET ACCESS AND POVERTY IN MEXICO. Figure 2 Prediction of probability for changes in age of individual living in non-poverty. Predicción de probabilidades Edad (no pobre). Edad NCS --o— Familia/Compadres •. Vecinos - Amigos/Compañeros tr.. Fuente: ENCAS 2011. Source: Authors' calculations based on 2011 ENCAS data. Note: Reference individual: jsexo=1, jedad2=2338, jpareja=1, jesc2=7, jesc22=70, confial_Oal0=7, part_nivel=0, sociable_nivel=5, violencia=0 RurUrb=1 and poblp3=0.. Figure 3 Prediction of probability for changes in age of individual living in poverty. Predicción de probabilidades. Probabilidad. Edad (pobre). 60. 40. 60. Edad NCS — e-- Familia/Compadres. --o-- Vecinos Amigos/Compañeros tr.. Fuente: ENCAS 2011. Source: Authors' calculations based on 2011 ENCAS data. Note: Reference individual: jsexo=l, jedad2=2338, jpareja=1, jesc2=7, jesc22=70, confial_0a10=7, part nivel=0, sociable_nivel=5, violencia=0, RurUrb=land poblp3=1.. 64.
(19) WELL-BEING AND SOCIAL POLICY VOL. 9 NUMBER 1, pp. 49-71. Finally, Figures 4 and 5 show that, at lower educational levels (years of schooling), the individual resorts more often to effective support from the family; but as schooling increases, the help is sought from friends and colleagues. However, the cross between these two categories manifests in lower levels of education for the population living in poverty. This demonstrates that the type of network that an individual turns to for help varíes according to educational level. Figures 4 and 5 Prediction of probability for changes in educational level, by condition of poverty Predicción de probabilidades Escolaridad. Predicción de probabilidades Escolaridad (pobreza). 5 -. 0. o_ _.___._.____.___. á. ¿. ._, l'O Escolaridad. NCS —e— Familia/Compadres. •_____I. 15. á. o. —e— Vecinos Amigos/Compañeros O.. 10 Escolaridad NCS Familla/Compadres. 15. 20. Vecinas Amigos/Competieres tr,. Fume: ENCAS 2011. Fuente: ENCAS 2011. Source: Authors' calculations based on 2011 ENCAS data. Note: Reference individual: jsexo=1, jedad2=2338, jpareja=1, jesc2=7, jesc22=70, confial_0al0=7, part_nivel=0, sociable_nivel=5, violencia=0, RurUrb=l and poblp3=0.. 5. Conclusions Currently, social capital is recognized as a multifaceted concept that refers to the ability of people to obtain and secure resources through social networks to which they belong, such that it is inherent to the structures of relationships. On the one hand, social networks play a fundamental role in the flow of information. From these links, people can capitalize on various types of help if need be; for example, job placement assistance. On the other hand, in developing countries, social capital is mainly manifested through interpersonal relationships that help them address poverty and vulnerability, by creating mechanisms and safety nets against contingencies, cushioning the risks, and smoothing consumption. Despite advances in the analysis of the relationship between social capital, the labor market and the welfare of individuals, there are still few empirical studies that have been conducted in the Mexican context; additionally, no study has addressed these three phenomena in tandem. Accordingly, this paper uses 2011 ENCAS data to provide empirical evidence of the phenomenon of social capital and its relation to access to the labor market and poverty in Mexico. Based on a logistic model employed to characterize labor market access, we find that the population in poverty makes greater use of its capital to find work. Moreover, this effect is robust when including other control variables that can affect people's decision-making: i.e., trust,. 65.
(20) SOCIAL CAPITAL IN LABOR MARKET ACCESS AND POVERTY IN MEXICO. level of participation and sociability; as well as variables that capture the level of insecurity and regional context in which they live. In particular, we find that the population in poverty primarily relies on friendships and colleagues, then their family and, lastly, neighbors. When confidence, participation and sociability levels are higher, the odds ratio favors "no request for help" over the utilization ofbonding social capital. In other words, trust is an important component of the social capital concept, as is held in the related theory. Also, the assertion that social capital consists of social networks, which, in tura, increase the levels of participation and sociability of people is further reinforced. It was observed that if any act of violence is perceived locally, or if a person has been a victim of crime, the alternative that is favored is "no request for help" from social networks. This is to say, an environment of insecurity inhibits the use of bonding social capital because uncertainty, inter alia, limits interactions between people. Finally, as shown in Sandoval and Lima (2013), three stages within the work cycle exist in which networks are used to find a new job. In the first stage, corresponding to an individual's entry into the labor market, support and recommendations come from the family. As the business cycle progresses, more opportunities come from friends and colleagues with whom they have established relationships that more accurately reflect the performance and productivity of job-seeking individuals. However, support from friends and coworkers reaches a maximum and decreases from approximately the age 50 on. After 50, in the last stage of life, people ask neighbors for help in order to find work. There are two limitations on the results presented in this paper. The first is that only bonding social capital was considered. Due to the characteristics of this study, it was impossible to extend the analysis to bridging and linking capital through the use of 2011 ENCAS data. It should be noted that said capital types would be expected to have certain peculiarities with regards to labor market access and are, as a consequence, well worth exploring. The second limitation involves the fact that it is impossible to determine the characteristics of the job which was found through the use of social capital. This is of particular interest to the population in poverty, whereas there exists a plausible reason to believe that these jobs are temporary and low-paid, which would mean that these individuals remain impoverished.. 66.
(21) WELL-BEING AND SOCIAL POLICY VOL. 9 NIJMBER 1, pp. 49-71. References Alesina, Alberto, Algan, Yann, Cahuc, Pierre and Giuliano, Paola. "Family Values and the Regulation. Elbers, Chris, Lanjouw, J., and Lanjouw P. "Micro-Level Estimation of Poverty and Inequality", Econometrica, 71 no. 1 (2003): 355-364.. of Labor", National Bureau of Economic Research, working paper 15747 (2010).. Fafchamps, Marcel and Minten, B. "Relationships Arrow, Kenneth. "Gifts and Exchange", Philosophy and Public Affairs, 1 (1972): 343-363.. and Traders in Madagascar", Journal of Development Studies, 35 no. 6 (1999): 1-35.. Bedi, T., Coudouel, A. and Simler, K. "More Than. Freitag, Markus, and Kirchner, Antje. "Social. a Pretty Picture. Using Poverty Maps to Design Better Policies and Interventions", Washington DC: The World Bank, 2007.. Capital and Unemployment: A Macro-Quantitative Analysis of the European Regions", Political Studies, 59 (2011):389-410.. Bentolila, Samuel, Michelacci C., and Suarez J.. Fukuyama, Francis. "Social capital, civil society and. "Social Contacts and Occupational Choice", Economica, 77 no. 305 (2010): 20-45.. development", Third World Quarterly, 22 no. 1 (2001): 7-20.. Glaeser, Edward L., Laibson, David, and Sacerdote, Bruce. "An Economic Approach to Social. Bourdieu, Pierre. "The Forms of Capital", en: Handbook of Theory and Research for the Sociology of Education. John G. Richardson, ed. Westport, CT: Greenwood Press, 1986, pp. 241-60.. Capital", The Economic Journal, 112 no. 483 (2002): F437-F458.. Chwe, Michael. "Structure and Strategy in Collective Action", American Journal of Sociology, 105 (1999): 128-156.. Granovetter, Mark S. "The strength of weak Cies",. Cingano F. and Rosolia, A. "People 1 know:. Granovetter, Mark S. "Getting a Job: A Study of. American Journal of Sociology, 78 no. 6 (1973): 1360-1380.. Workplace networks and Job Search Outcomes", Working Paper 600, Bank of Italy, Rome, (2006).. Contacts and Careers", Cambridge MA: Harvard University Press, 1974.. Coleman, James S. "Social Capital in the Creation of. Huerta-Wong, Juan Enrique. "Rendimientos del capital social en México: el papel de la confianza" ", en: Capital social y política pública en México, Patricia López-Rodríguez e Isidro Soloaga (comp.), El Colegio de México e Instituto Nacional de las Mujeres, primera edición, México, 2012.. Human Capital", American Journal of Sociology, 94 (1988): S95-SI20.. Comité Técnico para la Medición de la Pobreza (CTMP). "Medición de la pobreza: variantes metodológicas y estimación preliminar", en: Números que mueven al mundo, la medición de la pobreza en México, Miguel Székely (coordinador), Miguel Ángel Porrúa, México, 2005.. Krug, Gerhard and Rebien, Martina. "Job Search Via Social Networks. An Analysis of Monetary and Non-Monetary returns for Low-skilled Unemployment", IAB-Discuss ion Papen 23 (2011).. CONEVAL. "Aplicación de la Metodología para la Medición de la Pobreza por Ingresos y Pruebas de Hipótesis 2008", Consejo Nacional de Evaluación de la Política de Desarrollo Social, nota técnica, Coneval, México, julio, 2009. URL: http://web.coneval.gob.mx/ rw/resource/coneval/med pobreza/3495.pdf.. Lopez-Rodriguez, Patricia and De la Torre, R. "Social Capital in the Presence of MarketFailures", International Journal of Social Inquiry, 3 no. 1 (2012): 163-188.. López-Rodríguez, Patricia and De la Torre, R. "El Capital Social de los Pobres y su Acceso a los Mercados Formales", en: Capital social y política pública en México, Patricia López-Rodríguez e Isidro Soloaga (comp.), El Colegio de México e Instituto Nacional de las Mujeres, primera edición, México, 2012.. Cooley, Charles H. "Social Organization: A Study of the Large Mind", Transaction Publishers, New Brunswick, New Jersey, 1909.. Dasgupta, Partha. "The Economics of Social Capital", The. López-Rodríguez, Patricia and Soloaga, Isidro.. Economic Record, 81 no. 255 (2005): S2-S21.. "El capital social como fuerza de la política social" en: Capital social y política pública en México, Patricia LópezRodríguez e Isidro Soloaga (comp.), El Colegio de México e Instituto Nacional de las Mujeres, primera edición, México, 2012.. Delattre, E. and Sabatier, M. "Social Capital and Wages: An Econometric Evaluation of Social Networking Effects", Labour, 21 no. 2 (2007): 209-236.. 67.
(22) SOCIAL CAPITAL IN LABOR MARKET ACCESS AND POVERTY IN MEXICO McCrate, E. "Trade, merger and employment:. Rodríguez-Oreggia, Eduardo. "Capital Social y. Economic theory on marriage", Review of Radical Political Economics, 19 no. 1 (1987): 73-89.. Política Pública en México", en: Capital social y política pública en México, Patricia López-Rodríguez e Isidro Soloaga (editores), El Colegio de México e Instituto Nacional de las Mujeres, México, 2012.. Narayan, C. and D. Pritchett. "Cents and Sociability: Household Income and Social Capital in Rural Tanzania", Economic Development and Cultural Change, 47 no. 4 (1999): 871-897.. Sandoval, Héctor. "La pobreza y el capital social en México", (2013) mimeograph.. Portes, Alejandro. "Social Capital: Its Origins and Applications in Modero Sociology", Annual Renten, of Sociology, 1-24 (1998).. Sandoval, Héctor and Lima, Martín. "El capital. Putnam, Robert. "Bowling alone. The collapse and. Schmid, Allan A. and Robison, L. J. "Applications. revival of American Community", Nueva York: Simon and Schuster, 2000.. of Social Capital Theory", Joumal of Agricultural and Applied Economics, 27 no. I (1995): 59-66.. Reignold, D. "Social Networks and the Employment. Train, Kenneth. "Discrete Choice Methods with. social y el acceso al mercado laboral en México", (2013) mimeograph.. Problem of the Urban Poor", Urban Studies, 36 no. 11 (1999): 1907-1932.. Simulation", Cambridge University Press, second edition, 2009.. Robison, Lindon J. and Hanson, S. D. "Social. Woolcock, M. "Managing risk, shocks and opportunity. Capital and Economic Cooperation", Journal of Agricultura! and Applied Economics, 27 no. 1 (1995):43-58.. in developing economies: the role of social capital", en: Dimensions of development G. Ranis (editor), New Haven: Yale center for International and arca studies, 1999.. Robison, Lindon J. and Siles, Marcelo E. "Introducción al capital social y su paradigma", en: Capital social y política pública en México, Patricia LópezRodríguez e Isidro Soloaga (comp.), El Colegio de México e Instituto Nacional de las Mujeres, primera edición, México, 2012.. Woolcock, M. and Narayan, D. "Social capital: implications for development theory, research and policy", World Bank Research Observer 15 no. 2 (2000).. 68.
(23) WELL-BEING AND SOCIAL POLICY VOL 9 NUMBER 1, pp. 49-71. Appendix Imputation methodology It is important to note that the objective of imputation is not to calculate poverty in Mexico based on 2011 ENCAS data; instead, its purpose is to identify households in poverty ENCAS 2011 using the best methodology and information available in order to take advantage of the social capital information contained therein. Imputation methodology is widely used to map poverty, and it is significant that CONEVAL employed this approach to create poverty maps at the state and municipal level for its 2000 and 2005 surveys. The imputation method assumes that a well-being indicator (poverty incidence) depends on a variable of interest (per capita income). Using these two sources of information, one can obtain the joint distribution of income and a number of independent variables. The imputation process consists of a preliminary phase, in which variables are selected, and a second, which is a two-phase estimation of revenue and errors. The following briefly describes the steps using 2010 EN1GH and 2011 ENCAS'4. As noted, the preliminary step involves the selection of common variables between the two sources. This comparison is made through a comparison of questionnaires. Selected variables are subjected to statistical comparison of their distributions. In the case of the EN1GH and ENCAS, the conceptual and statistically-comparable variables may be grouped as follows: 1.Socio-demographic characteristics: household size and household-head characteristics such as age, sex and educational level. 2. Job characteristics: activity status, job position and derechohabiencia. 3. Housing and household characteristics: basic utilities/services, floor material, number of rooms and appliances/furniture. Additionally, it is possible to determine whether or not the household is a beneficiary of Procampo or Oportunidades social development programs. Regional fixed effects are incorporated at the municipal and state levels. Once comparable variables are identified and selected, a generalized least-squares regression model is estimated using ENIGH data. It uses the logarithm of per capita household income as a dependent variable and variables that are common to both sources as independent variables. The estimated parameters are then used to predict the log of per capita income for each household in the ENCAS, using the same independent variables considered in the ENIGH estimated-income model, although now selected in the ENCAS. Within this same stage, model errors are collected then used as another independent variable in the regression model. This procedure allows for estimates to be made regarding cluster effects and the heteroskedasticity pattern. This also provides an estimated matrix of variance-covariance perturbations, which is used to re-estimate the parameters using generalized least squares. This estimate corrects for biases in the previous estimate. 14 For a more detailed explanation of each step, see Bedi, Coudouel and Simler (2007), which presents various application of the methodology. In particular, the study includes an adaptation and implementation of the imputation method for Mexican context.. 69.
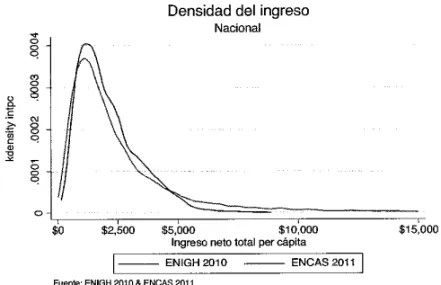
(24) SOCIAL CAPITAL IN LABOR MARKET ACCESS AND POVERTY IN MEXICO. The next step combines estimated parameters with observable characteristics for each household in the ENCAS in order to generate an income and simulate errors. For each household error terms and their corresponding simulated distributions are obtained. Finally, each household income is simulated, which is then used to estimate the incidence of poverty for each locality size, as well as for the total population. Further details about the outcome of the models and variables used are available in Sandoval (2013). Figures Al to A3 show the distribution of the total per capita net income from the 2010 ENIGH, which imputed to households in 2011 ENCAS at a national, urban and rural Level. In the case of figures involving locality size, the dotted line shows the value of the corresponding poverty fine. 250 different income distributions were obtained by using the imputation process. The graphs show the average income of these simulations. In two locality-size graphs slight differences in the distributions are observed. In particular a rightward trend is apparent on the imputed income distribution of urban, as well as a higher density right before the poverty line in rural aneas. However, these differences are attenuated when taking national distribution into account. Finally, it should be noted that the imputed income bracket is less than observed income in the upper part of the distribution. I.e., imputation adjusts better for low-income populations, but not to for high income. This has important implications for the identification of the population in poverty.. .0002 .0003 .0004. Figure Al Distribution of observed and imputed total net income per capita. Densidad del ingreso Nacional. E o o. o $10,000 $5:000 Ingreso neto total per capita ENIGH 2010. ENCAS 2011. Fuente: ENIGH 2010 0 ENCAS 2011. Source: Authors' calculations based on 2010 ENIGH and income imputed to 2011 ENCAS. Note: Imputed income is the average of the simulations resulting from the imputation process.. 70.
(25) WELL-BEING AND SOCIAL POLICY VOL. 9 NUMBER 1, pp. 49-71 Figures A2 and A3 Distribution of imputed and observed total per capita net income, at urban and rural level.. $0. $2,102.59. Densidad del ingreso. Densidad del ingreso. Urbano. Rural. $5,000 $10,000 Ingreso neto total per capita ENIGH 2010. fuente: ECOS. $15,000. ENCAS 2011. $O $1,413.95. $5,000 $10,000 Ingreso neto total per cápita ENIGH 2010. 10 & ENCAS 2011. ENCAS 2011. Fuente: ENION 2010 & ENCAS 2011. Source: Authors' calculations based on 2010 ENIGH and income imputed to ENCAS 2011. Note: The imputed income is the average of the simulations resulting from the imputation process.. 71. $15,000.
(26)
Figure
Documento similar
The 15-M movement, advanced in the use of the social network as the main communicative and organisational tool (both in its internal sphere and in its relation to external
In this study, we pretend to evaluate if support programs aimed at combating poverty through the creation and implementation of specific human capital development actions, such as
In this study, we examine the effect of unemployment on the satisfaction in five domains of life; work or main activity, financial situation, housing situation, leisure time and
In this work, the Spanish labor market was analyzed through the labor force survey (EPA) from a gender perspective, demonstrating the existing inequalities at the labor level,
For instance, in Italy, there is some association between local labor market conditions, such as the unemployment rate, and labor courts’ decisions (Macis, 2001, Ichino et
50 The goal is to help people to reach an optimum level in the dimensions of psychological well- being: environmental mastery, personal growth, purpose in life,
Past research seems to suggest that network social capital should emerge in networks in which social participation is organized through three mainly relational norms: in networks
within the last 5 years, indicating that most of our patients had access to modern PAH agents through the market as well as clinical trial enrollment. Treatment
