Geometrical and optical parameters of tropopause cirrus clouds in the Southern Hemisphere
11
0
0
Texto completo
(2) Vol. 11 (2011): 45-54. ISSN 1578-8768. c Copyright of the authors of the article. Reproduction and diffusion is allowed by any means, provided it is done without economical benefit and respecting its integrity. Geometrical and optical parameters of Tropopause Cirrus Clouds in the Southern Hemisphere S. Gabriela Lakkis1,2 , Mario Lavorato3,4 and Pablo Canziani2,5 1. 2. Facultad de Ciencias Agrarias, Pontificia Universidad Católica Argentina (UCA). [email protected]. Equipo Interdisciplinario para el Estudio del Cambio Global (PEPACG, Pontificia Universidad Católica Argentina (UCA) 3 4. División Radar Laser, CITEDEF - MINDEF. Grupo TAMA, Universidad Tecnológica Nacional-Facultad Regional de Haedo, (UTN-FRH) 5. Consejo Superior de Investigaciones Científicas y Técnicas (CONICET) (Received: 18-Mar-2011. Published: 16-Jun-2011). Abstract We analyzed the mean optical properties of southern hemisphere midlatitude tropopause cirrus, such as optical depth, extinction coefficient and lidar ratio using lidar observations and calculations based on the Klett’s method. The lidar signals show that the tropopause cirrus have thicknesses ranging between 1.5-4 km with a mean extinction coefficient and lidar ratio of about 0.15 km−1 and 20 sr for cirrus measured in 2001-2006. The values reveal that the parameters are close to those reported from other midlatitudes researches. The temperature dependence of the cirrus extinction/optical depth has been represented in order to compare with recently published papers. Comparison of the results of the present analysis with other tropical and midlatitude cirrus studies reveals that these cirrus have remarkable characteristics that may be related to their crystal composition, size, longevity and with the prevailing dynamical process at this southern midlatitude and thus with the geographical and meteorological conditions. Key words: tropopause cirrus, extinction and backscatter coefficient.. Resumen En el presente trabajo se analizan las principales propiedades ópticas de las nubes cirrus de la tropopausa, tales como el espesor óptico, coeficiente de extinción y atenuación, por medio de observaciones realizadas por un lidar y calculadas partiendo del método de Klett. Las señales analizadas muestran cirrus con espesores que varían entre los 1.5-4 km, con valores medios de extinción y radio lidar cercanos a los 0.15 km−1 y 20 sr para cirrus medidos en el período 2001-2006. Los resultados revelan que estos parámetros tienen valores cercanos a los obtenidos en otras latitudes estudiadas. La dependencia de estos parámetros respecto de la temperatura también ha sido analizada con el propósito de ser comparada con resultados de publicaciones recientes. La comparación con valores procedentes de latitudes tropicales y medias revela que los cirrus analizados en nuestro caso muestran características distintivas que pueden atribuirse a la diferente composición en sus cristales, tamaño, longevidad y la propia dinámica de los procesos de formación para estas latitudes con condiciones geográficas y meteorológicas particulares. Palabras clave: cirrus de la tropopausa, coeficientes de extinción y atenuación.. 1. Introduction Cloudiness has a large influence on solar radiation. Particularly, the cirrus clouds are well positioned in the upper troposphere with ubiquitous and widespread nature composed of ice crystals and covering near of 30 % of the Earths surface. Thereby, they have a huge influence on the radiation budget and induce.
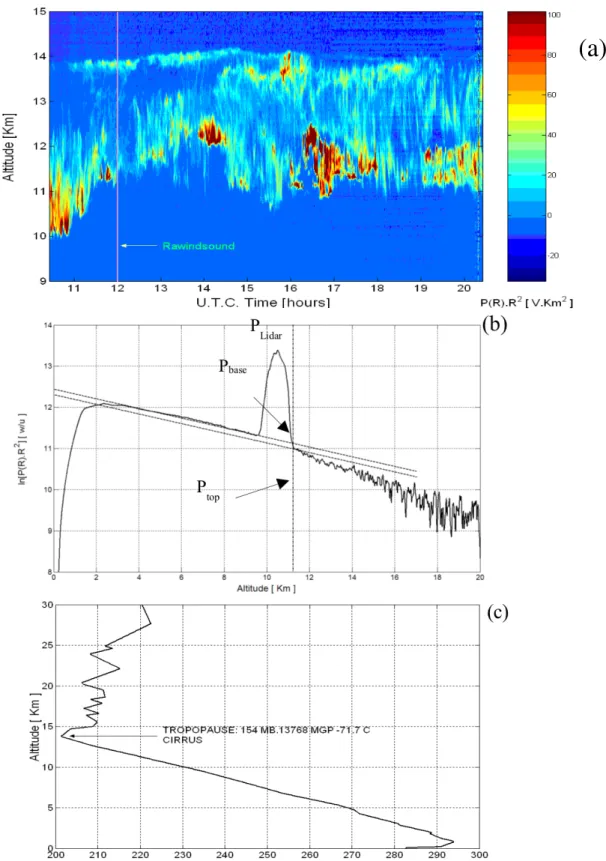
(3) 46. R EVISTA DE C LIMATOLOGÍA , VOL . 11 (2011). various climate feedbacks which can not be overlooked (Stephens et al., 1990). Properties of tropical cirrus are distinctly different from those of the midlatitudes. While the cirrus clouds form at higher altitudes where temperatures are much lower, are usually termed as cold cirrus, its counterpart in midlatitudes forming at relatively lower altitudes associated with comparatively higher temperatures are called warm cirrus (Sunilkumar and Parameswaran, 2005). Due to the high altitude of the cirrus clouds and the need to obtain time series measurements, direct in situ measurements of their microphysical properties are a difficult task that cannot be pursued on a systematic basis. Because of their large horizontal and vertical extensions, these systems have a large-scale impact on radiation budget of the planet’s surface and atmosphere (Hartmann et al., 1992). Although the satellite observations provide valuable information on cirrus clouds, more detailed studies require data with high temporal and spatial resolution to supplement them. Ground-based lidars have been widely used to study high temporal and spatial structure of cirrus in tropics and midlatitudes. Clouds measurements derived from lidar systems at various height regions have attracted increasing attention recently due to their role in modulating the fluxes of incoming short wave and outgoing longwave radiation (Wylie et al., 1994). Lidars are very useful in deriving the optical properties of the clouds. The optical extinction of clouds is an important key parameter in radiative transfer analysis and therefore considerable efforts have been put in its retrieval (Platt and Dilley, 1984). On the other hand, the sign and magnitude of cirrus radiative forcing depends on cloud altitude and the cirrus optical depth which is a function of the effective ice crystal radius, and the number concentration of ice crystals (Fu and Liou, 1993). Lidar systems constitute a powerful tool to analyse the temporal and spatial evolution of the atmospheric aerosols as well as chemical and physical properties of clouds components (Wang et al., 2005). In the present study, the characteristics of tropopause cirrus clouds detected with a lidar in the southern midlatitudes located at Buenos Aires (34.6◦ S, 58.5◦ W) are presented and discussed in terms of their optical depth, extinction coefficient and lidar ratio, considering multiple scattering effects.. 2. Experiment System and Measurements The elastic backscatter lidar located in Buenos Aires is described in detail in an earlier communication (Lakkis et al., 2010). Cirrus properties derived from lidar implies solving essentially the standard lidar equation: Z z β(z) P(z) = A 2 exp[−2 α(z0 )dz0 ] z 0 where P(z) is the measured lidar return signal, A being the constant derived from the calibration process, and β(z) and α(z) are the volume backscatter and extinction coefficient of the atmosphere. The quantities β(z) and α(z) consist of parts of the cloud as well as the atmosphere: β(z) = βr (z) + βc (z) and α(z) = αr (z) + αc (z), where r and c represent air and cloud respectively. The single scattering lidar ratio is defined as LR = αc /βc , while the optical depth is defined as: Z ztop. τ= zbase. α(z0 )dz0 =. Z ztop. LR(z0 )β(z0 )dz0. zbase. where ztop and zbase represent the height of the cloud top and base respectively. In this paper, we define the mid-cloud temperature as the temperature in the midcloud height. Figure 1 shows a height-time cross section of cirrus cloud collected in August, 2001. In principle, the scattering loss in the cloud can be determined by comparing the backscattering signals just below and above the cloud if the lidar signals correctly represented the scattering medium. This requirement is sometimes not satisfied due to problems of the receiver system as saturation in the detector, the electronics system or by the perturbations in the atmosphere (the presence of particles in the air as well as fog and low cloudiness). Figure 1(a) and (c) show an example of cirrus clouds analyzed and tropopause height obtained from rawinsonde data..
(4) R EVISTA DE C LIMATOLOGÍA , VOL . 11 (2011). 47. Figure 1(b) shows a fit of the scattering signals to a simulated lidar backscattering signal. The fitting warranted the linear response of the received signal with the simulated signal outside the cloud. The backscattering signals at the cloud top Ptop and the base Pbase in this example should then correctly express the scattering signals at the cloud region as shown in Figure 1(b).. (a). Figure 1: (a) Example of cirrus measurement during 2001-2006: August 2001 Range-corrected 532 nm signals with 50 s and 6 m resolution; (b) Tropopause detection by the lidar; and (c) tropopause value derived from rawinsonde..
(5) 48. R EVISTA DE C LIMATOLOGÍA , VOL . 11 (2011). Most of the methods that have been developed to solve the lidar equation are related to each other, depending on how they solve the standard lidar equation and on the fact that there are generally two unknowns, β and α, which must be resolved somehow, either empirically or theoretically, in order to invert the lidar equation (Klett, 1981). However, it is important to note that recent papers, as well as this one, are based on Klett’s concept as the starting point for further developments (Klett, 1981 and 1985). In this study a set of 65 diurnal cirrus profiles measured with the lidar during 2001-2006 were analyzed. Each diurnal tropopause cirrus observation lasting from few minutes to up to nine hours, was collected at 532 nm laser-wavelength and represents a time integration that corresponds to 500 laser shots. Calibrating was performed by using the mean molecular number density profile derived from the daily radiosonde data, considering the hour nearest to the measurement. The meteorological parameters used to determine the cloud temperature and height values were provided by the Argentine Servicio Meteorológico Nacional (SMN). The SMN data set used in this study is restricted to 00 UTC and 12 UTC when they are available. With the aim to classify the cirrus as tropopause cirrus, here we have considered the tropopause definition given by the World Meteorological Organization (WMO). This is defined as the lowest boundary of an atmospheric layer in the upper troposphere in which the temperature lapse rate is less than 2◦ C km−1 and this layer has to be at least 2 km thick (WMO, 1992). In order to reject the spurious data dominated by noise or due to the presence of low level cloudiness, the lidar signals inverted using Klett’s method were selected, using the threshold condition for the signal to noise ratio to exceed 2. This condition, though somewhat arbitrary, almost clearly distinguishes the end of the cirrus signal from other fluctuations. For clouds of large optical depth the MS effect needs to be considered, which will produce a change to the backscattering coefficient and the lidar ratio. This effect depends on factors including laser penetration depth, the cloud range or height, field of view of the receiver, particle size distribution, and crystal shapes (Sassen and Cho, 1992; Eloranta, 1998; Hogan and Illingworht, 2003). The receiver field of view of our lidar is close to 1.5 mrad and thus, the results might be considerably influenced by multiple-scattering. This effect is caused by strong forward scattering of laser light in the cirrus and therefore leads to an underestimation of the effective optical depth, which can vary up to 50%. The effective values of the optical depth, layer mean extinction coefficient and lidar ratio could be a factor of 1.2-2 lower than the desired, single scattering-related values (Seifert et al., 2007). The strength of this underestimation depends on cloud height, cloud depth, scattering coefficient, size of the particles, laser beam divergence and receiver field of view of the lidar (Seifert et al., 2007; Wandinger, 1998; Sassen and Comstock, 2001). Several analyses from Platt (1978), have laid out approaches for quantifying and correcting for the effects of MS and how the correction factor must be performed. Platt and Dilley (1984) reported that the multiple scattering correction factor , varies from 0.55 to 0.75 as the cloud temperature increases. More recently, Yang et al. (2010), pointed out that the multiple scattering factor ranges from 0.45 to 0.6. Considering the large variability and uncertainty in the reported value of η, and bearing in mind we are dealing with midlatitude cirrus clouds with OD < 0.3 and temperature values close to -60◦ C (Sunilkumar and Parameswaran, 2005), a MS factor η = 0.55 with an uncertainty of ±0.11, is applied in the present analysis in order to correct the effective values of the retrieved optical properties (Platt and Dilley, 1984; Platt et al., 2002; Yang et al., 2010). In cases of a vertically pointing laser beam, as our lidar system is, horizontally oriented ice crystals act like small mirrors and thus may cause a large backscatter signal due to specular reflection. Including the errors in the lidar signals inversion associated with the uncertainty ≈ 10-15% in the molecular backscatter coefficients and specular reflection influence, the total error in the derived values considered as the standard deviation, would be close 20% which produces an uncertainty for the optical depth about 10 ∼ 30% depending on the optical depth (Seifert et al., 2007)..
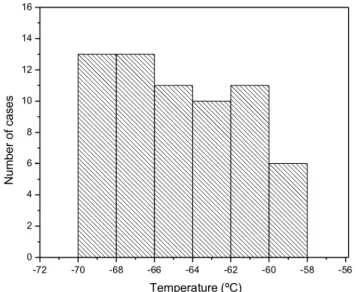
(6) 49. R EVISTA DE C LIMATOLOGÍA , VOL . 11 (2011). 3. Results and Discussion Tropopause cirrus clouds measured between 2001-2006 were analyzed. Here we present a set of 65 data points. The occurrence height of this tropopause cirrus is confined to 10-14 km, with mean thicknesses ranging from 1.5-2.5 to 3-4 km (Table 1). At midlatitudes the occurrence height of thin cirrus is mostly between 8.5-11.5 km (Jansen et al., 1996; Heymsfield and McFarquhar, 1996). Results derived from different studies at midlatitudes, carried out by Ansmann et al. (1992), Sassen and Comstock (2001), Wang and Sassen (2002), Reichardt et al., (2000), show that top heights were found most frequently from 11-13 km, with mean thicknesses around 1.8-2.5 km. Moreover, Immler and Schrems (2002), show a comparison between 55◦ N, 53◦ S, and found that mean thickness value is confined to 1.2 and 1.4 km for Prestwick (NH) and Punta Arenas (SH), respectively. Thus, the thickness of the cirrus clouds derived from our lidar system imply cirrus cloud thickness greater than the above reported value for midlatitude thin cirrus. The distribution of cirrus occurrence with cloud temperature for the dataset under study displayed a first maximum between -70◦ and -66◦ C (Figure 2).. Table 1: Mean single scattering values and Standard Deviation (Parentheses) of Cloud Properties.. Location Cloud base height (km) Cloud top height (km) Cloud thickness (km) Distance to tropopause (km) Cloud top temperature Tropopause temperature Optical Depth Extinction (km−1 ). Buenos Aires. Punta Arenas (Immler and Schrems, 2002). Prestwick (Immler and Schrems, 2002). 34.6◦ S, 58.5◦ W 9.63 (0.92) 11.82 (0.86) 2.41 (0.95) 0.38 (0.25) -64.5 (3.6) -60.6 (4.7) 0.29 (0.09) 0.54 (0.12). 53.1◦ S, 71◦ W 8.0 (7.9) 9.5 (9.8) 1.4 (1.1) 1.7 (1.7) -49 – 0.27 (0.08) 0.19 (0.06). 55.5◦ N, 4.6◦ W 8.3 (8.5) 9.6 (10.1) 1.2 (0.8) 1.0 (0.8) -48 – 0.28 (0.11) 0.20 (0.12). SLC (OctDec meansr; Sassen and Campbell, 2001) 41◦ N, 112◦ W 8.9 11.1 1.9 0.4 -56 – 0.42 –. INDOEX (Seifert et al.,̧ 2007). 4.1◦ N, 73.3◦ E 11.9 (1.6) 13.7 (1.4) 1.8 (1.0) – -65 (11) -81 (4) 0.28 (0.29) 0.09 (0.09) 0.15 (0.10). The mean single scattering values of cirrus optical depth, (OD) and extinction coefficient (α) of cirrus derived from lidar data are used to study their temperature dependencies, which is an important factor in accessing their radiative impacts. Figures 3 (a) and (b) show the scatter plot of OD and α with T . Note that the scatter plot of OD lacks some points plotted in the extreme values of the temperature range. These values have not been considered due to their high standard deviation with regard to the whole sample. The single-scattering optical depths are found to extend over a range of 0.15 to 0.45 with peak occurrence confined to a narrow range of 0.2 to 0.3. According to the classification given by Sassen and Cho (1992), the analysis shows that in more than 80% of cases the tropopause cirrus measured are thin cirrus (TC), with 0.03<OD<0.3. These results are in agreement with previous analyses of cirrus clouds with lidar that show thin cirrus clouds seem to be present at midlatitudes in a greater percentage than thick or opaque cirrus clouds (Seifert et al., 2007). The variability on the optical depth depends on the nature of the composition and the thickness of the clouds (Platt and Harshavardhan, 1989; Sassen and Dodd, 1989; Sassen and Benson, 2001; Jansen et al., 1996). The optical depth is a function of three basic values: the cloud thickness, the density of the particles and the mean particle size (Immler and Schrems, 2002)..
(7) 50. R EVISTA DE C LIMATOLOGÍA , VOL . 11 (2011). Figure 2: Distribution of number of cases (65) vs temperature.. 0,28. (a). 0,25. Optical Depth. 0,22 0,19 0,17 0,14 0,11 0,08 0,06 -75. -70. -65. -60. -55. -50. -45. -40. -35. Mid-Cloud Temperature (ºC) 4,62x10. -5. 4,23x10. -5. 3,85x10. -5. b. Figure 3. Scatterplot of single scattering values of (a) optical depth and 3,46x10 -5. 3,08x10. -5. 2,69x10. -5. 2,31x10. -5. -75. -70. -65. -60. -55. -50. -45. -40. -35. Mid-Cloud Temperature (Cº). 3 (b) cloud extinction midcloud Figure 3: Scatterplot of singleFigure scattering values of (a) with optical depthtemperature. and (b) cloud extinction with midcloud temperature..
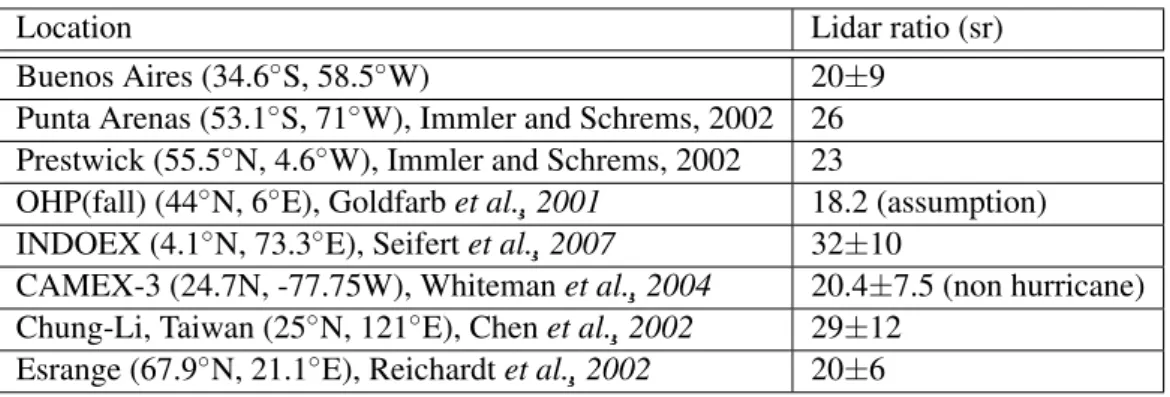
(8) R EVISTA DE C LIMATOLOGÍA , VOL . 11 (2011). 51. The distribution of the mean single-scattering extinction coefficient, representing the average over the cloud extent displays maximum values between 5.8 − 6.5 · 10−4 m−1 . The distribution of the MScorrected lidar ratio show a maximum occurrence at around 20 sr (Table 2, first row). As Immler et al. (2007) noted “tropical cirrus have systematically a higher lidar ratio than midlatitude ones”. Moreover, Mergenthaler et al. (1999) pointed out that LR of 18.2 sr is proper considering lidar measurements (1978-1980) in the Southern Hemisphere (Platt and Dilley, 1984). Nonetheless, results given in the above sentences show smaller values of lidar ratio. These low values, could arguably be attributed to different factors: first of all, the very unequal land water distribution in the latitude range under study contributes to the high occurrence of these clouds; in addition, the Andes mountain range, with an average height close to 6000 meters, is a knife-edge obstacle that disrupts the horizontal quasi-westerly flow of the air mass over the Pacific Ocean; on the other hand, the multiple scattering (MS) and specular reflection effects, which in general lead to an underestimation of the extinction to backscatter ratio values, which ranges between 10-30% (Sunilkumar and Parameswaran, 2005). As was mentioned above, according to Hogan and Illingworht (2003) the occurrence of specular reflection appears to be mostly confined to height between 2.5 and 5.5 km with a temperature range -23 to -9◦ C. Thus, because due to the cirrus cloud heights (tropopause cirrus) analyzed in the present work are above the height range most influenced by this effect (Hogan and Illingworht, 2003), and the fact that specular reflection has its major influence at any temperature range up to -70◦ C, the mean single scattering lidar ratio of our data may be influenced by specular reflections. A properly quantification of the errors induced by this effect would require more in situ measurements from our system. The lidar ratio values obtained may be compared with other studies. An overview of the optical properties of the present campaign compared with measurements derived from lidar system at other latitudes are shown in Table 2, where the factor is applied for extinction to backscatter values. Whiteman et al. (2004), carry out an analysis at the Andros Islands (25◦ N, August-September 1998), Bahamas. When they excluded hurricane-influenced observations, they found a steady increase from about 15-17±10 sr at -30◦ C over 22±8 sr at -50◦ C to 28-33±12 sr at temperatures around -70◦ C. When considering the hurricane-influenced cases the mean lidar ratios decreased to values of roughly 15-22 sr for the temperature range from -60◦ C to -80◦ C. Seemingly, the presence of convection seems to lower the lidar ratio. The lidar ratios were mostly in the range from 10-40 sr (mean values of 20±8) over the Andros Islands. Similar lidar ratios as observed during INDOEX were also derived from lidar observations in Taiwan (25◦ N) presented by Chen et al. (2002). About 90% of their measured, multiple scattering corrected values, were ≤50 sr. In the height ranges from 12-15 km (-50◦ C to 70◦ C) they found lidar ratios of about 35±15 sr. For heights between 15-16 km (-73±3◦ C), the mean lidar ratio was 20±8 sr. Observations over Utah revealed mean values of about 35, 27, 22, 22, and 21 sr for optical depth around 0.12, 0.25, 0.5, 1, 1.2, and 2.5, respectively. Immler et al. (2007) argued that “the reason for the shift of the lidar ratio with latitude is currently unknown”. Differences in particle size and shape are possible explanations. Alternatively, a change of the properties of the interstitial aerosol could also have an appreciable influence on the measured optical properties of optically thin ice clouds. Generally, the ice crystal size is known to decrease with altitude. Since cirrus altitude increases with decreasing latitude this trend could explain the change in cirrus lidar ratio. It is interesting to highlight that in spite of the different geographical locations besides the possible different definitions of a single cirrus cloud layer used as well as the approach to correct for multiple scattering effects and system setups, our results are close to the reported ones by Chen et al. (2002), Immler et al. (2007), and Whiteman et al. (2004), in presence of hurricane..
(9) 52. R EVISTA DE C LIMATOLOGÍA , VOL . 11 (2011). Table 2: Mean single scattering value and Standard Deviation (Parentheses) of lidar ratio. Location Buenos Aires (34.6◦ S, 58.5◦ W) Punta Arenas (53.1◦ S, 71◦ W), Immler and Schrems, 2002 Prestwick (55.5◦ N, 4.6◦ W), Immler and Schrems, 2002 OHP(fall) (44◦ N, 6◦ E), Goldfarb et al.,̧ 2001 INDOEX (4.1◦ N, 73.3◦ E), Seifert et al.,̧ 2007 CAMEX-3 (24.7N, -77.75W), Whiteman et al.,̧ 2004 Chung-Li, Taiwan (25◦ N, 121◦ E), Chen et al.,̧ 2002 Esrange (67.9◦ N, 21.1◦ E), Reichardt et al.,̧ 2002. Lidar ratio (sr) 20±9 26 23 18.2 (assumption) 32±10 20.4±7.5 (non hurricane) 29±12 20±6. 4. Conclusion Geometrical and optical properties of cirrus clouds observed over Buenos Aires are investigated using a Rayleigh lidar system. The top of the cirrus clouds stays aligned very closely with the tropopause, as well as a good agreement between lidar height retrievals and rawinsonde thermal tropopause heights, with a confidence range of 0.5 km. Cloud height values show a maximum occurrence in the narrow 11.513.0 km range, while their thickness is not always as narrow as was generally accepted in the current understanding. In fact, the cloud average thickness derived from our lidar system is ∼2.4 km when the temperature is in the range -70◦ to -60◦ C. Regarding the extinction coefficient there is a maximum in the narrow 3.2-3.6 ·10−4 m−1 range, with an average value of about 3.0 ·10−4 m−1 . Table 2 reveals values for lidar ratio close to 20 sr. Comparisons of the results of the present analysis with other tropical and midlatitude cirrus studies were presented. Observed differences in the properties with on average smaller values for optical depth, extinction coefficient and lidar ratio but remarkable greater thickness were found. They may be explained by different factors such as geographical conditions, mechanism forms and probably by the local prevailing dynamical processes. These differences could also be responsible of the probably different particle size and composition of the cirrus clouds at this latitude range, which must be further investigated. Table 1 and 2 summarize the representative values for the tropopause cirrus clouds under study and the comparison between other recent research of tropical and midlatitudes cirri. The observed differences in the lower values for the optical properties and higher values of thickness compared with other lidar studies at midlatitudes can be mainly due to geographical differences in the microphysical contents of the tropopause cirrus clouds, dissimilarities in the formation mechanism, and nature and source of cloud particle forming nuclei. A clear picture of the exact physical process and a complete overview of these southern midlatitude cirrus clouds located close to the tropopause layer can emerge only through higher number of in situ measurement, in future campaigns. Acknowledgements The authors wish to thank the Pontificia Universidad Católica, Facultad de Ciencias Agrarias, the Consejo Nacional de Investigaciones Científicas y Tecnológicas (CONICET) PIP 2004 5276, the Centro de Investigaciones Científicas y Técnicas para la Defensa (CITEDEF) PIDEF 023/08, for Lidar System support and also to the Universidad Tecnológica Nacional, Facultad Regional Haedo. References Ansmann A, Wandinger U, Riebesell M, Weitkamp C and Michaelis W (1992): Independent measurement of extinction and backscatter profiles in cirrus clouds by using a combined Raman elasticbackscatter lidar. Appl. Opt., 31:7113-7131. Chen WN, Chiang CW and Nee JB (2002): Lidar ratio and depolarization ratio for cirrus clouds. Appl. Opt., 41:6470-6476..
(10) R EVISTA DE C LIMATOLOGÍA , VOL . 11 (2011). 53. Eloranta EW (1998) Practical model for the calculation of multiply scattered lidar returns. Appl. Opt., 37:2464-2472. Fu Q and Liou KN (1993) Parameterisation of the radiative properties of cirrus clouds. J. Atmos. Sci., 50:2008-20025. Hartmann DL, Ockert-Bell ME and Michelsen ML (1992): The effect of cloud type on earth´s energy balance: Global analysis. J. Climate, 5:1281-1304. Heymsfield AJ and McFarquhar GM (1996): High albedos of cirrus in the tropical Pacific warm pool: Microphysical interpretations from CEPEX and from Kwajalein, Marshall Islands. J. Atmos. Sci., 53:2424-2450. Hogan RJ and Illingworht AJ (2003): The effect of specular reflection on spaceborne lidar measurements of ice clouds. Report for the ESA Retrieval algorithms for EarthCARE project. Available at: http://www.met.rdg.ac.uk/clouds/publications/specular.pdf Immler F and Schrems O (2002): Lidar measurements of cirrus clouds in the northern and southern midlatitudes during INCA (55◦ N, 53◦ S): A comparative study. Geophys. Res. Lett., 29(16), 1809, doi:10.1029/2002GL015077. Immler F, Krüger K, Tegtmeier S, Fujiwara M, Fortuin P, Verver G, and Schrems O (2007): Cirrus clouds, humidity, and dehydration in the tropical tropopause layer observed at Paramaribo Suriname (5.8◦ N, 55.2◦ W). J. Geophys. Res., 112:Do3209, doi:10.1029/2006JD007440. Jansen EJ, Owen BT, Selkirk HB, Spinhirne JD, Scheberl MR (1996): On the formation and persistence of subvisible cirrus clouds near the tropical tropopause. J. Geophys. Res., 101:361-375. Klett JD (1981): Stable analytical inversion of multiply scattered lidar return. Appl. Opt., 20:211-220. Klett JD (1985): Lidar inversion with variable backscatter/extinction ratios. Appl. Opt., 24:1638-1643. Lakkis SG, Lavorato M and Canziani PO (2010): Tropopause and Cirrus Clouds Tops Heights. Revista de Climatología, 10:21-27. Mergenthaler JL, Roche AE, Kumer JB and Ely GA (1999): Cryogenic Limb Array EtaIon Spectrometer observations of tropical cirrus. J. Geophys. Res., 104:22183-22194. Platt CMR (1978): Lidar Backscatter from Horizontal Ice Crystal Plates. J. Appl. Meteor., 17:482-488. Platt CMR and Dilley AC (1984): Determination of the cirrus particle single-scattering phase function from lidar and solar radiometric data. App. Opt., 23:380-386. Platt CMR and Harshavardhan (1989): Temperature dependence of cirrus extinction: Implications for climate feed back. J. Geophys. Res., 93:11051-11058. Platt CMR, Young SA, Austin RT, Patterson GR, Mitchell DL and Miller SD (2002): LIRAD Observations of Tropical Cirrus Clouds in MCTEX. Part I: Optical Properties and Detection of Small Particles in Cold Cirrus. J. Atmos. Sci., 59:3145-3162. Reichardt J, Hess M, Macke A (2000): Lidar inelastic multiple-scattering parameters of cirrus particle ensembles determined with geometrical-optics crystal phase functions. Appl. Opt., 39:1895-1910. Sassen K and Dodd GC (1989): Haze Particle Nucleation Simulations in Cirrus Clouds, and Applications for Numerical and Lidar Studies. J. Atmos. Sci., 46:3005-3014. Sassen K and Cho BY (1992): Subvisual-thin cirrus lidar dataset for satellite verification and climatological research, J. Appl. Meteor. 31, 1275-1285 . Sassen, K., A. W. Huggins, A. B. Long, J. B. Snider, and R. J. Meitin, (1990): Investigations of a winter mountain storm in Utah. part II: Mesoscale structure, supercooled liquid water development, and precipitation processes. J. Atmos. Sci., 47:1323-1350..
(11) 54. R EVISTA DE C LIMATOLOGÍA , VOL . 11 (2011). Sassen K and Campbell JR (2001): A midlatitude cirrus cloud climatology from the Facility for Atmospheric Remote Sensing. Part I: Macrophysical and synoptic properties. J. Atmos. Sci., 58:481-496. Sassen K and Benson S (2001): A midlatitude cirrus cloud climatology from the Facility for Atmospheric Remote Sensing. Part II: Microphysical Properties Derived from Lidar Depolarization. J. Atmos. Sci., 58:2103-2112. Sassen K and Comstock JM (2001): A midlatitude cirrus cloud climatology from the Facility for Atmospheric Remote Sensing. Part III: Radiative properties. J. Atmos. Sci., 58:2113-2127. Seifert P, Ansmann A, Müller D, Wandinger U, Althausen D, Heymsfield AJ, Massie ST and Schmitt C (2007): Cirrus optical properties observed with lidar, radiosonde, and satellite over the tropical Indian Ocean during the aerosol-polluted northeast and clean maritime southwest monsoon. J. Geophys. Res., 112:D17205, doi:10.1029/2006JD008352. Stephens GL, Tsay SC, Stackhouse PW and Flatau PJ (1990): The relevance of the microphysical and radiative properties of cirrus clouds to climate and climate feedback. J. Atmos. Sci., 47:1742-1753. Sunilkumar SV and Parameswaran K (2005): Temperature dependence of tropical cirrus properties and radiative effects. J. Geophys. Res., 110:D13205, doi:10.1029/2004JD005426. Wandinger U (1998): Multiple-scattering influence on extinction- and backscatter-coefficient measurements with Raman and high-spectral resolution lidars. Appl. Opt., 37:417-427. Wang X, Boselli A, Avino LD, Velotta R, Spinelli N, Bruscaglioni P, Ismaelli A and Zaccanti G (2005): An algorithm to determine cirrus properties from analysis of multiple-scattering influence on lidar signals. Appl. Phys. B., 80:609-615. Wang Z and Sassen K (2002): Cirrus cloud microphysical property retrieval using lidar and radar measurements: II. Midlatitude cirrus microphysical and radiative properties. J. Atmos. Sci., 59:2291-2302. Whiteman DN, Demoz B, Wang Z (2004): Subtropical cirrus cloud extinction to backscatter ratios measured by Raman Lidar during CAMEX-3. Geophys. Res. Letters, 31:L12105, doi:10.1029/2004GL020003. World Meteorological Organization (1992): Scientific assessment of ozone depletion. Global Ozone Res. and Monit. Proj., Rep. 25, Geneva. Wylie DP, Menzel WP, Woolf HM and Strabala KI (1994): Four years of global cirrus cloud statistics using HIRS. J. Clim., 7:1972-1986. Yang Q, Fu Q and Hu Y (2010): Radiative impacts of clouds in the tropical tropopause layer. J. Geophys. Res., 115:D00H12, doi:10.1029/2009JD012393..
(12)
Figure

Documento similar
i) To study the relationships between SVI and fIPAR in row-structured orchards. ii) To understand the effects of architectural and leaf optical parameters on the
In Optical Burst-Switched networks, the so-called Burst- Control Packet is sent a given offset-time ahead of the optical data burst to advertise the imminent burst arrival, and
We study the dark nature of GRB 130528A through multi-wavelength observations and conclude that the main reason for the optical darkness is local extinction inside of the host
In addition to those studies the data used in this report has been used to obtain the monthly variability of clear and usable nights in a year, as well as relevant statistics for
We study the optical properties of double-layer graphene for linearly polarized evanescent modes and discuss the in-phase and out-of-phase plasmon modes for both, longitudinal
Using a combination of optical photometry and spectroscopy we esti- mate stellar masses, ages, and foreground extinction values of the brightest part of the population
influence of these parameters on the size and distribution of Te inclusions, deep defects, optical and electrical properties of CdZnTe detectors. In the fourth chapter, the effect
In this work we use optical imaging and integral field spec- troscopy (IFS) to study the impact of the minor merger on the star formation properties of the individual galaxies of
