Melatonin counteracts changes in hypothalamic gene expression of signals regulating feeding behavior in high fat fed rats
29
0
0
Texto completo
(2) Preprint of article published in Hormone Molecular Biology and Clinical Investigation, 2015 21(3):175-183. Melatonin counteracts changes in hypothalamic gene expression of signals regulating feeding behavior in high-fat fed rats. María J. Ríos-Lugo,Vanesa Jiménez-Ortega, Pilar Cano-Barquilla, Pilar Fernández Mateos, Eduardo J. Spinedi, Daniel P. Cardinali* and Ana I. Esquifino.. * Corresponding author: Dr. Daniel P. Cardinali, UCA-BIOMED-CONICET, Faculty of Medical Sciences, Pontificia Universidad Católica Argentina, 1107 Buenos Aires, Argentina.Phone: +54 911 44743547. E-mail: danielcardinali@uca.edu.ar, danielcardinali@fibertel.com.ar María J. Ríos-Lugo: Department of Biochemistry and Molecular Biology III, Faculty of Medicine, Universidad Complutense, Madrid 28040, Spain. Vanesa Jiménez-Ortega: Department of Biochemistry and Molecular Biology III, Faculty of Medicine, Universidad Complutense, Madrid 28040, Spain. Pilar Cano-Barquilla: Department of Biochemistry and Molecular Biology III, Faculty of Medicine, Universidad Complutense, Madrid 28040, Spain. PilarFernández Mateos: Department of Cellular Biology, Faculty of Medicine, Universidad Complutense, Madrid 28040, Spain. Eduardo J. Spinedi: Centre on Experimental & Applied Endocrinology, Consejo Nacional de Investigaciones Científicas y Técnicas (CONICET) La Plata-UNLP, 1900 La Plata, Argentina. Ana I. Esquifino: Department of Biochemistry and Molecular Biology III, Faculty of Medicine, Universidad Complutense, Madrid 28040, Spain. Short version of title: Melatonin and feeding behavior signals. 1.
(3) Abstract Background: Previous studies indicate that the administration of melatonin caused body weight and abdominal visceral fat reductions in rodent models of hyperadiposity. The objective of the present study performed in high-fat fed rats was to evaluate the activity of melatonin on gene expression of some medial basal hypothalamus (MBH) signals involved in feeding behavior regulation, including neuropeptide Y (NPY), proopiomelanocortin (POMC), prolactin-releasing peptide (PrRP), leptin- and insulinreceptors (R) and insulin-R substrate (IRS)-1 and -2. Blood levels of leptin and adiponectin were also measured. Methods: Adult Wistar male rats were divided into four groups (n= 16/group): (i) control diet (3 % fat); (ii) high-fat (35 %) diet; (iii) high-fat diet + melatonin; (iv) control diet + melatonin. Rats had free access to high-fat or control chow and one of the following drinking solutions: (a) tap water; (b) 25 μg/mL of melatonin. Results: After 10 weeks, the high-fat fed rats showed augmented MBH mRNA levels of NPY, leptin-R, PrRP, insulin-R, IRS-1 and IRS-2. The concomitant administration of melatonin counteracted this increase. Feeding of rats with a high-fat diet augmented expression of MBH POMC gene through an effect insensitive to melatonin treatment. The augmented levels of circulating leptin and adiponectin seen in high-fat fed rats were counteracted by melatonin as was the augmented body weight: melatonin significantly attenuated body weight increase in high-fat fed rats without affecting chow or water consumption. Melatonin augmented plasma leptin and adiponectin in control rats.. 2.
(4) Conclusions: The results indicate that an effect on gene expression of feeding behavior signals at the CNS may complement a peripheral rise of the energy expenditure produced by melatonin to decrease body weight in high-fat fed rats.. Key words: Melatonin; high-fat diet; food intake; gene expression; neuropeptide Y; proopiomelanocortin; prolactin-releasing peptide; leptin; adiponectin; medial basal hypothalamus.. 3.
(5) Introduction The possible involvement of melatonin in appetite regulation has been studied for years. Melatonin regulates food intake in rats [1], mice [2], hamsters [3], pigs [4], and in several submammalian species like goldfish [5], rainbow trout [6] and zebrafish [7,8]. In the rat the responses have been conflicting including reduction, increase or no effect on food consumption [9,10]. A decrease in fat mass and body weight has been reported in rats [10-13] whereas melatonin increases fat mass in gray mouse lemurs [14], Syrian hamster [3], raccoon dog [15] and garden dormouse [16]. Feeding behavior and regulation of nutrient intake are complex phenomena influenced by homeostatic, hedonic and peripheral signals [17,18]. The homeostatic pathway involves orexigenic neurons in the hypothalamic arcuate nucleus containing the orexigenic peptides neuropeptide Y (NPY) and agouti-gene related peptide (AgRP). These neurons project to second order neurons in the lateral hypothalamus which contain orexigenic peptides like orexin and melanin concentrating hormone. NPY and orexin increase appetite, arousal and spontaneous physical activity and therefore play an important role in energy balance providing a link among vigilance, energy balance and reward [17,18]. Another neuronal population in the arcuate nucleus encodes satiety and includes several anorexigenic peptides derived from the common precursor proopiomelanocortin (POMC), also called the “melanocortin” system, that co-exist with the cocaine and-amphetamine-regulated transcript (CART). Melanocortin and CART neurons project to satiety neurons located in the paraventricular nucleus which contain corticotropin-releasing hormone, a strong anorexinergic signal (for review see [19]). 4.
(6) This complex neuronal network assures a bidirectional homeostasis in response to peripheral signals reflecting the actual nutritional stage. Thus, satiety is produced by several factors like gastric dilatation, intestinal peptides liberated in postprandial state (cholecystokinin, glucagon-like peptide, peptide YY), metabolites as fatty acids and glucose and hormones as insulin and leptin [20]. Insulin is transported to the brain where it activates the anorexigenic neuronal pathways, causing a reduction in food intake. Leptin is another anorexigenic signal produced by the adipose tissue proportionally to the fat mass [21]. Plasma levels of insulin and leptin pass through the blood-brain barrier and interact with insulin receptors (insulin-R) and leptin receptors (leptin-R) that are expressed in first-order neurons of the arcuate nucleus, both in NPY/AgRP and POMC/CART neurons. A number of studies in the literature indicate that the administration of melatonin to obese rats caused body weight and abdominal visceral fat reductions that were accompanied by very slight or no decrease in gross food intake [13,22-30].The same was observed by us in a recent study evaluating the efficacy of melatonin to affect mild inflammation in the metabolic syndrome induced by a high-fat diet in rats [31]. Although this may imply that the main effect of melatonin on body weight is exerted peripherally through a rise in the energy expenditure, the possibility of central changes in feeding regulatory mechanisms remains open. We hereby report the results of gene expression of NPY, leptin-R, POMC, prolactin-releasing peptide (PrRP), insulinR, insulin-R substrate (IRS)-1 and IRS-2 in the medial basal hypothalamus (MBH) of the same animals employed in our previous study [31]. The changes observed were correlated with those in blood levels of leptin and adiponectin.. 5.
(7) Materials and Methods Animals and experimental design The details on the animals and experimental design employed were given elsewhere [31]. Briefly, adult male Wistar rats were kept under standard conditions with controlled light (12:12 h light/dark schedule; lights on at 08:00 h) and temperature (22 ± 2 C). Rats had ad libitum access to a normal or a high-fat diet. Normal rat chow contained 3% fat, 16% protein and 60% carbohydrate (mainly as starch with less than 0.4% fructose) providing a total caloric content of 2.9 Kcal/g. The high (35%) fat chow contained 35% carbohydrates and 20% proteins, providing a total caloric content of 5.4 Kcal/g. Animals were randomly divided into four groups (n= 16/group) as follows: (i) control; (ii) high-fat diet (obese); (iii) obese + melatonin; (iv) control + melatonin. Rats had free access to high-fat or control chow and one of the following drinking solutions for 10 weeks: (a) tap water; (b) 25 μg/mL of melatonin. Since ethanol was used as a melatonin´s vehicle, drinking solutions in groups (i) and (iv) were added 0.015 % ethanol. Water bottles were changed every other day. Because rats drank about 30 mL/day, the daily melatonin dosage used provided approximately 2.3 mg/kg melatonin [31]. Because rats drank 90–95% of this total daily water taken up during the dark period, most melatonin was administered at the time of endogenous melatonin release. The human equivalence dose, calculated by using the body surface area normalization method [32] was about 0.35 mg/kg (about 25-30 mg/day for a 75 kg human adult). The animals were weighed once a week for 10 weeks and were euthanized by decapitation under conditions of minimal stress at two time intervals: at the middle of the light period (13:00 h) and at the middle of the scotophase (01:00 h). All 6.
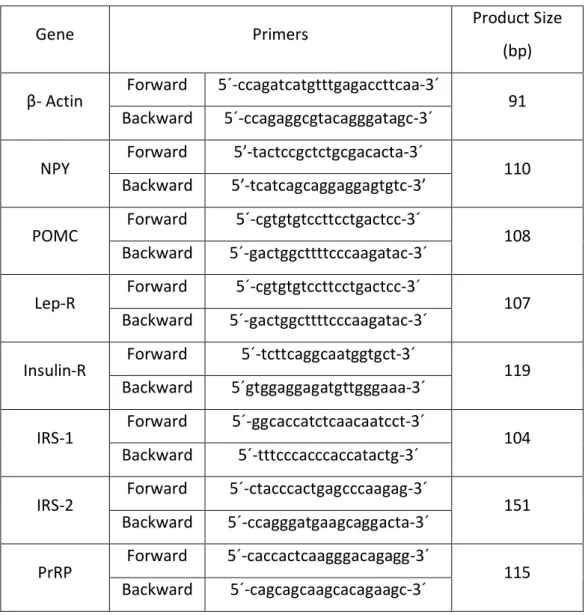
(8) experiments were conducted in accordance with the guidelines of the International Council for Laboratory Animal Science (ICLAS). The brains were rapidly removed and the medial basal hypothalamus (MBH) was dissected out following the landmarks of Szentagothai et al. [33]. Trunk blood was collected and plasma samples were obtained by centrifugation of blood at 1,500 x g for 15 min and were stored at –70 °C until further analysis.. Real-time quantitative polymerase chain reaction (qPCR) Total RNA extraction was performed using the RNeasy protect mini kit and was analyzed using QuantiTec SYBR green kit (Qiagen, Hielden, Germany). The iScript™ cDNA Synthesis Kit (Bio-Rad Laboratories SA; Madrid) was used to synthesize cDNA from 1 μg of total RNA, according to the manufacturer’s protocol. The reference gene β-actin was used as a constitutive control for normalization. Reactions were carried out in the presence of 200 nM of specific primers for genes of NPY, POMC, leptin receptor, insulin receptor (IR), insulin receptor substrate (IRS)-1, IRS-2 and prolactin releasing peptide (PrRP). Primers were designed using Primer3 software (The Whitehead Institute, http://frodo.wi.mit.edu/cgi-bin/primer3/primer3_www.cgi) and are shown in Table 1. PCR reactions were carried out in an Eppendorf Real Plex Mastercycler (Eppendorf AG, Hamburg, Germany). The real-time qPCR reaction program included a 94 °C enzyme activation step for 2 min followed by 40 cycles of 95 °C denaturation for 15 s, 60 °C annealing for 30 s and 72 °C extension for 30 s. Detection of fluorescent product was carried out at the end of the 72 °C extension period.. 7.
(9) Serial dilutions of cDNA from control MBH were used to perform calibration curves in order to determine amplification efficiencies. For the primers used there were no differences between transcription efficiencies, the amount of initial cDNA in each sample being calculated by the 2-ΔΔCt method [34]. All samples were analyzed in triplicate and in three different measures. Fractional cycle at which the amount of amplified target becomes significant (Ct) was automatically calculated by the PCR device. To estimate whether treatment or time of day modified the expression of MBH β-actin, PCR employing serial dilutions of this reference gene was performed. In this study Ct did not vary significantly as a function of treatment or of time of day, indicating the validity to employ β-actin as a reference gene.. Biochemical assays Plasma concentrations of adiponectin and leptin were measured in a multianalyte profiling by using the Luminex-100 system and the XY Platform (Luminex Corporation, Oosterhout, The Netherlands) as described elsewhere [35]. Calibration microspheres for classification and reporter readings as well as sheath fluid were also purchased from Luminex Corporation. Acquired fluorescence data were analyzed by the MasterPlexTM QT software. All analyses were performed according to the manufacturer protocols.. Data analysis After verifying normality of distribution of data, the statistical analysis of the results was performed by a one-way or a three-way factorial analysis of variance 8.
(10) (ANOVA) followed by Holm-Sidak multiple comparisons tests, as stated. The threefactor ANOVA was used to test for differences between individual data grouped according to the levels of each factor, i.e. treatment, diet, and time period, and for interactions between the factors. Four hypotheses were tested in the three-factor ANOVA: (a) there was no difference between the levels of treatment (melatonin or vehicle); (b) there was no difference between the levels of diet (normal or high-fat diet); (c) there was no difference between the levels of time period (middle of day or middle of night); (d) there was no interaction among the three factors. P values lower than 0.05 were taken as evidence of statistical significance.. Results The detailed description of the changes in individual daily chow and water consumption and body weight in the four experimental groups are published elsewhere [31]. Body weight of high-fat fed rats receiving vehicle attained values that were 44 % higher than controls after 70 days of treatment. The concomitant administration of melatonin significantly attenuated body weight increase in highfatfed rats without affecting chow or water consumption [31]. Figure 1 depicts the changes in MBH mRNA levels encoding NPY, POMC, leptin-R and PrRP at the two examined time intervals (13:00 and 01:00 h) in the four studied groups. For NPY, leptin-R and PrRP gene expression, the three way ANOVA indicated that all main factors were significant (F= 28.1, P< 0.001, F= 9.4, P< 0.003 and F= 28.5, P< 0.001 for treatment; F= 56.3, P< 0.001; F=20.4, P< 0.001 and F= 58.1 for diet; F= 5.5, P< 0.03; F= 15.2, P< 0.001 and F= 45.8, P< 0.001 for time of day, respectively) as well as were the interactions “treatment x diet” (F= 20.4, P< 0.001; F= 9.9, P< 0.003 and F= 9.
(11) 13.7, P< 0.001, respectively) and “treatment x time of day” (F= 5.9, P= 0.02; F= 4.1, P< 0.04 and F= 17.7, P< 0.001, respectively). Collectively the statistical analysis supported the view that the high-fat diet augmented expression of MBH NPY, leptin-R and PrRP genes mainly at night hours and that melatonin decreased it in obese rats mainly at night hours. In the case of POMC gene expression, the three-way ANOVA yielded significance for diet (F= 37.1, P< 0.001) and time of day (F= 18.6, P< 0.001) with no significant interaction between them. Thus the high-fat diet augmented expression of MBH POMC mRNA mainly at night hours through an effect insensitive to melatonin treatment (Fig. 1). Figure 2 shows the changes in MBH mRNA levels encoding insulin-R, IRS-1 and IRS-2. A three-way ANOVA indicated statistical significance for the three factors examined and for the three parameters tested (treatment: F= 77.8, P< 0.001, F= 32.2, P< 0.001; F= 54.3, P< 0.001; diet: F= 131.1, P< 0.001; F= 25.4, P< 0.001; F= 102.5, P< 0.001; time of day: F= 33.1, P< 0.001; F= 6.4, P< 0.02; F= 5.6, P< 0.02, for insulin-R, IRS1 and IRS-2, respectively). A significant interaction “treatment x diet” was found (F= 37.1, P< 0.001 for insulin-R; F= 16.6, P< 0.001 for IRS-1; F= 16.9, P< 0.001 for ISR-2). Therefore, the statistical analysis supported the conclusion that that the high-fat diet augmented expression of MBH insulin-R, IRS-1 and IRS-2 mRNA, an effect reduced by melatonin administration. Figure 3 summarizes the changes in plasma levels of leptin and adiponectin. The three-way ANOVA indicated that treatment and diet were significant as main factors (treatment: F= 11.1, P= 0.001 and F= 4.4, P<0.04; diet: F= 164.9, P< 0.001 and F= 15.8, P<0.001 for leptin and adiponectin, respectively). In addition the interaction “treatment x diet” was significant (F= 38.8, P< 0.001 and F= 13.8, P< 0.001, 10.
(12) respectively). This supported the conclusion that the augmented levels of leptin and adiponectin seen in high-fat fed rats were counteracted by melatonin. In the All Pairwise Multiple Comparison Procedure of the Holm-Sidak method, and with an overall significance level = 0.05, comparisons for factor: “treatment within normal” for leptin and adiponectin indicated a t= 15.5 and 5.27, respectively P < 0.001. Thus melatonin augmented leptin and adiponectin levels significantly in the control group (Fig. 3).. Discussion Information in the literature on the effect of melatonin on feeding behavior signals is scant. Adult pinealectomized rats administered with melatonin [36], or male rat offspring exposed to melatonin prenatally [37], showed augmented hypothalamic levels of NPY while in submammalian species increases [6], decreases [7,8] or absence of changes [5] in hypothalamic NPY were reported after melatonin. Melatonin reduced the increase in neuronal NPY of striatal neurons in a model of cerebral ischemic damage in rats [38]. In a recently study we examined whether melatonin affected mild inflammation in high-fat fed rats [31]. A number of plasma parameters were measured at two time intervals, i.e. the middle of daylight period and the middle of the scotophase. In obese rats melatonin decreased the augmented circulating levels of the pro-inflammatory signals interleukin (IL)-1β, IL-6, tumor necrosis factor-α, interferon-γ and C-reactive protein seen in obese rats and restored the depressed levels of the anti-inflammatory cytokines IL-4 and IL-10. Rats fed with the high-fat diet showed significantly higher body weights and augmented systolic blood pressure from the 3rd and 4th week 11.
(13) onwards, respectively, melatonin effectively preventing these changes [31]. In high-fat fed rats circulating low-density lipoprotein-cholesterol, total cholesterol and triglyceride concentration augmented significantly, melatonin counteracting these changes. Melatonin-treated rats showed a decreased insulin resistance, the highest values of plasma high-density lipoprotein-cholesterol and the lowest values of plasma uric acid [31]. The foregoing results reported the changes in MBH expression of a number of feeding behavior signals and in plasma leptin and adiponectin levels in the same animals reported in the previously cited study [31]. The data obtained indicate that the concomitant administration of melatonin counteracted the augmented expression of MBH genes encoding NPY, PrRP, leptin-R, insulin-R, IRS-1 and IRS-2 found in high-fat fed rats. Feeding of rats with a high-fat diet augmented expression of MBH POMC gene through an effect insensitive to melatonin treatment. The augmented levels of circulating leptin and adiponectin seen in high-fat fed rats were decreased by melatonin whereas melatonin augmented plasma leptin and adiponectin in control rats. All these effects of melatonin were seen in the absence of significant modifications of daily food intake suggesting that the satiety signals triggered were compensated by an increase in the central orexinergic pathways to attain a new set point to equal food intake. The activity of the orexigenic pathway driven by NPY appeared to be effective to counteract food intake inhibition even in the presence of the increased circulating levels of the anorexigenic signals leptin (Fig. 3) and insulin [31], as well as of the augmented expression of MBH POMC, PrRP, leptin-R, insulin-R, IRS-1 and IRS-2 genes. NPY is synthesized in the cell bodies of the arcuate nucleus of the hypothalamus and is 12.
(14) transported to the paraventricular nucleus by axonal flow to achieve high local concentrations [39]. Previous studies in rats showed that intra-hypothalamic injection of NPY stimulates food intake and produced hyperinsulinemia and insulin resistance [40,41]. Moreover, energy expenditure decreases with the simultaneous induction of lipid synthesis in both the liver and the white adipose tissue [41,42]. NPY overactivity results in expression of neuronal insulin-R and leptin-R, thus generating an anorexigenic response that counterbalances the NPY effect on appetite [20,21]. The foregoing results suggest that melatonin administration is able to set up a new equilibrium among feeding signals in the MBH. Remarkably, melatonin reduced both gene expression of the strong orexinergic signal NPY and of the anorexinergic signal PrRP, as well as that of receptors for anorexigenic signals like leptin and insulin and of insulin intracellular signaling (IRS-1, IRS-2). Blood levels of leptin and adiponectin (Fig. 3) and of insulin [31] were also significantly reduced by melatonin in obese rats while melatonin augmented plasma leptin and adiponectin in control rats. Our present and previous results [26,35] have indicated an increase in mean levels of adiponectin in high fat–fed rats as well as a significant modification in its daily pattern in circulation. In contrast most studies have showed a reduction in plasma concentration of adiponectin in obesity (see for ref.[43]) with very few exceptions [44]. The possibility deserves to be considered that some fat components of the diet employed could be stimulus for adiponectin secretion in view that several nutraceutical products like fish oil [45], safflower oil [46] or linoleic acid [47] increased adiponectin production in either animals or humans. Data in the literature on the effect of melatonin on feeding behavior signals are scant. By immunohistochemical staining of NPY neurons in the hypothalamic arcuate 13.
(15) nucleus of Sprague-Dawley rats a depressive effect of pinealectomy and a reversal after melatonin administration were found [36]. In that study, and resembling the results of Figure 1 (upper left panel), melatonin administration to sham-operated rats did not modify NPY immunopositive cell number in the arcuate nucleus significantly. One of us reported that prenatal melatonin exposure of the mother augmented hypothalamic NPY content in the male rat offspring [37]. In zebrafish, melatonin reduces food intake and increases genes codifying for molecules involved in feeding inhibition such as leptin, with a significant reduction in the major orexigenic signals including NPY [7,8]. In the goldfish, a species in which melatonin reduces body weight, plasma leptin and hypothalamic NPY remained unaltered after melatonin, suggesting that these feeding regulatory signals are not involved in the effects of melatonin on energy homeostasis [5]. In the hypothalamus of the rainbow trout melatonin altered glucosensing capacity and induced increased mRNA expression levels of NPY and decreased mRNA levels of POMC and CART [6]. In the study reported herein melatonin was unable to modify POMC gene expression. To our knowledge the present study is the first reporting an effect of melatonin on the expression of the gene encoding PrRP. This peptide has been linked to the regulation of appetite, being one of the more recently described anorexigenic signals. The gene encoding PrRP is located mainly in the hypothalamus and the medulla in areas involved in the regulation of appetite which also express PrRP receptors [48]. PrRP effects on appetite are presumably mediated by changes in circulating levels of leptin as well as for its involvement in the regulation of anorexigenic peptides in the melanocortin system [49].. 14.
(16) It must be noted that regardless of the universality of the changes following melatonin treatment of high-fat fed rats, melatonin effectiveness to reduce body weight appeared to be independent on the central mechanisms regulating food intake since a new set point to equal food intake was rapidly attained. The data indirectly support the view that the main effect of melatonin on body weight may be exerted peripherally through a rise in the energy expenditure rather than centrally on feeding behavior mechanisms. Results in the literature tend to support this conclusion. The nocturnal locomotor activity in rats increased after melatonin [10,50] and the core body temperature also rise [10], a finding compatible with a rise in energy expenditure. Tan and co-workers put forth the hypothesis that the brown adipose tissue (BAT) is a factor through which animals lose weight in response to melatonin administration (and gain weight when there is a deficiency of melatonin) [51]. BAT is present in adult humans [52], has a high metabolic activity and is responsible for nonshivering thermogenesis [53]. As a result, BAT burns calories for the purpose of heat production, thereby consuming glucose and fatty acids and limiting fat deposition [54,55]. BAT is also of crucial importance in the regulation of glycemia, lipidemia and insulin sensitivity [56].To what extent the weight-loss-promoting effect of melatonin is attributable to an increase in energy expenditure by BAT deserves further exploration [53]. One important limitation of the present descriptive study is that gene expression needs to be completed with Western blotting analysis of the proteins formed in order to obtain a complete understanding of melatonin effect on feeding behavior signals. In the present study the results are presented as relative changes of mRNA levels and while statistically significant differences were detected, the presentation of data may 15.
(17) distort the actual physiological importance of such changes since a similar relative change in NPY and insulin-R mRNA could well represent a several fold difference in the actual amount of the specific protein synthesized. In addition, the gross picture of daily food intake reported [31] must be completed with the analysis of feeding frequency and meal size at both daylight and scotophase periods during the whole observation period to further substantiate subtile changes in feeding behavior after melatonin. In summary, an adequate supplementation with melatonin lowers body weight and body weight gain in a rodent model of hyperadiposity [31]. This might be the result of the recovery of feeding behavior signaling, of the disappearance of insulin resistance and glucose intolerance and of the accentuation of the energy expenditure over the energy intake, resulting in weight loss and stabilization of weight gain.. Acknowledgments This research was supported by grants from Ministerio de Educación y Ciencia, Spain (SAF2008-00424), Fondation por la Recherche en Endocrinologie, Diabetologie et Metabolisme (FPREDM 062013), Agencia Nacional de Promoción Científica y Tecnológica, Argentina (PICT 2012-0984) and Mutua Madrileña and Eugenio Rodríguez Pascual Foundations, Madrid, Spain. EJS and DPC are Research Career Awardees, Argentine National Research Council (CONICET).. Conflict of Interest The authors declare no conflict of interest.. 16.
(18) References. 1. Huether G: Melatonin synthesis in the gastrointestinal tract and the impact of nutritional factors on circulating melatonin. Ann N Y Acad Sci 1994;719:14658. 2. Bubenik GA, Pang SF: The role of serotonin and melatonin in gastrointestinal physiology: ontogeny, regulation of food intake, and mutual serotoninmelatonin feedback. J Pineal Res 1994;16:91-9. 3. Bartness TJ, Wade GN: Body weight, food intake and energy regulation in exercising and melatonin-treated Siberian hamsters. Physiol Behav 1985;35:805-8. 4. Bubenik GA, Pang SF, Hacker RR, Smith PS: Melatonin concentrations in serum and tissues of porcine gastrointestinal tract and their relationship to the intake and passage of food. J Pineal Res 1996;21:251-6. 5. De Pedro N, Martinez-Alvarez RM, Delgado MJ: Melatonin reduces body weight in goldfish (Carassius auratus): effects on metabolic resources and some feeding regulators. J Pineal Res 2008;45:32-9. 6. Conde-Sieira M, Libran-Perez M, Lopez Patino MA, Soengas JL, Miguez JM: Melatonin treatment alters glucosensing capacity and mRNA expression levels of peptides related to food intake control in rainbow trout hypothalamus. Gen Comp Endocrinol 2012;178:131-8. 7. Piccinetti CC, Migliarini B, Olivotto I, Simoniello MP, Giorgini E, Carnevali O: Melatonin and peripheral circuitries: insights on appetite and metabolism in Danio rerio. Zebrafish 2013;10:275-82. 8. Piccinetti CC, Migliarini B, Olivotto I, Coletti G, Amici A, Carnevali O: Appetite regulation: the central role of melatonin in Danio rerio. Horm Behav 2010;58:780-5. 9. Shaji AV, Kulkarni SK: Evidence of GABAergic modulation in melatonin-induced shortterm memory deficits and food consumption. Methods Find Exp Clin Pharmacol 1998;20:311-9. 10. Wolden-Hanson T, Mitton DR, McCants RL, Yellon SM, Wilkinson CW, Matsumoto AM, Rasmussen DD: Daily melatonin administration to middle-aged male rats suppresses body weight, intraabdominal adiposity, and plasma leptin and insulin independent of food intake and total body fat. Endocrinology 2000;141:487-97.. 17.
(19) 11. Bojkova B, Orendas P, Friedmanova L, Kassayova M, Datelinka I, Ahlersova E, Ahlers I: Prolonged melatonin administration in 6-month-old Sprague-Dawley rats: metabolic alterations. Acta Physiol Hung 2008;95:65-76. 12. Puchalski SS, Green JN, Rasmussen DD: Melatonin effects on metabolism independent of gonad function. Endocrine 2003;21:169-73. 13. Puchalski SS, Green JN, Rasmussen DD: Melatonin effect on rat body weight regulation in response to high-fat diet at middle age. Endocrine 2003;21:163-7. 14. Genin F, Schilling A, Claustrat B: Melatonin and methimazole mimic short-day-induced fattening in gray mouse lemurs. Physiol Behav 2003;79:553-9. 15. Mustonen AM, Nieminen P, Asikainen J, Saarela S, Kukkonen JV, Hyvarinen H: Continuous melatonin treatment and fasting in the raccoon dog (Nyctereutes procyonoides)--vernal body weight regulation and reproduction. Zoolog Sci 2004;21:163-72. 16. Le Gouic S, Delagrange P, Atgie C, Nibbelink M, Hanoun N, Casteilla L, Renard P, Lesieur D, Guardiola-Lemaitre B, Ambid L: Effects of both a melatonin agonist and antagonist on seasonal changes in body mass and energy intake in the garden dormouse. Int J Obes Relat Metab Disord 1996;20:661-7. 17. Benarroch EE: Neural control of feeding behavior: Overview and clinical correlations. Neurology 2010;74:1643-50. 18. Sohn JW, Elmquist JK, Williams KW: Neuronal circuits that regulate feeding behavior and metabolism. Trends Neurosci 2013;36:504-12. 19. Morton GJ, Meek TH, Schwartz MW: Neurobiology of food intake in health and disease. Nat Rev Neurosci 2014;15:367-78. 20. Dunn TN, Adams SH: Relations between metabolic homeostasis, diet, and peripheral afferent neuron biology. Adv Nutr 2014;5:386-93. 21. van Swieten MM, Pandit R, Adan RA, van der Plasse G: The neuroanatomical function of leptin in the hypothalamus. J Chem Neuroanat 2014; 61-62C:207-20. 22. Cardinali DP, Bernasconi PA, Reynoso R, Toso CF, Scacchi P: Melatonin may curtail the metabolic syndrome: studies on initial and fully established fructose-induced metabolic syndrome in rats. Int J Mol Sci 2013;14:2502-14. 23. Agil A, Navarro-Alarcon M, Ruiz R, Abuhamadah S, El-Mir MY, Vazquez GF: Beneficial effects of melatonin on obesity and lipid profile in young Zucker diabetic fatty rats. J Pineal Res 2011;50:207-12.. 18.
(20) 24. Prunet-Marcassus B, Desbazeille M, Bros A, Louche K, Delagrange P, Renard P, Casteilla L, Penicaud L: Melatonin reduces body weight gain in Sprague Dawley rats with diet-induced obesity. Endocrinology 2003;144:5347-52. 25. Sartori C, Dessen P, Mathieu C, Monney A, Bloch J, Nicod P, Scherrer U, Duplain H: Melatonin improves glucose homeostasis and endothelial vascular function in high-fat diet-fed insulin-resistant mice. Endocrinology 2009;150:5311-7. 26. Rios-Lugo MJ, Cano P, Jimenez-Ortega V, Fernandez-Mateos MP, Scacchi PA, Cardinali DP, Esquifino AI: Melatonin effect on plasma adiponectin, leptin, insulin, glucose, triglycerides and cholesterol in normal and high fat-fed rats. J Pineal Res 2010;49:342-8. 27. Ladizesky MG, Boggio V, Albornoz LE, Castrillón P, Mautalen CA, Cardinali DP: Melatonin increases oestradiol-induced bone formation in ovariectomized rats. J Pineal Res 2003;34:143-51. 28. Sanchez-Mateos S, Alonso-Gonzalez C, Gonzalez A, Martinez-Campa CM, Mediavilla MD, Cos S, Sanchez-Barcelo EJ: Melatonin and estradiol effects on food intake, body weight, and leptin in ovariectomized rats. Maturitas 2007;58:91-101. 29. Hussein MR, Ahmed OG, Hassan AF, Ahmed MA: Intake of melatonin is associated with amelioration of physiological changes, both metabolic and morphological pathologies associated with obesity: an animal model. Int J Exp Pathol 2007;88:19-29. 30. Raskind MA, Burke BL, Crites NJ, Tapp AM, Rasmussen DD: Olanzapine-induced weight gain and increased visceral adiposity is blocked by melatonin replacement therapy in rats. Neuropsychopharmacology 2007;32:284-8. 31. Cano-Barquilla P, Pagano ES, Jimenez-Ortega V, Fernández-Mateos P, Esquifino AI, Cardinali DP: Melatonin normalizes clinical and biochemical parameters of mild inflammation in diet-induced metabolic syndrome in rats. J Pineal Res 2014;157:280-90. 32. Reagan-Shaw S, Nihal M, Ahmad N: Dose translation from animal to human studies revisited. FASEB J 2008;22:659-61. 33. Szentagothai B, Flerko B, Mess B, Halász B: Hypothalamic Control of the Anterior Pituitary. 3rd Ed. Budapest, Akademiai Kiado, 1968. 34. Livak KJ, Schmittgen TD: Analysis of relative gene expression data using real-time quantitative PCR and the 2-Ct method. Methods 2001;25:402-8.. 19.
(21) 35. Cano P, Cardinali DP, Ríos-Lugo MP, Fernández-Mateos MP, Reyes MP, Esquifino AI: Effect of a high-fat diet on 24-hour pattern of circulating adipocytokines in rats. Obesity 2009;117:1866-71. 36. Aydin M, Canpolat S, Kuloglu T, Yasar A, Colakoglu N, Kelestimur H: Effects of pinealectomy and exogenous melatonin on ghrelin and peptide YY in gastrointestinal system and neuropeptide Y in hypothalamic arcuate nucleus: immunohistochemical studies in male rats. Regul Pept 2008;146:197-203. 37. Diaz E, Debeljuk L, Arce A, Esquifino A, Diaz B: Prenatal melatonin exposure affects luteinizing hormone and hypothalamic and striatal neuropeptide Y in the male rat offspring. Neurosci Lett 2000;292:143-6. 38. Ma Y, Feng Q, Ma J, Feng Z, Zhan M, Ouyang L, Mu S, Liu B, Jiang Z, Jia Y, Li Y, Lei W: Melatonin ameliorates injury and specific responses of ischemic striatal neurons in rats. J Histochem Cytochem 2013;61:591-605. 39. Zhang W, Cline MA, Gilbert ER: Hypothalamus-adipose tissue crosstalk: neuropeptide Y and the regulation of energy metabolism. Nutr Metab (Lond) 2014;11:27 40. Arora S, Anubhuti: Role of neuropeptides in appetite regulation and obesity--a review. Neuropeptides 2006;40:375-401. 41. Chee MJ, Myers MG, Jr., Price CJ, Colmers WF: Neuropeptide Y suppresses anorexigenic output from the ventromedial nucleus of the hypothalamus. J Neurosci 2010;30:3380-90. 42. Blevins JE, Baskin DG: Hypothalamic-brainstem circuits controlling eating. Forum Nutr 2010;63:133-40. 43. Hui X, Lam KS, Vanhoutte PM, Xu A: Adiponectin and cardiovascular health: an update. Br J Pharmacol 2012;165:574-90. 44. Alonso-Vale MI, Peres SB, Vernochet C, Farmer SR, Lima FB: Adipocyte differentiation is inhibited by melatonin through the regulation of C/EBPbeta transcriptional activity. J Pineal Res 2009;47:221-7. 45. Rossi AS, Lombardo YB, Lacorte JM, Chicco AG, Rouault C, Slama G, Rizkalla SW: Dietary fish oil positively regulates plasma leptin and adiponectin levels in sucrose-fed, insulin-resistant rats. Am J Physiol Regul Integr Comp Physiol 2005;289:R486-R494 46. Sekine S, Sasanuki S, Murano Y, Aoyama T, Takeuchi H: Alpha-linolenic acid-rich flaxseed oil ingestion increases plasma adiponectin level in rats. Int J Vitam Nutr Res 2008;78:223-9.. 20.
(22) 47. Nagao K, Inoue N, Wang YM, Yanagita T: Conjugated linoleic acid enhances plasma adiponectin level and alleviates hyperinsulinemia and hypertension in Zucker diabetic fatty (fa/fa) rats. Biochem Biophys Res Commun 2003;310:562-6. 48. Takayanagi Y, Matsumoto H, Nakata M, Mera T, Fukusumi S, Hinuma S, Ueta Y, Yada T, Leng G, Onaka T: Endogenous prolactin-releasing peptide regulates food intake in rodents. J Clin Invest 2008;118:4014-24. 49. Onaka T, Takayanagi Y, Leng G: Metabolic and stress-related roles of prolactinreleasing peptide. Trends Endocrinol Metab 2010;21:287-93. 50. Terron MP, Delgado-Adamez J, Pariente JA, Barriga C, Paredes SD, Rodriguez AB: Melatonin reduces body weight gain and increases nocturnal activity in male Wistar rats. Physiol Behav 2013;118:8-13. 51. Tan DX, Manchester LC, Fuentes-Broto L, Paredes SD, Reiter RJ: Significance and application of melatonin in the regulation of brown adipose tissue metabolism: relation to human obesity. Obes Rev 2011;12:167-88. 52. Cypess AM, Lehman S, Williams G, Tal I, Rodman D, Goldfine AB, Kuo FC, Palmer EL, Tseng YH, Doria A, Kolodny GM, Kahn CR: Identification and importance of brown adipose tissue in adult humans. N Engl J Med 2009;360:1509-17. 53. Cipolla-Neto J, Amaral FG, Afeche SC, Tan DX, Reiter RJ: Melatonin, energy metabolism, and obesity: a review. J Pineal Res 2014;56:371-81. 54. Richard D, Picard F: Brown fat biology and thermogenesis. Front Biosci (Landmark Ed) 2011;16:1233-60. 55. Peirce V, Carobbio S, Vidal-Puig A: The different shades of fat. Nature 2014;510:76-83. 56. Townsend KL, Tseng YH: Brown fat fuel utilization and thermogenesis. Trends Endocrinol Metab 2014;25:168-77.. 21.
(23) FIGURE LEGENDS Figure 1. Expression of mRNA for NPY, POMC, leptin-R and PrRP in MBH of rats fed a normal or a high-fat diet and melatonin (25 µg/mL) or vehicle in drinking water for 10 weeks. Groups of rats were euthanized at the middle of the light period (13:00 h) or at the middle of the scotophase (01:00 h). MBH mRNA levels encoding NPY, POMC, leptin-R and PrRP were measured as described in the text. Shown are the means ± SEM (n= 7-8 per group). Letters indicate significant differences in a one-way ANOVA followed by a Holm-Sidak multiple comparisons test at a given time interval, as follows: (a) P< 0.01 as compared to the remaining groups; (b) P< 0.05 as compared to obese and obese + melatonin groups; (c) P< 0.05 as compared to the remaining groups. For further statistical analysis, see text.. Figure 2. Expression of mRNA for insulin-R, IRS-1 and IRS-2 in MBH of rats fed a normal or a high-fat diet and melatonin (25 µg/mL) or vehicle in drinking water for 10 weeks. Groups of rats were euthanized at the middle of the light period (13:00 h) or at the middle of the scotophase (01:00 h). MBH mRNA levels encoding insulin-R, IRS-1 and IRS-2 were measured as described in the text. Shown are the means ± SEM (n= 7-8 per group). Letters indicate significant differences in a one-way ANOVA followed by a Holm-Sidak multiple comparisons test at a given time interval, as follows: (a) P< 0.05 as compared to the remaining groups; (b) P< 0.05 as compared to obese and obese + melatonin groups. For further statistical analysis, see text.. Figure 3. Plasma levels of leptin and adiponectin in rats fed a normal or a high-fat diet and melatonin (25 µg/mL) or vehicle in drinking water for 10 weeks. Groups of rats 22.
(24) were euthanized at the middle of the light period (13:00 h) or at the middle of the scotophase (01:00 h). Shown are the means ± SEM (n= 7-8 per group). Letters indicate significant differences in a one-way ANOVA followed by a Holm-Sidak multiple comparisons test at a given time interval, as follows: (a) P< 0.05 as compared to obese and obese + melatonin groups; (b) P< 0.05 as compared to the remaining groups. (*) P< 0.001 vs. control when compared for the factor: “treatment within normal” in the All Pairwise Multiple Comparison Procedure of the Holm-Sidak method, three-way ANOVA . For further statistical analysis, see text.. 23.
(25) Table 1. Sequence of the primers used for real-time PCR. Gene. β- Actin. NPY. POMC. Lep-R. Insulin-R. IRS-1. IRS-2. PrRP. Primers Forward. 5´-ccagatcatgtttgagaccttcaa-3´. Backward. 5´-ccagaggcgtacagggatagc-3´. Forward. 5’-tactccgctctgcgacacta-3´. Backward. 5’-tcatcagcaggaggagtgtc-3’. Forward. 5´-cgtgtgtccttcctgactcc-3´. Backward. 5´-gactggcttttcccaagatac-3´. Forward. 5´-cgtgtgtccttcctgactcc-3´. Backward. 5´-gactggcttttcccaagatac-3´. Forward. 5´-tcttcaggcaatggtgct-3´. Backward. 5´gtggaggagatgttgggaaa-3´. Forward. 5´-ggcaccatctcaacaatcct-3´. Backward. 5´-tttcccacccaccatactg-3´. Forward. 5´-ctacccactgagcccaagag-3´. Backward. 5´-ccagggatgaagcaggacta-3´. Forward. 5´-caccactcaagggacagagg-3´. Backward. 5´-cagcagcaagcacagaagc-3´. 24. Product Size (bp) 91. 110. 108. 107. 119. 104. 151. 115.
(26) Figure 1. 25.
(27) 26.
(28) Figure 2. 27.
(29) Figure 3. 28.
(30)
Figure
Documento similar
Right and left cortical and hippocampal mRNA expression of SIRT1 in 18-month-old rats in control (non-treated) conditions, after treatment with a daily dose of melatonin (10 mg/kg
Since melatonin inhibits the growth of C6 cells, and this indoleamine has been demon- strated to be capable of decreasing aromatase expression and activity in these cells, the aim
The Panel had no information about plasma levels of the hydrolysis products of aspartame in rats given very high doses of the sweetener, as in the ERF study, but it is possible
In conclusion, the circulating levels of the novel insulin- like adipokine ISM1 are significantly higher in pubertal chil- dren with obesity and are associated with BMI Z-score and fat
Changes in serum IL-15 levels at 4 and 8 weeks as compared with baseline values were directly associated with changes in body weight, BMI, fat-free mass, and muscle mass
In agreement with the observed changes in hepatic SREBP-1c expression in liver, central leptin blunted the up- regulation of the mRNA levels of ACC, FAS, and SCD-1 elicited by the
On the other hand, we addressed the role of GRK2 in the heart of adult (9 month) mice or of mice fed with high-fat diet, two conditions known to promote insulin resistance. In
Although, as mentioned above, no significant changes have been seen in IRS-2 levels with aging or food restriction, the reported increase of SOCS-3 expression in aged rats (10) may
