The Global and Local Symmetries of Nanostructured Ferroelectric Relaxor 0 94(Bi0 5Na0 5)TiO3 – 0 06BaTiO3
24
0
0
Texto completo
(2) the use of lead-free piezoceramics in a near future. This fact has driven to a worldwide search for candidates to substitute the commercial lead titanate-zirconate (PbTiO3-PbZrO3, PZT) ceramics in a wide number of applications [1, 2]. As examples of these we can mention the classical large strain actuators and transducers for nondestructive testing by ultrasounds or the emerging applications in energy harvesting and storage. Compositions close to the Morphotropic Phase Boundary (MPB), the temperature independent composition at which there is a phases’ coexistence, are explored amongst leadfree piezoelectric solid-solutions. At the MPBs the structural instability leads to maximum piezoelectric properties of ceramics [3]. The solid-solution system (1-x)(Bi0.5Na0.5)TiO3-x BaTiO3 ((1x)BNT-xBT or BNBT100x) shows a MPB [4] for poled ceramics near x = 0.06, which until recently was described as separating materials with rhombohedral R3c ((Bi0.5Na0.5)TiO3 -like) and tetragonal P4mm (BaTiO3-like) polar, ferroelectric (FE), structures at room temperature. However the crystallographic complexity at the MPB was revealed by recent work [5] and some aspects of this are not yet fully solved. One of the current issues is that there exists a relatively wide range of compositions (0.05 < x < 0.11) for the unpoled ceramics that, according to diffraction-based reports, present an averaged or global cubic structure with non-polar space group P m3¯m [6, 7]. Authors [8] describe the BNBT6 unpoled state as a.
(3) pseudo-cubic structure with high local disorder. Cubic symmetry is incompatible with the observed dielectric relaxor performance and piezoelectricity of these ceramics [5, 9–14]. Relaxor behavior is currently ascribed to the existence of polar nanoregions (PNRs). Therefore, characterization of both global and short-range structures is needed to account for the polar character and structural response under the electric field of these materials. X-ray diffraction (XRD) global descriptions coexist in the present literature with multiphase local structural sceneries ≤. determined by the use of other techniques. In the light of recent. =. transmission electron microscopy (TEM) studies [15–17], for x < 0.06 the unpoled state corresponds to a rhombohedral R3c structure. For 0.06. x < 0.10 it is described as a multiphase system containing. nanoregions that show tetragonal P4bm structure, smaller than 20 = nm size and possibly antipolar order (antiferroelectric or ferrielectric). For x 0.06 a mixture of grains with a core of rhombohedral R3c structure surrounded by these PNRs and grains containing only these PNRs was found. Due to the good correlation of the observation of this PNRs and the relaxor-type dielectric permittivity vs. temperature curves for this range of compositions, a structure for this “antiferroelectric” relaxor was proposed. Such a relaxor would be composed at room temperature of a P m3¯m cubic matrix in which the PNRs were located. To add complexity to the previously.
(4) described state of the art, the room temperature structure of unpoled polycrystalline Bi0.5Na0.5TiO3 has been revisited and it has been found that a monoclinic Cc symmetry cannot be discarded for unpoled samples [18]. For Bi0.5Na0.5TiO3 ceramics, TEM shows that the structure is an assemblage of nanoscale twin domains that have phase and antiphase octahedral tilting with different coherence lengths. This model can explain an average monoclinic distortion as seen by X-ray diffraction [19]. Such results could also have implications on the structure of the ceramics of the solid solution system of BNT with BaTiO3 at the MPB. To investigate departure from centro-symmetry at the unit cell level, X-ray absorption near-edge spectroscopy (XANES) at the so called pre-edge transition or pre-edge feature in transition metals may be applied [20]. The region of the spectra before the K-edge main jump contains peaks, explained by electronic transitions to unoccupied bound states located below the vacuum level [21–23]. These transitions are sensitive to the oxidation state and to the coordination number of a given transition metal. This pre-edge fine structure (PEFS) has been applied to distinguish between centrosymmetric and distorted symmetries in titanates [24]. The variety of results found in the literature on BNBT100x ceramics at the MPB [17, 25–28] suggests a delicate phases’ balance near the mentioned MPB. All the observed phases are derivatives of the cubic-perovskite structure that undergoes relatively.
(5) subtle local symmetry break-downs, which modulate the global structure [19, 25]. This representation is consistent with recent firstprinciples calculations which show that the different crystal structures of BNT are energetically very similar [17]. The phase composition of a given sample, that ultimately will influence the material’s properties, is therefore a result of a combination of factors. Microstructural variations can appear as consequence of processing stress, defect structure created by volatile Bi and Na components or intergranular stress associated with fine grain size [29, 30] Regarding synthesis, a processing route has been proposed by some of the authors for the production of submicrometer structured undoped BNBT100x ceramics starting from nanometric powders obtained by sol-gel autocombustion [31] and a combination of hot-pressing (700◦C– 800◦C) and subsequent recrystallization (1000◦C–1050◦C) [32]. Such a novel route avoids the loss of volatiles, an important issue in processing these ceramics. In this work high resolution powder XRD and XANES are used in conjunction to study the global and local configurations of submicrometer-structured virgin BNBT6 ceramics. XRD, with fullpattern Rietveld analysis [33], is applied to provide a long-range description of the sample. XANES, focused at the so called pre-edge feature [24], is used to determine the departure from centrosymmetry at the unit cell scale of the precursor powder and the sintered ceramic. The results of this study provide a more detailed.
(6) and comprehensive picture of the virgin condition for this material and define a basis for further analysis of polarization processes.. Experimental In preliminary studies a series of submicrometer structured BNBT6 ceramics were prepared from sol-gel autocombustion ∼ powder by hot-pressing and recrystallization [34]. Ceramic microstructure was quantitatively characterized and a mean grain size below 700 nm was determined by computer-assisted quantitative analysis [11]. For the diffraction study, two complementary experiments were = performed. All the work was realized at beamline 2-1 of the Stanford = (SSRL). ≈ Synchrotron Radiation Lightsource A beam energy of 12 keV. (λ=1.033215Å) was used. Measurements temperature was 25◦C. A first tentative scan over a wide Q interval was performed with medium resolution and high counting statistics up to. This. experiment allowed a first approximation to the phase composition of the sample and helped identifying the most interesting interval for a finer experiment. For the second experiment a high-resolution configuration was implemented. Si (1,1,1) monochromator and analyzer were installed and adjusted. The experimental setup was calibrated and the instrumental resolution function was established by measuring a LaB6 standard. The sample was mounted on a zero background holder and data were collected in reflection geometry from.
(7) 10◦ to 65◦. The scanning step was 0.01◦ in 2θ . Counting times were enough to measure the intensities of significant peaks with standard deviations of 1% or less. Capabilities of program FULLPROF [35] for characterizing crystalas well as microstructural features (texture, microstrains, small crystallite size) were applied. XANES spectra of BNBT6 at room temperature were measured. A titanium TiO2-rutile powder and a thin film of PbTiO3 were chosen as model for centro-symmetric and distorted compounds, respectively. Ti K absorption edge (about 4966=eV) spectra of all samples were =. obtained at SSRL beamline 4-3, with a Si(220) double crystal monochromator, using ion chamber transmission detectors and a silicon diode as fluorescence detector. The SPEAR-3 storage ring was operated at 3.0 GeV with a beam current of 300 mA. Energy calibration was obtained by transmission of a metallic titanium foil as reference. In the pre-edge and edge zones the energy intervals were E=0.2 eV. After the so-called main edge, the energy interval was 0.5 eV, and from 5100 to 5246 eV, ΔE=2 eV. Above this energy the barium K-edge (5247 eV) appears. Integration time was 1 s/step. Raw data were processed with Athena GUI for the IFEFFIT package (Ravel and Newville 2005). For obtaining pre-edge peaks’ area the fitting for XANES algorithm of Athena was used [36]. Results and Discussion X-ray Diffraction.
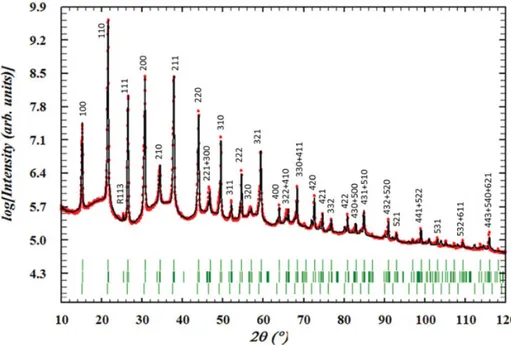
(8) Figure 1 shows the wide-angle, medium resolution diffraction pattern of the investigated material. Logarithmic scale is employed to enhance the low-intensity signals. A first approximation to a pattern modeling is included. Some significant elements that can be extracted from the analysis of this diagram are the following: =. The sample has a major component that produces the most. intense, sharp peaks up to 2θ. 120◦. This component is a. perovskite with cubic (P m3¯m.) or nearly cubic global structure. The most intense peaks in the pattern are indexed in cubic notation. Besides the primary phase, two other phases can be identified. =. The presence of a rhombohedral R3c phase is demonstrated by the appearance of the weak peak at 2θ 25.37◦. This peak has been indexed in hexagonal notation as R113. =The. third phase is formed by nanocrystals. This phase gives. raise to humps in the low-angle side of major maxima. Other authors have also observed these humps for BNBT ceramics from mixed≈ =. =. =. oxides [37], as well as for single crystals [38], of MPB composition. Due to structural peak broadening, the crystal symmetry of the associated phase cannot be clarified unambiguously. These signals are therefore modeled by simplicity using a Pm3m cubic structure, with a representative lattice parameter ac≈3.95Å, intermediate to those of BNT. and Å, cT. 4.035 Å). It must be noted.
(9) here that from our results it is not the symmetry. but its nano-size. morphology what constitutes the main experimental finding about this phase.. The diffraction pattern shows clearly that the background is not flat, but has a given structure. A structured background is a consequence of local deviations from average symmetry [39–41]. It provides information on the so-called local order and can be considered as a complement to the XANES technique. Figure 2 shows the high resolution experiment and its Rietveld characterization. For the intense peaks sub-set in the XRD patterns of the investigated sample, cubic (Pm3m [6], tetragonal (P4mm or P4bm) [25–27], rhombohedral (R3m and R3c) [26] and monoclinic (Cc) [18].
(10) space groups considered in the previous literature were tested. Structure models supported by the reported properties of the studied ceramic and leading to the best Rietveld reliability factors were adopted. One obvious structural model, in agreement with previous literature [26, 27, 42], could be the coexistence of a mesoscopic tetragonal P4mm phase with the FE rhombohedral R3c one, which is revealed in all our patterns by the presence of the 113 peak (Fig. 1). It must be clarified that the difference between a R3c phase and a monoclinic Cc one is subtle and a matter of discussion nowadays. Our experiment is not the best suited to elucidate the R3c-Cc issue (because the concentration of this phase is low). To confirm the model of coexisting rhombohedral and tetragonal mesoscopic phases, the identification as tetragonal of the humps on the low-angle side of the sharp and intense peaks (2θ 30◦) should be verified. The tetragonal consideration includes the idea of anisotropic peak broadening due to anisotropic lattice strain [43]. In the present study, the tetragonal phase option was unambiguously discarded as follows. On the one hand, reporting the observation of tetragonal P4bm phase is thoroughly justified if 1/2(00e) superstructure reflections are detected, as in [43], however, these are not observed in our X-ray experimental patterns (Figures 1 to 3). On the other hand, the.
(11) presence of a tetragonal FE phase (P4mm) has been reported by a number of authors from. an oversimplified consideration of the pseudo-cubic 200 peak splitting. A practical criterion to distinguish tetragonal from rhombohedral symmetries in perovskites is indeed the splitting of pseudo-cubic 111 (for≈rhombohedral) or 200 (for tetragonal) peaks. ≈ But the sole splitting of a given peak is not a proof of symmetry =. =. breakdown. Systematic coincidence of observed and calculated ≈. ≈. positions for all the diffraction maxima after a full-pattern Rietveld fitting is required for an unambiguous determination of crystal symmetry. The observation of the mentioned splitting can be used to.
(12) get a direct estimation of lattice parameters. The experimental doublets at 2θ 15◦, pseudo cubic 100 peak, and 2θ 30◦, pseudo-cubic 200 peak, in our patterns (Fig. 2) could suggest the presence of an abundant FE tetragonal P4mm phase, with plate-shaped crystals. Figure 3 shows the comparison of an example (red line) of experimentally observed pattern and the pattern generated for a tetragonal model (black line). Lattice parameters a 3.901 Å, c 3.950 Å allow exact fitting for the angular positions of the 100 and 200 doublets, but clearly lead to unacceptable misfit of all the remaining diffraction maxima (see insets at 2θ 22◦ and 2θ 26◦). Anisotropic peak broadening could also be included in the model, but this will not change the peaks positions and observed misfits. Unambiguously, at least for nanostructured BNBT6ceramics prepared as in this investigation, the model of coexistence of FE rhombohedral and tetragonal phases does not work. Regarding the nanoregions, another pseudo-cubic, but polar, symmetries could also be associated with them. The relaxor behavior of the ceramics [11], as well as the XANES results, indicate that the nanoregions are polar. Most probably, the AFE tetragonal P4bm.
(13) observed by TEM and neutron diffraction [15–17, 25, 44], could well be the space group of these nanoregions. Therefore, for our samples, we propose a three-phase model as the simplest option that best fits the XRD data and the published dielectric and piezoelectric properties. Our model consists of:. • A (globally) cubic Pm3m phase, • A rhombohedral R3c one and.
(14) • Nano-sized crystallites causing the humps.. The globally cubic Pm3m phase is the major phase (66%) in agreement with previous literature [16]. Table 1 shows the results of the Rietveld analysis performed on the basis of the mentioned three-phase model. In Rietveld refinement, texture is characterized by the inverse pole figure formalism [33]. In the present investigation, the reciprocal directions’ populations associated with the sample normal are characterized by means of the March-Dollase (MD) formula and the MD coefficient [45]. Preferred reciprocal direction h0 k0 l0 shows a population equal to (MD)−3 in the axial symmetry sample direction (“MD =. 1” means “random distribution” → and “MD. 0”. means “extremely sharp texture”). The three-phases-scenario is compatible with the TEM and neutron diffraction descriptions of the BNBT6 unpoled ceramics as a nanostructured relaxor [15–17, 25] with an averaged pseudo-cubic structure. Inside this matrix, PNRs (most probably antipolar tetragonal P4bm) are embedded. The experimentally observed relaxor behaviour of BNT was suggested to be explained by chemically ordered local areas that could act as nucleation sites for polar nano-regions [46]..
(15)
(16) Figure 4 shows the comparison of the XANES spectra from the Ti-foil reference, TiO2rutile powder, PbTiO3 thin film, BNBT6-powder and BNBT6-ceramic (see Table 1). When Ti4+ is placed inside oxygen’s octahedron, a center-symmetric environment, like in EuTiO3 and SrTiO3 at room temperature, provides no p-d mixing of electronic final states; it implies only quadrupole transitions with very low intensity. When an octahedral distortion exists, like in BaTiO3 or PbTiO3, the p-d mixing of final electronic states is possible and the dipole transition corresponding to the pre-edge feature (PEF) at the KX-ray absorption edge may be large. It has been established [24] that the intensity of the PEF is proportional to the distortion away from center-symmetry. Three peaks have been identified in the PEF of titanium oxides with perovskite structure [47]. The lowest energy peak (L) is caused by quadrupole transitions. The intermediate energy one (I) is directly related with the above mentioned p-d hybridization. Qualitatively, peak I is considered a spectroscopic signal of a spontaneous polarization for ferroelectricity in the perovskite structure crystal [47]. The area of peak I is proportional to the square of the mean-square displacement of the Ti4+ ion along the z-axis [47]. The highest energy peak (H) has its origin in the dipole-allowed transitions.
(17) of the transition metal 1s-electron into the transition metal 3doriginated molecular orbital (MO) of neighboring octahedron which are caused by overlapping of these MO with. the 1s-wavefunction. of the absorbing atom (band effect). XANES experiment does not specify in which crystallographic direction this displacement occurs. Figure 5 shows a magnification of the L, I and H features for the BNBT6 powder and areas with uncertainties, expressed as standard deviations. Differences observed in the main figure between XANES spectra from BNBT6-powder and BNBT6-ceramic are hardly visible. Fitting was performed with Lorentzian shape for the I peak and the area was fitted until a “good” R-factor was obtained. We found normalized area values for the I feature of 0.46, 1.0, 1.02 and 0.80 for the TiO2-rutile, PbTiO3, the BNBT6 powder and ceramic, respectively. Therefore, all BNBT6 samples show practically the same areas, and they are twice greater than centrosymmetric rutile I feature. These results show that BNBT6 samples have practically.
(18) equal Ti4+ cation displacement from symmetry center and confirm that even in the unpoled state the BNBT6 samples, powder and ceramic, have spontaneous polarization arising from the offdisplacement of the Ti4+ ion from the center of the oxygen octahedra.. 2. Conclusions. On the basis of our experimental results we suggest a multiphase model, not previously reported, for BNBT6 submicronstructured ceramics prepared from nanopowders by a novel route of hot-pressing and recrystallization. Our model refines earlier descriptions (based on lower resolution and narrower Q-intervals) that propose the coexistence of mesoscopic ferroelectric tetragonal (P4mm) and rhombohedral (R3c) phases. The global structure here modeled, a result of the full-pattern Rietveld analysis, comprises three phases:. 1. A major globally cubic Pm3m perovskite. At local scale,. EXAFS indicates that this phase is polar. 2. An averaged FE rhombohedral R3c phase. 3. A nanosized polar phase, most probably antipolar P4bm,. modeled as cubic for simplicity..
(19) References 1. E. Ringgaard, and T. Wurlitzer, J. Eur. Ceram. Soc. 25, 2701–6 (2005). 2. J. Rödel, W. Jo, K. T. P. Seifert, E.-M. Anton, T. Granzow, and D. Damjanovic, J. Am. Ceram. Soc. 92, 1153–77 (2009). 3. D. Damjanovic, Appl. Phys. Lett. 97, 062906 (2010). 4. T. Takenaka, K.-i. Maruyama, and K. Sakata, Jpn. J. Appl. Phys. 30, 2236 (1991). 5. B. Wylie-van Eerd, D. Damjanovic, N. Klein, N. Setter, and J. Trodahl, Phys. Rev. B 82, 104112 (2010). 6. R. Ranjan, and A. Dviwedi, Solid State Commun. 135, 394–9 (2005). 7. L. E. Fuentes-Cobas, M. E. Montero-Cabrera, A. Garcia, K. Brebol, E. Mercadeli, C. Galassi and L. Pardo, Contribution C-20. Proc. X Reunión Nacional de Electrocerámica, Madrid, 2011. 8. H. Simons, J. E. Daniels, J. Glaum, A. J. Studer, J. L. Jones, and M. Hoffman, Appl. Phys. Lett. 9. 102, 062902–5 (2013). 10. T. Oh, and M.-H. Kim, Mater. Sci. Eng., B 132, 239–46 (2006). 11. S. Greicius, J. Banys, Z. Ruzhong, and T. Granzow, IEEE Trans Ultrason Ferroelectr Freq Control 56, 1831–.
(20) 4 (2009). 12. L. Pardo, E. Mercadelli, A. Garcia, K. Brebol, and C. Galassi, IEEE Trans Ultrason Ferroelectr Freq Control 58, 1893–904 (2011). 13. J. E. Daniels, W. Jo, J. Rodel, D. Rytz, and W. Donner, Appl. Phys. Lett. 98, 252904–3 (2011). 14. H.-S. Han, W. Jo, J. Rödel, I.-K. Hong, W.-P. Tai, and J.-S. Lee, J. Phys.: Condens. Matter 24, 365901 (2012). 15. F. Craciun, C. Galassi, and R. Birjega, J. Appl. Phys. 112, 124106–9 (2012). 16. C. Ma, and X. Tan, Solid State Commun. 150, 1497– 500 (2010). 16. C. Ma, and X. Tan, J. Am. Ceram. Soc. 94, 4040–4 (2011). 17. C. Ma, H. Guo, S. P. Beckman, and X. Tan, Phys. Rev. Lett. 109, 107602 (2012). 18. E. Aksel, J. S. Forrester, J. L. Jones, P. A. Thomas, K. Page, and M. R. Suchomel, Appl. Phys. Lett. 98, 152901–3 (2011). I.. Levin, and I. M. Reaney, Adv. Funct. Mater. 22, 3445–52 (2012).. 19. M. E. Montero-Cabrera, X-ray absorption fine structure applied to ferroelectrics. In Multifunctional polycrystalline ferroelectric materials:281–346: Springer. Number of 281–346 pp. (2011)..
(21) 20. F. W. Kutzler, C. R. Natoli, D. K. Misemer, S. Doniach, and K. O. Hodgson, Journal of Chemical Physics 73, 3274–87 (1980). 21. J. Wong, F. W. Lytle, R. P. Messmer, and D. H. Maylotte, Phys. Rev. B 30, 5596–610 (1984). A. Bianconi, E. Fritsch, G. Calas, and J. Petiau, Phys. Rev. B 32, 4292–5 (1985)..
(22) https://cimav.repositorioinstitucional.mx/. 22. 24. B. Ravel, and E. A. Stern, Physica B 208–209, 316–8 (1995). 23. H. Simons, J. Daniels, W. Jo, R. Dittmer, A. Studer, M. Avdeev, J. Rodel, and M. Hoffman, Appl. Phys. Lett. 98, 082901–3 (2011). 24. W. Jo, J. E. Daniels, J. L. Jones, X. Tan, P. A. Thomas, D. Damjanovic, and J. Rodel, J. Appl. Phys. 109, 014110–7 (2011). 25. G. Picht, J. Töpfer, and E. Hennig, J. Eur. Ceram. Soc. 30, 3445–53 (2010). 26. V. Dorcet, G. Trolliard, and P. Boullay, Chemistry of Materials 20, 5061–73 (2008). 27. Y. Shiratori, A. Magrez, W. Fischer, C. Pithan, and R. Waser, The Journal of Physical Chemistry C 111, 18493–02 (2007). A. Moure, T. Hungr´ıa, A. Castro, and L. Pardo, J. Mater. Sci. 45, 1211–9 (2010). 28. E. Mercadelli, C. Galassi, A. Costa, S. Albonetti, and A. Sanson, J. SolGel Sci. Technol. 46, 39–45 (2008). A. Moure, A. Castro, and L. Pardo, Acta Mater. 52, 945–57 (2004). 29. L. Fuentes, Synchrotron Radiation Diffraction and Scattering in Ferroelectrics. In Multifunctional polycrystalline ferroelectric materials ed. L. Pardo and J. Ricote, 140, 217–80. Dordrecht: Springer. Number of 217-80 pp. (2011). 30. L. Pardo, A. Garc´ıa, K. Brebol, E. Mercadelli, and C. Galassi, Smart Mater. Struct. 19, 115007 (2010).. 22.
(23) https://cimav.repositorioinstitucional.mx/. 31. J. Rodr´ıguez-Carvajal, Physica B 192, 55–69 (1993). 32. B. Ravel, and M. Newville, Journal of Synchrotron Radiation 12, 537–41 (2005). 33. W. Jo, J. Rodel, J.-S. Lee, Y.-H. Baik, and C. Park, Funct. Mater. Lett. 03, 41–4 (2010). 34. Q. Zhang, X. Zhao, R. Sun, and H. Luo, physica status solidi (a) 208, 1012–20 (2011). 35. P. A. Thomas, S. Trujillo, M. Boudard, S. Gorfman, and J. Kreisel, Solid State Sci. 12, 311–7 (2010). 36. J. Kreisel, P. Bouvier, B. Dkhil, P. A. Thomas, A. M. Glazer, T. R. Welberry, B. Chaabane, and M. Mezouar, Phys. Rev. B 68, 014113 (2003). 37. S. Gorfman, and P. A. Thomas, J. Appl. Crystallogr. 43, 1409–14 (2010). 38. 42. B.-J. Chu, D.-R. Chen, G.-R. Li, and Q.-R. Yin, J. Eur. Ceram. Soc. 22, 2115–21 (2002). 39. M. Hinterstein, M. Knapp, M. Holzel, W. Jo, A. Cervellino, H. Ehrenberg, and H. Fuess, J. Appl. Crystallogr. 43, 1314–21 (2010). 40. V. Dorcet, and G. Trolliard, Acta Mater. 56, 1753–61 (2008). 41. E. Zolotoyabko, J. Appl. Crystallogr. 42, 513–8 (2009). 42. M. Groeting, S. Hayn, and K. Albe, Journal of Solid State Chemistry 184, 2041–6 (2011). 43. R. V. Vedrinskii, V. L. Kraizman, A. A. Novakovich, P. V. Demekhin, and. 23.
(24) https://cimav.repositorioinstitucional.mx/. S. V. Urazhdin, J Phys-Condens Mat 10, 9561–80 (1998).. 24.
(25)
Figure

Documento similar