DOI: 10.7569/JRM.2017.634117
*Corresponding authors: [email protected]
Derived from Pineapple Peel Residues
Melissa Camacho1, Yendry Regina Corrales Ureña*,1, Mary Lopretti2, Leonel Bustamante Carballo1,
Galia Moreno1, Brian Alfaro1 and Jose Roberto Vega Baudrit1,3
1National Laboratory of Nanotechnology, CENAT, Pavas, San José Costa Rica
2University of the Republic (UdelaR), Av. 18 de Julio 1824-1850, 11200 Montevideo, Departamento de Montevideo, Uruguay 3National University of Costa Rica UNA, Heredia, Costa Rica
Received November 25, 2016; Accepted February 24, 2017
ABSTRACT: Pineapple peel biomass was used as raw material for nanocellulose extraction. The raw material is a residue from the Costa Rican fruit industry. The nanocellulose was obtained by a two-step hydrolysis process. Firstly, the cellulose was hydrolyzed with HCl to obtain microcrystalline cellulose. In the second step, the hydrolysis was carried out using H2SO4 to obtain smaller fragments and decrease the lignin content. A time-dependent study was carried out to determine the particle size decrease depending on the contact time with the H2SO4. The chemical, thermal and morphological properties were analyzed by Fourier transform infrared spectroscopy (FTIR), thermogravimetric analysis (TGA), dynamic light scattering (DLS), zeta potential, atomic force microscopy (AFM) and scanning electron microscopy (SEM). The nanofiber-like cellulose was obtained after 60 minutes of exposure to 65 wt% H2SO4.
KEYWORDS: Nanocellulose, pineapple peels, acid hydrolysis, waste
1 INTRODUCTION
Cellulose is the most abundant natural polymer on earth’s surface, and it’s the primary component that provides stiffness and strength to plant structure. Roughly a third of the plant’s anatomy is composed by cellulose, and each year 1000 tons are produced by natural synthesis [1–3]. Since cellulose is highly avail-able, biodegradavail-able, naturally renewable and bio-compatible, it has become a material of particular rel-evance among scientists and material developers [1]. Because of these properties, it has been proposed as an alternative material to substitute petroleum-based polymers [2–4]. In Latin America, the pulp and juice of pineapples are exported while the shells remain in the country. These pineapple peels constitute a rich source of cellulose [5]. Fibers composed by cellulose constitute 19 wt% of the fruit and are composed of cel-lulose, hemicellulose and lignin; making it a potential material for obtaining nanocrystalline cellulose (NCC) due to the large amount of residues generated by agri-cultural industries [6].
Cellulose is a linear carbohydrate polymer com-posed of β-glucopyranose units linked by glycosidic
bonds. The NCC has a fiber-like and rod-like structure; therefore, it is crystalline [7]. Crystalline structures are formed by intra- and intermolecular hydrogen bonds [8]. The molecular length and properties depend on the natural source [9]. The particles length and width falls within the range of 200–500 nm and 5–10 nm, respectively [10].
Nanocrystalline cellulose exhibits many physi-cochemical qualitites that confer unique properties such as high bending strength (∼10 GPa), a Young’s
modulus of approximately 150 GPa, high aspect ratio and specific surface area. Consequently, it has been used as reinforcement for polymer matrices [11]. Additionally, the surface of NCC is covered with polar groups such as hydroxyl groups, which provide high moisture adsorption capacity and surface reactivity [12]. Nanoparticles derived from cellulose present a strong potential as stabilizers for oil-water suspen-sions (fats in toppings, salad dressings and sauces) [2], as reinforcement [13], drug delivery excipient, enzyme immobilization and scaffold for tissue engineering [12, 14] and biosensors [15], among others.
can be hydrolyzed with HCl and H2SO4 and then the crystalline sections can be recovered by centrifugation [16]. Nevertheless, other processes have been reported such as enzymatic hydrolysis, treatment with ionic liq-uids and radiolysis [9, 17].
This article aims to describe the hydrolysis condi-tions for extracting cellulose and producing NCC from pineapple peels. Furthermore, the characterization of NCC was performed using SEM and AFM to deter-mine morphology and ratio aspects, TGA to deterdeter-mine degradation temperature, DLS to determine polydis-persity, zeta potential to determine stability and FTIR to determine chemical composition and degree of crystallinity.
2 EXPERIMENTAL PROCEDURE
2.1 Materials
Pineapple peels were supplied by Florida Products S.A., Costa Rica. Sodium hydroxide (NaOH), sodium hypochlorite (NaClO), clorhidric acid (HCl), H2SO4 and ethanol reagents were purchased from Sigma-Aldrich and used as received without further purification. Avicel® PH-101 microcrystalline cellulose (Sigma-Aldrich) was used as reference sample for FTIR.
2.2 Microcrystalline Cellulose Preparation
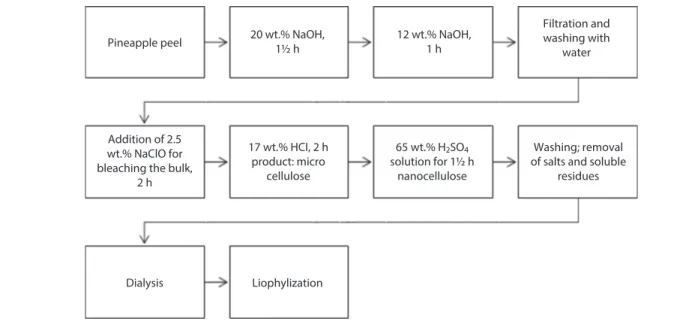
Figure 1 shows a diagram of the process for nanocel-lulose extraction from pineapple peel waste.
Pineapple peels were placed in a solution of 20 wt% NaOH at 70–90 °C for one and a half hour, cleaned and placed again in 12 wt% NaOH for one hour. Next,
they were bleached with a solution of 2.5 wt% NaClO at 60 °C for two hours. Afterwards, white cellulose was treated with 17 wt% HCl at 60 °C for two hours to obtain microcellulose.
2.3 Nanocrystalline Cellulose Preparation
The acid hydrolysis was carried out using a solution of 65 wt% H2SO4, temperature 55 °C and constant stir-ring between 0 to 75 minutes. Samples at 20, 35, 50, 60 and 75 min were taken for analysis. The samples were washed repeatedly with deionized water until they reached a neutral pH. Finally, nanocellulose suspen-sion was dialyzed for 24 h to remove salt residues.
2.4 Characterization Techniques
The FTIR spectra were recorded using a Thermo Scientific Nicolet 6700 spectrometer at a range of 500–4000 cm−1 and a resolution of 4 cm−1. The
Avicel PH-101, microcellulose and nanocellulose extracted from the pineapple biomass were ana-lyzed. Statistical analysis was conducted to study the repeatability of the calculated crystallinity data. The values were reported as x± µ, where x is the aver-age parameter and µ =ts n (t is the student’s t for 90% confidence, s is the standard deviation and n is the number of samples). The material morphology investigations after different contact times were done using a JEOL JSM-5900 LV SEM, acceleration voltage of 20 kV. The samples were coated before analysis with a 10 nm gold film.The sample’s topography was analyzed using an Asylum Research AFM operated
Figure 1 Scheme of procedure for obtaining NCC from pineapple peel waste. Dialysis
Addition of 2.5 wt.% NaClO for bleaching the bulk,
2 h
17 wt.% HCI, 2 h product: micro
cellulose
65 wt.% H2SO4 solution for 1½ h
nanocellulose
Washing; removal of salts and soluble
residues
Pineapple peel 20 wt.% NaOH,1½ h 12 wt.% NaOH,1 h
Filtration and washing with
water
in the tapping mode in air. Silicon probes (model Tap150Al-G, back side of the cantilever covered with Al) with resonance frequencies of 150 kHz and force constant of 5 N/m were used. For structure char-acterization the height differences were evaluated. Thermogravimetric analysis (TGA) was performed using a TA Instruments Q500 thermogravimetric analyzer. The samples (approx. 3 mg) were placed in a standard platinum pan. The mass change was measured between 50 °C and 1000 °C. Size distribu-tion and zeta potential were measured by a Zetasizer instrument (Nanoseries, Malvern model ZS90) at
λ1 = 628 nm and λ2 = 523 nm. Nanoparticle solutions
of 0.1 mg/ml were analyzed.
3 RESULTS AND DISCUSSION
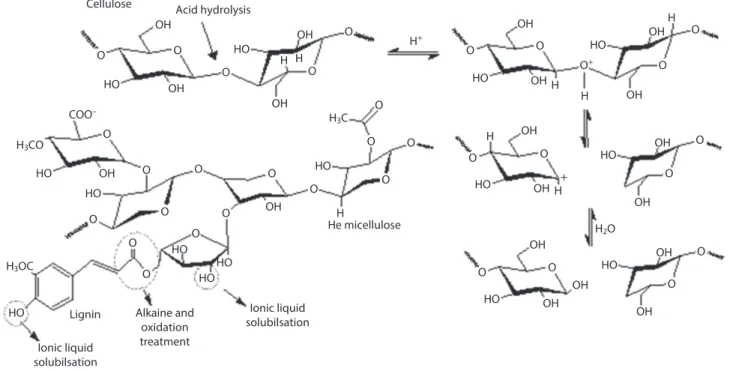
Initially, the lignin and other compounds like proteins were removed using NaOH and temperature. Figure 2 shows part of the lignocellulosic molecule and the sites which could react when in contact with the basic solu-tion. In this step, the lignin ester bond could be broken and the COO* groups were oxidized, as highlighted in Figure 2 [18].
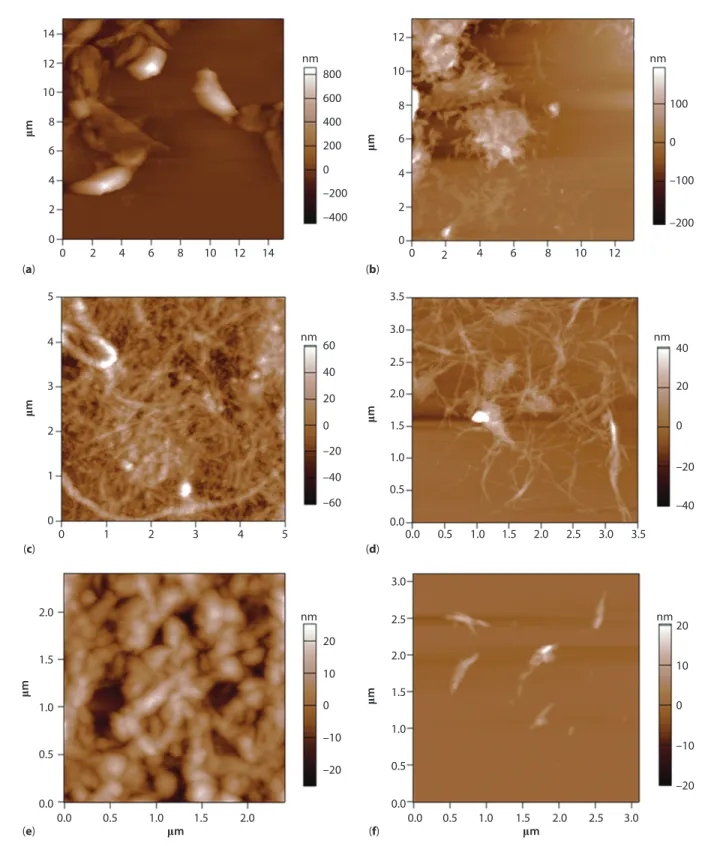
Figure 3a shows a microfiber-like particule with approximately 200 µm length and 16 µm diameter after the hydrolysis with HCl. This treatment pro-moted the partial hydrolysis of the cellulose, mainly by breaking the glycosidic bonds. The use of HCl
was necessary to decrease size. The reaction sites are showed in Figure 2.
The time-dependent study with H2SO4 was made to determine when the reaction should be stopped in order to obtain NCC and not degrade the product. The morphology of the material after contact with the H2SO4 was investigated using SEM and AFM, as can be seen in Figures 3 and 4. Between 20 and 60 min the fiber-like particles descreased in size, as can be seen in Figure 3b–e. The size of the fibers varies over a broad range of sizes; the samples obtained were poly-disperse, which was confirmed by the pI results in Table 1. However, Figure 3 shows that the tendency of decreasing particle size with time is even similar in the pI results. The particles obtained after 60 min-utes had a nanofiber-like morphology and after 75 minutes a more whisker- and round-like morphology. Both kinds of particles could be considered nanocel-lulose but according to the application one kind might be chosen. In general, longer reaction times yielded shorter nanocellulose particles. Times longer than 75 minutes produced a brownish color. This is associated with the degradation of the NCC. The H2SO4 treat-ment was used to break more glycosidic bonds and consequently to extract a nanofiber-like product. A careful control of the hydrolysis time was crucial. It was observed during several trials that long contact times and variation of temperature decomposed the nanocellulose to small organic molecules, producing a dark brown color.
Figure 2 Selectivity of chemical treatments for isolation of lignocellulosic materials of peels. Ionic liquid solubilsation Ionic liquid solubilsation He micellulose Lignin HO O O O Alkaine and oxidation treatment O O O O O O O O O O O O O O O O O O O O O O O O O O O O O H+ O+ H+ HO HO HO HO COO– HO HO HO HO HO HO HO HO OH OH OH OH OH OH OH OH OH OH OH OH OH OH OH H H H H H H OH OH OH OH
Cellulose Acid hydrolysis
Figure 4a,b shows the AFM images of the microcel-lulose. The material was heterogeneous and presents micro- and nanofibers. Particles with heights between 500 and 15 nm were imaged. Figure 4c,d shows the material in contact with H2SO4 for 60 minutes. The fraction of micrometer height fiber-like nanofibers decreased and the material was mainly composed by nanofibers with heights of 25 ± 8 nm, as it can be seen in Figure 5a. The sample after 75 minutes pres-ents a higher fraction of round-like particles, as shown in Figure 4e,f. The ratio length/diameter of the fiber decreased from approximately 500 to 120 after 60 minutes. The diameter size decreased faster than the length. After 75 minutes, whisker and round particles with 18 ± 6 nm sizes were obtained, as it can be seen in Figures 4d and 5b.
For determining the composition of material extracted and to correlate the decrease in size with the decrease in the amorphous part, time-dependant samples were analyzed by FTIR. The characteristic peaks of cellulose can be seen in all the spectras. The peak at 3336 cm–1 and at 2894 cm–1 were associated
with the O-H stretching signal and the C-H stretch-ing vibration, respectively. The symmetric C-O-C stretching of the glycosidic bond was detected at 895 cm–1 [19] and the C-O-C pyranose ring
stretch-ing at 1058 cm–1 [20]. The spectral peaks observed
at 1315 and 1367 cm–1 were attributed to twisting
vibrations of –CH2, -CH and –CO groups of aromatic rings that can be present in the sample. In contrast
to cellulose, lignin presents several aromatic rings in its structure. [21]. These aromatic rings can be represented by the signals at 1428, 1464, 1509 and 1601 cm–1 [22] because of the stretching and
vibra-tion of the C-H bonds conjugated in the ring. The decrease in the intensity of the bands in those wave-numbers was attributed to a low level of lignin, thus, it can be seen in the FTIR spectra that the bands in the aforementioned wavenumbers are very small in nanocellulose compared to microcellulose, as it can be seen in Figure 5b. This means that the procedure for removing the lignin from the pineapple peel was effective and the material is mainly cellulose. This is reasserted by Pandey [23], who argues that lignin content of the material is indicated by the 1505 cm–1
peak, which is not present in the spectra.
The presence of cellulose crystals in the sample was confirmed by the peak around 1429 cm–1,
corre-sponding to that of the –CH2 scissoring motion [24]. The FTIR spectral peaks used for estimation of the degree of crystallinity [19] are presented at 1424 cm–1
and at 895 cm–1 [25]. The empirical crystallinity of
the cellulose can be calculated by the ratio between the absorbance of these signals (1424/895 cm–1) and
the total crystallinity index was calculated by the ratio between the absorbance of the signals at 1367 and 2895 cm–1. The values are shown in Table 1. Another
parameter that provides useful information related to NCC crystallinity is the hydrogen bond intensity of cellulose (HBI) [26]. The HBI can be associated with
Figure 3 SEM micrographs of the product obtained after hydrolysis with H2SO4 for (a) 0, (b) 20 min, (c) 35 min, (d) 50 min, (e) 60 min, and (f) 75 min.
(a) (b) (c)
0 0
0 1 2 3 4 5 0.0 0.5 1.0 1.5 2.0 2.5 3.0 3.5
0
0.0 0.5 1.0 1.5 2.0
0.0 0.5 1.0 1.5 2.0 1 2 3 4
(a) (b)
(c) (d)
(e) (f)
2 4 6 8 10 12 14
2 4 6 8
m
m
m
m
m
m
m
m
m
m
m
m
mm 0.0 0.5 1.0 1.5 2.0 2.5 3.0
0.0 –20
–10 0 10 20 nm
–20 –10 0 10 20 nm –40
–60 –20 0 20 –200
–400 0 200
–200 –100 0 100 400
600 800
40 60 nm
–40 –20 0 20 40 nm nm nm
0.5 1.0 1.5 2.0 2.5 3.0 0.0 0.5 1.0 1.5 2.0 2.5 3.0 3.5 5
0 2 4 6 8 10 12
mm
10 12 14 0 2 4 6 8 10 12
Table 1 Empirical crystallinity and total crystallinity index (TCI) of NCC at different hydrolysis times with H2SO4 at 65 wt% and Avicel. The pI and zeta potential results at different NCC hydrolysis times.
Hydrolysis
time (min) Empirical crystallinity (1424/895 cm–1) TCI (1367/2895 cm–1) Hydrogen bond intensity (3336/1315 cm–1) PDI Zeta potential
5 2.44 ± 0.13 0.131 ± 0.016 203 ± 30
20 4.35 ± 1.14 0.109 ± 0.021 136 ± 15 0.344 41.0 ± 6.5
35 2.55 ± 0.73 0.107 ± 0.009 107 ± 12 0.400 33.2 ± 5.5
50 3.62 ± 0.88 0.092 ± 0.006 101 ± 5 0.318 34.2 ± 4.9
60 3.97 ± 0.64 0.097 ± 0.009 90 ± 8 0.477 41.4 ± 4.9
75 4.56 ± 1.19 0.106 ± 0.019 69 ± 17 0.335 35.8 ± 5.5
Avicel 4.79 ± 1.33 0.082 ± 0.007 293 ± 12
Figure 5 AFM height images and cross section of the product obtained after the hydrolysis of the microcellulose for 60 min with H2SO4.
0
0 –10
–5 0 5 10 15 20 nm
1 2 3
1 2 3
nm
0 1 2 3
m
m
mm
mm
the intermolecular regularity: an increase in the value is correlated with an increase in the crystallinity. The ratio between the bands at 3336 and 1315 cm–1
indi-cates the HBI. The values are shown in Table 1. Thermogravimetric analysis of NCC was conducted to observe the thermal stability of the NCC at different times of hydrolysis. Figure 6 shows the loss of water around 100 °C, represented by the slightly negative slope at the beginning of the TG curve. The thermal properties of the NCC seem to be similar for all hydro-lysis times, but there is a trend towards decreasing the initial decomposition temperature. This behavior can
be related to crystalline fraction, higher crystallinity, and higher degradation temperature, results which are supported by data shown in Table 1. The major crystallinity index leads to a higher thermal stabil-ity of the product [27]. The thermal resistance of the NCC is, in general, less than that of the MCC; this is because of the insertion of sulphate groups into lulose chains which catalyze the degradation of cel-lulose [24]. Another factor that can be related to this behavior is the change in the ratio of particle surface, which is higher in NCC than in MCC. Therefore, the lower degradation temperature of NCC arises from the smaller particle size and higher ratio of particle surface, as it can be seen in Figure 7.
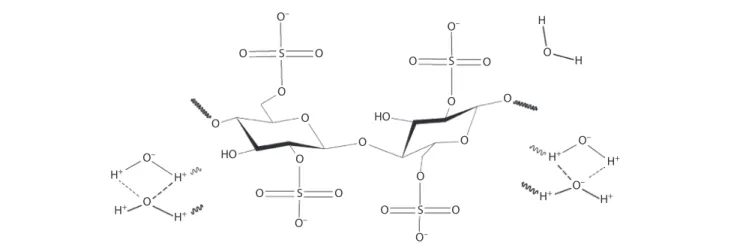
The zeta potential was determined by electropho-retic mobility of the particles in solution. Zeta poten-tial values higher than −15 mV represent the inipoten-tial agglomeration of the particles, while values lower than −30 mV signal the formation of a colloidal sus-pension [28]. Table 1 shows the zeta potential data for the nanocellulose suspensions. The negative charge can be attributed to the sterification of the hydroxyl groups to sulfate groups during the hydrolyzation [28, 29], as it is shown in Figure 8. This will allow van der Waals interactions between the nanocellu-lose, promoting an electrostatic repulsion between the nanofibers, preventing agglomeration.
Control of the hydrolysis time was crucial. Long contact times and higher variation temperatures could degrade the nanocellulose to small organic molecules, producing a dark brown color. Figure 9 shows the whitish color of the product. The experimental yield for the described process was approximately 3.65 wt%.
Figure 6 FTIR spectra of (a) The material obtained after different contact times with sulfuric acid, 4000 to 500 cm–1 (b) Microcellulose, avicel PH-101 and the final product (nanocellulose, 60 min in contact with sulfuric acid), 2000–800 cm–1.
4000
(a) (b)
200
0 3500
3350 2894 1634 1158
1368 1030 895
3000 2500 2000 2000 1800 1600
1634 1428 13681315 1158 10571028 895
1400 1200 1000 800
20 min 50 min 60 min
75 min Nanocellulose
Microcellulose Avicel
1500 1000
Wavenumber cm–1 Wavenumber cm–1
Transmittance (a.u.) Transmittance (a.u.)
Figura 7 TGA thermograms of NCC at different times of
hydrolysis wih H2SO4 at 65 wt%. 0
20 40 60 80 100
200 400 600 800
75 min 50 min 20 min
35 min
Temperature °C
4 CONCLUSIONS
In this research, the extraction of nanocellulose from agricultural biomass waste was described. Conditions such as solution concentration, temperature and time were optimized for obtaining NCC from the pineapple peels; envisioning an industry process. Nanocrystalline cellulose with nanofiber-like and nanorod-like structure was extracted from micro-crystalline cellulose by acid hydrolysis with HCl and H2SO4. A tendency towards smaller particles due to the increase in the contact time with H2SO4 was observed. The NCC was obtained after two hours and 60 min-utes in contact with the HCl and H2SO4, respectively.
REFERENCES
1. J. George and N.S. Sabapathi, Cellulose nanocrystals: Synthesis, functional properties, and applications. Nanotechnol. Sci. Appl.8, 45–54 (2015).
2. C. Gomez, A. Serpa, J. Velasquez, P. Ganan, C. Castro, L. Velez, and R. Zuluaga, Vegetable nanocellulose in food science: A review. Food Hydrocoll.57, 178–186 (2016). 3. N. Rambabu, S. Panthapulakkal, M. Sain, and A.
Dalai, Production of nanocellulose fibers from pine-cone biomass: Evaluation and optimization of chemi-cal and mechanichemi-cal treatment conditions on mechanichemi-cal
properties of nanocellulose films. Ind. Crops Prod. 83, 746–754 (2016).
4. F. Bettaieb, R. Khiari, M. Hassan, N. Belgacem, J. Bras, A. Dufresne, and M.F. Mhenni, Preparation and char-acterization of new cellulose nanocrystals from marine biomass Posidonia oceanica. Ind. Crops Prod.72, 175–182 (2015).
5. N. Lavoine, I. Desloges, A. Dufresne, and J. Bras, Microfibrillated cellulose – Its barrier properties and applications in cellulosic materials: A review. Carbohydr. Polym.90, 735–764 (2012).
6. M. Moya, M. Sibaja, M. Durán, and J. Vega, Obtención potencial de polímeros biodegradables. Estudio de la disolución de la cáscara de piña en PEG. Uniciencia 12, 39–43 (1995).
7. N. Lavoine, I. Desloges, A. Dufresne, and J. Bras, Microfibrillated cellulose – Its barrier properties and applications in cellulosic materials: A review. Carbohydr. Polym.90, 735–764 (2012).
8. K. Pickering, M. Aruan, and T.M. Le, A review of recent developments in natural fibre composites and their mechanical performance. Compos. Part A 83, 98–112 (2016).
9. H.P.S. Abdul, A.H. Bhat, and A.F. Ireana, Green com-posites from sustainable cellulose nanofibrils: A review. Carbohydr. Polym.87, 963–979 (2012).
10. M. Zaman, H. Xiao, F. Chibante, and Y. Ni, Synthesis and characterization of cationically modified nanocrystalline cellulose. Carbohydr. Polym.89, 163–170 (2012).
11. P. Lu and Y.-L. Hsieh, Preparation and properties of cellulose nanocrystals: Rods, spheres, and network. Carbohydr. Polym.82, 329–336 (2010).
12. M. Wajid, M. Ul-Islam, S. Khan, Y. Kima, and J. Kon, Structural and physico-mechanical characterization of bio-celluloseproduced by a cell-free system. Carbohydr. Polym. 136, 908–916 (2016).
13. J. Chandra, N. George, and S. Narayanankutty, Isolation and characterization of cellulose nanofibrils from areca-nuthusk fibre. Carbohydr. Polym. 142, 158–166 (2016). 14. L. Brinchi, F. Cotana, E. Fortunati, and J.M. Kenny,
Production of nanocrystalline cellulose from
Figure 8 Establishment of sulfate group on the nanocellulose surface. O
O
O
O
O O
O O
O
HO
HO
O–
O–
O–
H+
H+
H+
H+
O–
H+
H+ H+
H+
S
S
O
O
O–
S
O O
O O
O
O–
O–
S
O O O
H
H
Figure 9 Dried cellulose and nanocellulose samples.
lignocellulosic biomass: Technology. Carbohydr. Polym.
94, 154–169 (2013).
15. C. Salas, T. Nypelö, C. Rodriguez, C. Carrillo, and O. Rojas, Nanocellulose properties and applications in col-loids and interfaces. Curr. Opin. Colloid Interface Sci.19, 383–396 (2014).
16. A. Oun and J. Rhim, Characterization of nanocelluloses isolated from Ushar (Calotropis procera) seed fiber: Effect of isolation method. Mater. Lett.168, 146–150 (2016). 17. S. Kuzina, I. Shilova, V. Ivanov, Nikol’skii, A. Shcherban,
and A. Mikhailov, Influence of radiolysis on the yield of nanocellulose from plant biomass. High Energ. Chem.47, 308–313 (2013).
18. D. Guo, S. Wu, B. Liu, X. Yin, and Q. Yang, Catalytic effects of NaOH and Na2CO3 additives on alkali lignin pyrolysis and gasification. Appl. Energy95, 22–30 (2012). 19. I. Ibrahim, S. Hussin, and Y. Al-Obaidi, Extraction of
cellulose nano crystalline from cotton by ultrasonic and its morphological and structural characterization. Int.J. Mater. Chem. Phys. 1, 99–109 (2015).
20. A. Kumar, Y. Singh, C. Veena, and N. Kant, Characterization of cellulose nanocrystals produced by acid-hydrolysis from sugarcane bagasse as agro-waste. J. Mat. Phys. Chem.2, 1–8 (2014).
21. O. Derkacheva and D. Sukhov, Investigation of lignins by FTIR spectroscopy. Macromol. Symp.265, 61–68 (2008). 22. M.S. Peresin, Y. Habibi, J.O. Zoppe, J.J. Pawlak, and O.J.
Rojas, Nanofiber composites of polyvinyl alcohol and
cellulose nanocrystals: Manufacture and characteriza-tion. Biomacromolecules11, 674–681 (2010).
23. K.K. Pandey, A study of chemical structure of soft and hardwood and wood polymers by FTIR spectroscopy. J. Appl. Polym. Sci.71, 1969–1975 (1999).
24. R. Xiong, X. Zhang, D. Tian, Z. Zhou, and C. Lu, Comparing microcrystalline with spherical nanocrys-talline cellulose from waste cotton fabrics. Cellulose 19, 1189–1198 (2012).
25. M. Poletto, H.L. Ornaghi, and A.J. Zattera, Native cellu-lose: Structure, characterization and thermal properties. Materials7, 6105–6119 (2014).
26. S.Y. Oh, D.I. Yoo, Y. Shin, H.C. Kim, H.Y. Kim, Y.S. Chung, W.H. Park, and J.H. Youk, Crystalline struc-ture analysis of cellulose treated with sodium hydrox-ide and carbon dioxhydrox-ide by means of X-ray diffraction and FTIR spectroscopy. Carbohydr. Res. 340, 2376–2391 (2005).
27. A.C. Corrêa, E.M. Teixeira, L.A. Pessan, and C. Mattoso, Cellulose nanofibers from curaua fibers. Cellulose 17, 1183–1192 (2010).
28. Y. Zhou, S. Fu, L. Zheng, and H. Zhan, Effect of nano-cellulose isolation techniques on the formation of rein-forced poly (vinyl alcohol) nanocomposite films. Express Polym. Lett.6, 794–804 (2012).