Analysis of antioxidants from orange juice using countercurrent supercritical fluid extration, micellar electrokinetic chromatography and reverse phase HPLC / C Barbas [et al ]
6
0
0
Texto completo
(2) 6648. J. Agric. Food Chem. 2002, 50, 6648−6652. Analysis of Antioxidants from Orange Juice Obtained by Countercurrent Supercritical Fluid Extraction, Using Micellar Electrokinetic Chromatography and Reverse-Phase Liquid Chromatography CAROLINA SIMOÄ ,† ELENA IBAÑEZ,† FRANCISCO J. SEÑORAÄ NS,‡ CORAL BARBAS,§ GUILLERMO REGLERO,‡ AND ALEJANDRO CIFUENTES*,† Departamento de Caracterización de Alimentos, Instituto de Fermentaciones Industriales (CSIC), Juan de la Cierva 3, 28006 Madrid, Spain; A Ä rea de Tecnologı́a de Alimentos, Facultad de Ciencias, Universidad Autónoma de Madrid, 28049 Cantoblanco, Madrid, Spain; and Departamento de Quı́mica Analı́tica, Universidad San Pablo-CEU, 28668 Boadilla del Monte, Madrid, Spain. Antioxidants from orange juice were determined by the combined use of countercurrent supercritical fluid extraction (CC-SFE) prior to reverse-phase liquic chromatography (RP-LC) or micellar electrokinetic chromatography (MEKC). The separation of antioxidants found in the SFE fractions was achieved by using a new MEKC method and a published LC procedure, both using diode array detection. The characterization of the different antioxidants was further done by LC-mass spectrometry. Advantages and drawbacks of LC and MEKC for analyzing the antioxidants found in the different orange extracts are discussed. Although LC yields higher peak area and slightly better reproducibility than MEKC, the latter technique provides information about the CC-SFE extracts in analysis times 7 times faster than by LC. This analysis advantage can be used for the quick adjustment of CC-SFE conditions, thus providing a fast way to obtain orange fractions of specific composition. KEYWORDS: LC-MS; micellar electrokinetic chromatography; orange. INTRODUCTION. There is a growing interest in developing new processes devoted to obtaining high added-value products from natural sources. In previous studies, we have demonstrated the possibilities of using supercritical fluid extraction (SFE) to isolate compounds having antioxidative properties, for example, rosemary leaves and olive oil byproducts (1, 2). Among the different natural compounds that can show antioxidant properties, flavonoids are a particularly interesting group. Flavonoids are polyphenolic compounds widely distributed in nature exhibiting health-related properties based on their antioxidant activity. These properties include anticancer, antiviral, and anti-inflammatory activities, among others (3). Some in vitro and animal studies have demonstrated that flavonoids have antioxidant and antimutagenic activities and may reduce the risk of cardiovascular disease and stroke (4). The presence of flavonoids in citrus fruits and in citrus peel and seeds has been described (5, 6). Although antioxidants from orange are usually isolated by extraction with organic solvents (7), two studies have shown the possibilities of using SFE to * Author to whom correspondence should be addressed (fax +34-915644853; e-mail [email protected]). † Instituto de Fermentaciones Industriales (CSIC). ‡ Universidad Autónoma de Madrid. § Universidad San Pablo-CEU.. obtain antioxidative components from orange seeds (8) and orange juice (9). However, the isolated fractions are usually composed of active substances plus other impurities making a separation-identification step necessary. The usefulness of liquid chromatography (LC) with mass spectrometry (MS) and diode array detection (DAD) has been already demonstrated to identify, for example, nonvolatile components in lemon peel (10). Thus, LC has been widely used for the characterization of SFE extracts from different samples (11, 12). In two previous works, we have demonstrated the suitability of the use of reversed-phase liquid chromatography (RP-LC) coupled to MS and DAD to fully identify the antioxidant fraction of different extracts from SFE (1, 9). However, these LC separations usually required analysis times of >30 min, making the characterization of the multiple extracts obtained during the optimization of the SFE protocol a timeconsuming task. Capillary electrophoresis (CE) has emerged as a powerful analytical technique for the separation of ionic and neutral compounds and is able to provide high separation efficiencies in short migration times (13-17). Among the different modes of CE, micellar electrokinetic chromatography (MEKC) (18) continues to be the technique of choice for analyzing neutral compounds such as food antioxidants (19, 20). The main feature of MEKC is its high separation power, which brings about fast and well-resolved separations of compounds having very similar. 10.1021/jf025590u CCC: $22.00 © 2002 American Chemical Society Published on Web 10/02/2002.
(3) CC-SFE-MEKC and CC-SFE-LC Analysis of Antioxidants from Orange structures. Moreover, the sample volume consumption is minimal because each injection needs only a few nanoliters. These mentioned features make of MEKC a good alternative to the classical LC protocols. Although the possibilities of MEKC for the separation of different food antioxidants have already been demonstrated (19-22), to our knowledge no MEKC method has been developed so far for the separation of antioxidants from orange. The goal of the present work was to demonstrate the possibilities of applying MEKC to the analysis of orange extracts from countercurrent supercritical fluid extraction (CC-SFE). A comparative study of the capabilities of LC and MEKC to characterize orange SFE extracts was also carried out. MATERIALS AND METHODS Sample and Reagents. Oranges used in this study belong to the species of sweet oranges (Citrus sinensis) variety Valencia-Late. The orange juice was freshly squeezed using a manual juice squeezer for domestic use and filtered to remove pulp. All chemicals were of analytical reagent grade and used as received. Sodium dodecyl sulfate (SDS) from Merck (Darmstadt, Germany) and boric acid from Aldrich (Milwaukee, WI) were used for the MEKC running buffers at the different concentrations and pH values indicated below. The organic solvent methanol (MeOH) from Merck was of LC grade. Distilled water was deionized by using a Milli-Q system (Millipore, Bedford, MA). CO2 (SFC quality) was kindly donated by AL Air Liquide España S.A. (Madrid, Spain). Instrumentation Extraction Method. The CC-SFE system employed in this study has been previously described (9). The CC-SFE pilot plant has the following features: a countercurrent stainless steel extraction column (180 cm × 1.8 cm i.d. packed with 5 mm i.d. stainless steel balls) with three levels of sample introduction, two separator cells (270 mL capacity each), where a cascade decompression of the extruction fluid takes place, and a cryogenic trap at atmospheric pressure. Both CO2 and sample were preheated at the exit of their respective pumps (from Dosapro, Milton Roy) before introduction into the CC-SFE pilot plant. The plant has a computerized PLC-based instrumentation and a control system. During the extraction, a continuous flow of CO2 was introduced into the column, through the bottom side. When the operating pressure and temperature were reached, the liquid sample was pumped at the selected flow rate. The liquid sample introduction was carried out of the middle point of the packed column, located over the inlet of the CO2, creating a countercurrent between the sample flow (downward) and the CO2 flow (upward). The variable selected for the CC-SFE process was the solvent-tofeed ratio (S/F) that was tested at three different levels: 3, 7, and 11. For all of the conditions tested, the CO2 flow rate was kept constant at 2400 mL/h while the sample flow rate was modified (220, 340, and 800 mL/h) to obtain the desired solvent-to-feed ratios. Extraction and fractionation conditions were kept constant throughout the experiments: extraction pressure was chosen as 160 bar, and the cascade fractionation was achieved by setting pressures in separators 1 and 2 equal to 80 and 20 bar, respectively. These values were selected to test the countercurrent conditions over a wide range with minimum experimental problems. Extraction temperature was maintained at 40 °C to avoid sample degradation, whereas the temperatures in separators 1 and 2 were fixed to 35 and 25 °C, respectively. The total extraction time was 20 min. LC-DAD and LC-MS Analysis of the Extracts. The analysis of the extract components was carried out in an LC apparatus (Varian ProStar series), with an injection loop of 20 µL, equipped with a Spherisorb ODS2 column, 5 µm particle, 250 × 4.6 mm. The mobile phase was a mixture of solvent A (methanol) and solvent B (water) used in a step gradient. The LC run time lasted 50 min in changing from 99% B to 5% B at a flow rate of 1 mL/min. Detection was accomplished using a ProStar 330 photodiode array detector; storing the signal at a wavelength of 280 nm. A personal computer system running Varian software was used for data acquisition and processing.. J. Agric. Food Chem., Vol. 50, No. 23, 2002. 6649. Identification of compounds was confirmed by using a quadrupole 1100 MSD (Hewlett-Packard, Waldbronn, Germany) with an electrospray interface (ESI). In the LC-ESI-MS method, the eluted compounds were mixed with nitrogen in the heated nebulizer interface, and polarity was tuned to positive. Adequate calibration of ESI parameters (needle potential, gas temperature, nebulizer pressure) was required to optimize the response and to obtain a high sensitivity of the molecular ion. The selected values were as follows: needle potential, 4000 V; gas temperature, 335 °C; drying gas, 12.0 mL/min; and nebulizer pressure, 50 psi. MEKC Conditions. The analyses were carried out in a PACE-MDQ (Beckman Instruments, Fullerton, CA) CE apparatus, equipped with a DAD. The capillary used was a bare fused silica with 31.2 cm total length (21 cm effective length), 50 µm i.d. and 360 µm o.d., purchased from Composite Metal Services (Worcester, U.K.). Injections were made at the anodic end using an N2 pressure of 0.5 psi for 2 or 3 s (1 psi ) 6894.76 Pa). The instrument was controlled by an IBM PC running the 32 Karats software from Beckman. All measurements were carried out at 25 °C. Separation voltage was 20 kV, with detection at 280 nm. The separation electrolytes were prepared by weighing appropriate amounts of SDS and boric acid, dissolving in water, adjusting the pH by adding 1 M sodium hydroxide, and measuring with a pH meter model 40 from Beckman. Before first use, a new capillary was preconditioned by rinsing with 0.1 M NaOH for 30 min, followed by a 15 min rinse with deionized water. Between introductions of samples, the capillary was rinsed with 0.1 M sodium hydroxide for 0.5 min, with water for 0.5 min, and with the separation electrolyte for 1 min. At the end of each day, the capillary was rinsed with deionized water for 2 min. RESULTS AND DISCUSSION. In previous studies, we concluded that the sample flow rate was the main parameter controlling the efficiency and the selectivity of the CC-SFE system (9); therefore, in the present study this was the variable selected by means of the use of different solvent-to-feed ratios, S/F. As mentioned under Materials and Methods, to achieve the different ratios, a constant solvent flow rate was set at 2400 mL/h and the sample flow rate was changed at three different levels (800, 340, and 220 mL/h) to provide a wide range of S/F ratios, 3, 7, and 11 (experiments 1, 2, and 3, respectively). Extraction was performed at 160 bar and 40 °C, that is, using a solvent density of 0.8 g/mL, whereas the fractionation conditions selected implied a density of ∼0.5 g/mL in the first separator and total decompression of the fluid in the second separator. Three different products were obtained after extraction and fractionation of the orange juice: those in separators 1 (F1) and 2 (F2) and the raffinate (R). Extraction yields obtained in the different experiments decreased at higher sample flow rates and ranged from 0.6% (experiment 1) to 2% (experiment 3) in both separators. The extracts F1, F2, and R for experiment 3 (S/F ratio ) 11) were arbitrarily chosen to carry out an intensive optimization of the MEKC conditions. This was done because no CE method had been developed for the separation of antioxidants from orange. To develop a MEKC method, different SDS concentrations, buffer ionic strengths, and pH values were tested. In each case, three fractions were injected until a good separation of the different compounds of each fraction was obtained. It has to be noted that the most demanding fraction in terms of peak resolution was the R fraction (vide infra), whereas the peaks of the other two fractions, F1 and F2, were well resolved in practically all of the tested conditions. The initial MEKC conditions consisted of 100 mM boric acid/sodium tetraborate buffer at pH 9, and SDS concentrations of 0, 30, 50, 80, 100, 125, and 150 mM were tested. From this experiment it could.
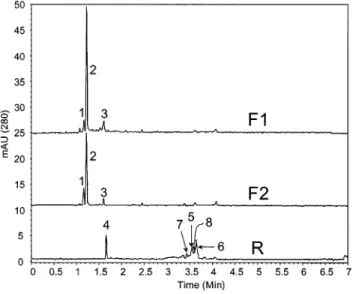
(4) 6650. J. Agric. Food Chem., Vol. 50, No. 23, 2002. Figure 1. MEKC separation of antioxidants from the F1, F2, and R extracts. of orange obtained by CC-SFE from experiment 3. Capillary, 27 cm of total length, 20 cm of detection length with 50 µm i.d.; injection, 0.5 psi for 2 s of each orange extract; temperature, 25 °C; detection at 280 nm; buffer, 100 mM SDS, 50 mM boric acid/sodium tetraborate at pH 8; run voltage, 20 kV. Peaks: 2, BA1; 5, naringin; 6, hesperidin; 7, narirutin; for the rest of the peaks, see the text.. be concluded that the best results in terms of resolution and analysis speed were achieved using 100 mM SDS. Next, keeping constant the SDS concentration (100 mM), and the pH equal to 9, different boric acid/sodium tetraborate concentrations (i.e., 25, 50, 75, and 100 mM) were tested. The best separation for the three fractions was obtained in this case using a 50 mM buffer. Finally, three different separation pH values were studied (8, 8.5, and 9) using 50 mM boric/tetraborate plus 100 mM SDS running buffers. The optimum buffer was determined to. Simó et al. be 50 mM boric acid/sodium tetraborate and 100 mM SDS at pH 8. Under these conditions, adequate separations of the different compounds from the three fractions (i.e., F1, F2, and R) were achieved. As can be seen in Figure 1, it was possible to obtain well-resolved separations of the different antioxidants and impurities from the three orange juice fractions with no detectable overlapping as demonstrated by using the peak-purity function of the diode array detector (i.e., absorbance ratioing). Moreover, the separation was completed in <5 min. Peaks in the MEKC electrophoregrams were tentatively assigned by comparing their UV spectra obtained from the CE diode array equipment with those obtained using the LC diode array instrument. A comparison between the LC and MEKC profiles is shown in Figures 2 and 3, where electrophoregrams and chromatograms of fractions F1, F2, and R from experiment 1 (S/F ratio ) 3) are given. As can be seen, LC provides much better sensitivity than MEKC at the expense of much longer analysis times (30 versus 5 min). Therefore, LC should be chosen when detection of minor compounds is needed, whereas MEKC should be used when rapid analysis of the extract composition is required. A detailed discussion about the compounds found in each fraction is given below. The peaks obtained from LC were further characterized by using LC-MS (9). Among the compounds in the orange juice detected by both LC-DAD-MS and MEKC-DAD, it was possible to determine the presence of different flavanones. Thus, some of the compounds extracted in the present work by using CC-SFE have the typical spectra of flavanones, with a maximum at around 285 nm and a shoulder in the region from 320 to 350 nm. This information together with the mass spectra obtained by LC-MS allowed us to determine the presence of narirutin, hesperidin, and naringin (peaks 5, 6, and 7, respectively, in all of the figures). It is well-known that these flavanones play an important role in human nutrition and are also used in the determination of citrus quality. The profile of flavanones. Figure 2. LC profiles obtained for experiment 1 fractions F1, F2, and R. DAD signal was at 280 nm. Peaks: 2, BA1; 5, naringin; 6, hesperidin; 7,. narirutin; 9, flavanone 1; 10, flavanone 2; for the rest of the peaks, see the text..
(5) CC-SFE-MEKC and CC-SFE-LC Analysis of Antioxidants from Orange. J. Agric. Food Chem., Vol. 50, No. 23, 2002. 6651. Figure 3. MEKC separation of antioxidants from the F1, F2, and R extracts. Figure 4. MEKC separation of antioxidants from the F1, F2, and R extracts. of orange obtained by CC-SFE from experiment 1. All conditions were as in Figure 1.. of orange obtained by CC-SFE from experiment 2. All conditions were as in Figure 1.. obtained in the present work is similar to the one described previously for the same variety of orange (23). The presence of benzoic acid 1 (BA1) could be detected in both LC-DAD-MS and MEKC-DAD separations (peak 2 in all figures). Although this compound could not be completely identified, the family of compounds to which it belongs could be assigned on the basis of the data of the UV and MS spectra. Thus, for BA1, the large and symmetric UV absorption maximum obtained at 283 nm can be assigned to a 4-substituted benzoic acid (e.g., p-hydroxybenzoic acid) and/or symmetric substitutions in the 3- and 5-positions of this compound (e.g., gallic acid). The major MS fragment obtained at m/z 121 could correspond, for example, to the ion HO-C6H4-CO+ derived from p-hydroxybenzoic acid. Moreover, the second UV maximum obtained at 230 nm can be assigned to some glycosylated derivative of benzoic acid (e.g., via an ester bond). These types of benzoic acids and their glycosides have been already reported in C. sinensis (24). Other peaks, such as 1 and 3, showed a typical polyphenolic UV profile (i.e., peak 1 showed a maximum at 300 nm, and peak 3 showed a shoulder at 220 nm and a maximum at 290 nm); however, they could not be identified further. Interestingly, we could detect compounds by LC that could not be detected by MEKC, and vice versa, due to sensitivity differences (e.g., peaks 9 and 10 in Figure 3). On the other hand, some compounds that showed a typical polyphenolic UV profile detected by MEKC using the diode array detector (e.g., peak 4 in all MEKC electrophoregrams from R extracts) could not be assigned to any peak in the corresponding LC separation. This would seem to indicate that probably this is an ionic compound that elutes in LC within the unretained front and migrates in MEKC due to its electrical charge. Interestingly, also peak 8 in Figures 3 and 4 (vide infra) showed a flavanone UV spectrum in MEKC, but it could not be correlated to any peak obtained by LC. This indicates that the peak corresponds to an isomeric form of some detected flavanone that could not be resolved by LC. These differences support the complementary nature of these two techniques, LC and MEKC, even when the fact that hydrophobicity is a common factor for both is considered. Using both techniques allowed the semiquantitative determination of the percentages of the different compounds found. Table 1. Comparison of Peak Area Reproducibility and Analysis Time. Reproducibilitya Obtained by MEKC and LC Separations. MEKC RP-LC. tav (min). %RSDt. areaav (au). %RSDarea. 3.7 26.8. 0.3 0.5. 2644 3685077. 8.2 5.9. a All data are referred to hesperidin (peak 6) detected in orange SFE extract R of experiment 3 and for n ) 5.. in the SFE extracts. To permit this comparison, two chromatograms that do not show unretained compounds were compared with their respective electrophoregrams. Namely, LC separations corresponding to fractions F1 and F2 of Figure 2 were compared with their respective electrophoregrams in Figure 3. Thus, the percentages of BA1 (peak 2) determined by LC were 87 and 81% in F1 and F2, respectively. The corresponding BA1 values determined by MEKC were 81 and 75%. Moreover, the determination of the other polyphenolic compounds (peaks 1 and 3 of Figures 2 and 3) also showed good agreement. Thus, the percentages determined by LC were, respectively, 7 and 6% in F1 and 15 and 4% in F2. Their corresponding percentages, determined by MEKC, were 8 and 11% in F1 and 18 and 6% in F2. The agreement between the results from both techniques is relatively good, corroborating the usefulness of both procedures for this type of analysis. On the other hand, LC shows a better reproducibility in terms of peak area than MEKC, and both techniques show similar analysis time reproducibility as can be deduced from the results shown in Table 1. However, the higher analysis speed of MEKC compared with that of LC has to be taken into account, because by using the MEKC procedure, a 7-fold decrease in analysis time is obtained (e.g., 3.7 min in MEKC versus 26.8 min in LC for hesperidin). Similar results have already been shown using other different food compounds (21, 25), concluding that both techniques LC and CE are complementary. One of the main goals in the isolation of antioxidants from natural sources is to be able to modify the extraction conditions in such a way that a tailored composition of the extracts can be obtained. This is also related to the interest of obtaining, for example, a pure antioxidant compound with the highest activity or a mixture of antioxidants with proved synergetic effect. The main advantage of MEKC, that is, its high separation speed,.
(6) 6652. J. Agric. Food Chem., Vol. 50, No. 23, 2002. can facilitate the rapid optimization of CC-SFE conditions. An example of this can be seen by comparing the electrophoregrams obtained from fractions of Figures 1, 3, and 4. As noticed, the CC-SFE parameters can be optimized to improve the selectivity of the extraction process, yielding a better recovery of BA1 (peak 2) in both fractions 1 and 2 while increasing the content of flavanones (peaks 5-8) in the raffinate. This improvement is intended because flavanones have been demonstrated to possess a very high antioxidative power among different compounds extracted from orange (23). ACKNOWLEDGMENT. We thank Chubby Vicente for kind help in the acquisition of the MS spectra. LITERATURE CITED (1) Señoráns, F. J.; Ibañez, E.; Cavero, S.; Tabera, J.; Reglero, G. LC/MS analysis of supercritical fluid extracts of orange plants. J. Chromatogr. A 2000, 870, 491-499. (2) Ibáñez, E.; Palacios, J.; Señoráns, F. J.; Santa Maria, G.; Tabera, J.; Reglero, G. Isolation and separation of tocopherols from olive by-products with supercritical fluids. J. Am. Oil Chem. Soc. 2000, 77, 187-190. (3) Benavente-Garcia, O.; Castillo, J.; Marin, F. R.; Ortuno, A.; del Rio, J. A. Uses and properties of citrus flavonoids. J. Agric. Food Chem. 1997, 45, 4505-4515. (4) Peterson, J.; Dwyer, J. Flavonoids: dietary occurrence and biochemical activity. Nutr. Res. 1998, 18, 1995-2018. (5) Pino, J. A. Flavonoids present in citrus fruits. Alimentaria 1997, 286, 63-79. (6) Bocco, A.; Cuvelier, M. E.; Richard, H.; Berset, C. Antioxidant activity and phenolic composition of citrus peel and seed extracts. J. Agric. Food Chem. 1998, 46, 2123-2129. (7) Masahiko, A.; Yoshiaki, M.; Toshihiko, O.; Kojiro, M. Antioxidant derived from citrus fruit. Pokka Corp., Jpn. Patent Appl. JP 10245552, 1998. (8) Tsuda, T.; Mizuno, K.; Ohshima, K.; Kawakishi, S.; Osawa, T. Supercritical carbon dioxide extraction of antioxidative components from tamarind (Tamarindus indica L.) seed coat. J. Agric. Food Chem. 1995, 43, 2803-2806. (9) Señoráns, F. J.; Ruiz-Rodriguez, A.; Cavero, S.; Cifuentes, A.; Ibañez, E.; Reglero, G. Isolation of antioxidant compounds from orange juice by using countercurrent supercritical fluid extraction (CC-SFE). J. Agric. Food Chem. 2001, 49, 6039-6044. (10) Baldi, A.; Rosen, R. T.; Fukuda, E. K.; Ho, C. T. Identification of nonvolatile components in lemon peel by high-performance liquid chromatography with confirmation by mass spectrometry and diode-array detection. J. Chromatogr. A 1995, 718, 89-97.. Simó et al. (11) Cuvelier, M. E.; Richard, H.; Berset, C. Antioxidative activity and phenolic composition of pilot-plant and commercial extracts of sage and orange. J. Am. Oil Chem. Soc. 1996, 73, 645-652. (12) Tena, M. T.; Valcárcel, M.; Hidalgo, P.; Ubera, J. L. Supercritical fluid extraction of natural anti-oxidants from orange: comparison with liquid solvent sonication. Anal. Chem. 1997, 69, 521-526. (13) Kuhr, W. G. Capillary electrophoresis. Anal. Chem. 1990, 62, 403R-414R. (14) Kuhr, W. G.; Monnig, C. A.; Capillary electrophoresis. Anal. Chem. 1992, 64, 389R-407R. (15) Monnig, C. A.; Kennedy, R. T. Capillary electrophoresis. Anal. Chem. 1994, 66, 280R-314R. (16) St. Claire, R. L. Capillary electrophoresis. Anal. Chem. 1996, 68, 569R-586R. (17) Beale, S. C. Capillary electrophoresis. Anal. Chem. 1998, 70, 279R-300R. (18) Terabe, S. Electrokinetic chromatography: an interface between electrophoresis and chromatography. Trends Anal. Chem. 1989, 8, 129-134. (19) Hall, C. A., III; An-Zhu; Zeece, M. G. Comparison between capillary electrophoresis and high-performance liquid chromatography separation of food grade antioxidants. J. Agric. Food Chem. 1994, 42, 919-921. (20) Abrantes, S.; Philo, M. R.; Damant, A. P.; Castle, L. Application of capillary electrophoresis in migration studies of food contact materials. I. Substituted phenolic additives. J. High Resolut. Chromatogr. 1997, 20, 270-274. (21) Ibañez, E., Cifuentes, A., Crego, A. L., Señoráns, F. J., Cavero, S., G. Reglero, G. Combined use of supercritical fluid extraction, micellar electrokinetic chromatography and reverse phase-LC for the analysis of antioxidants from rosemary (Rosmarinus officinalis L.). J. Agric. Food Chem. 2000, 48, 4060-4065. (22) Cifuentes, A.; Bartolomé, B.; Gómez-Cordovés, C. Fast determination of procyanidins and other phenolic compounds in food samples by micellar electrokinetic chromatography using acidic buffers. Electrophoresis 2001, 22, 1561-1567. (23) Robards, K.; Antolovich, M. Methods for assessing the authenticity fo orange juice. A review. Analyst 1995, 120, 1-28. (24) Macheix, J. J.; Fleuriet, A.; Billot, J. In Fruit Phenolics; CRC Press: Boca Raton, FL, 1990; p 77. (25) Cifuentes, A.; Frutos, M. de; Diez-Masa, J. C. Analysis of whey proteins by capillary electrophoresis using buffer-containing polymeric additives. J. Dairy Sci. 1993, 76, 1870-1875. Received for review April 11, 2002. Revised manuscript received September 4, 2002. Accepted September 6, 2002. C.S. thanks Consejerı́a de Educación y Cultura (Comunidad de Madrid) for a fellowship. This work was supported by AL Air Liquide, S.A. (Madrid, Spain), and by the Ministerio de Ciencia y Tecnologı́a (Project AGL2000-0448).. JF025590U.
(7)
Figure

Documento similar
In three space dimensions, we present existence results for weak solutions to a novel two-phase model for various electrokinetic phenomena, including in particular
Phase 2: SDSS pipeline for SFH and ex-situ population extraction Phase 3: Ex-situ population maps of resolved galaxies using MUSE. Schaye
Fatty acid composition (% of total fatty acids) of oils obtained by PLE at 60ºC with 3. dichloromethane/methanol (2:1) (D:M) and ethanol (EtOH) from LOCS
In the present investigation, we have produced additional antibodies against proteins of energy metabolism and applied RPMA technology to quantify and study the puta- tive relevance
This effect could be explained by an increase in the concentration of carnosic acid observed in the SR extracts, which was around 10-20% greater than the
In the present work, the supercritical fluid extraction of heather, marigold and the combined extraction of both plants (50:50 heather + marigold) was carried out, the concentration
A two-step process using supercritical fluid extraction with CO 2 has been developed to produce a low-alcohol beverage from wine that maintains the aroma and the antioxidant
For this purpose, the alcohol-ester and the alcohol- triglyceride binary group interaction parameters were regressed in this work, using experimental phase equilibria data from
