Ecosystem impacts of hypoxia: thresholds of hypoxia and pathways to recovery
13
0
0
Texto completo
(2) IOP PUBLISHING. ENVIRONMENTAL RESEARCH LETTERS. Environ. Res. Lett. 6 (2011) 025003 (12pp). doi:10.1088/1748-9326/6/2/025003. Ecosystem impacts of hypoxia: thresholds of hypoxia and pathways to recovery A Steckbauer1,5, C M Duarte1,2, J Carstensen3, R Vaquer-Sunyer1 and D J Conley4 1 Department of Global Change Research, IMEDEA (CSIC-UIB), Institut Mediterrani d’Estudis Avançats, C/Miquel Marqués 21, 07190 Esporles (Mallorca), Islas Baleares, Spain 2 The UWA Oceans Institute, University of Western Australia, 35 Stirling Highway, Crawley 6009, Australia 3 Department of Marine Ecology, National Environmental Research Institute, Aarhus University, PO Box 358, DK-4000 Roskilde, Denmark 4 Department of Earth and Ecosystem Sciences, Lund University, SE-223 62 Lund, Sweden. E-mail: asteckbauer@imedea.uib-csic.es. Received 27 November 2010 Accepted for publication 3 May 2011 Published 1 June 2011 Online at stacks.iop.org/ERL/6/025003 Abstract Coastal hypoxia is increasing in the global coastal zone, where it is recognized as a major threat to biota. Managerial efforts to prevent hypoxia and achieve recovery of ecosystems already affected by hypoxia are largely based on nutrient reduction plans. However, these managerial efforts need to be informed by predictions on the thresholds of hypoxia (i.e. the oxygen levels required to conserve biodiversity) as well as the timescales for the recovery of ecosystems already affected by hypoxia. The thresholds for hypoxia in coastal ecosystems are higher than previously thought and are not static, but regulated by local and global processes, being particularly sensitive to warming. The examination of recovery processes in a number of coastal areas managed for reducing nutrient inputs and, thus, hypoxia (Northern Adriatic; Black Sea; Baltic Sea; Delaware Bay; and Danish Coastal Areas) reveals that recovery timescales following the return to normal oxygen conditions are much longer than those of loss following the onset of hypoxia, and typically involve decadal timescales. The extended lag time for ecosystem recovery from hypoxia results in non-linear pathways of recovery due to hysteresis and the shift in baselines, affecting the oxygen thresholds for hypoxia through time. Keywords: hypoxia, recovery. 30 km band near the coast (Gilbert et al 2009), where shallow and enclosed bays with soft substrate, receiving riverine inputs and showing high stratification are most likely to experience hypoxia (Stachowitsch and Avcin 1988). The Baltic Sea, for example, is the largest dead zone in the world, and 20% of the Baltic Proper has been hypoxic for at least the last 40 years (Conley et al 2002). Diaz and Rosenberg (2008) reported that about 50% of the dead zones become hypoxic yearly in the summer after the spring bloom (e.g. York River in Chesapeake Bay). Approximately 17% of the ecosystems are hypoxic less than once per year, typically once a critical threshold of eutrophication has been exceeded (e.g. the New York Bight in 1976), and the excess organic matter produced is oxidized.. 1. Introduction 1.1. Hypoxia as a mounting problem worldwide Today more than 245 000 km2 of the ocean from at least 400 different areas worldwide are affected by hypoxia and most of these so-called ‘dead zones’ were not hypoxic when they were first studied (Diaz and Rosenberg 2008). Records throughout the world and the open ocean provide evidence that oxygen concentration is on decline in marine waters. The decline in oxygen concentrations is more prevalent and acute along the 5 Author to whom any correspondence should be addressed.. 1748-9326/11/025003+12$33.00. 1. © 2011 IOP Publishing Ltd Printed in the UK.
(3) Environ. Res. Lett. 6 (2011) 025003. A Steckbauer et al. Indeed, most hypoxic areas can be directly linked to human-caused eutrophication, defined as ‘an increase in the rate of supply of organic matter to an ecosystem’ (Nixon 1995, Andersen et al 2006). There have been multiple attempts to find an adequate definition of this term, for example the European Commission (EC) UWWT Directive (Anonymous 1991a) and the EC Nitrates Directive (Anonymous 1991b, both in Andersen et al 2006). Although the term was first coined in 1973 by Weber to indicate, ‘a nutrient enriched water body in which primary production was enhanced’ (Danovaro 2003), the most common usage of the term eutrophication is that from Nixon (1995). This includes an increase of organic matter production due to pelagic and benthic primary production as well as inputs of organic matter from adjacent waters or from land, via rivers or point sources (Andersen et al 2006). Increased inputs of mineral nutrients, primarily nitrogen and phosphorous, is recognized as the main driver for eutrophication (Andersen et al 2006). Eutrophication is a problem around the rim of the Mediterranean and in bays and estuaries along the coastlines of North and South America, Africa, India, South-East Asia, Australia, China and Japan (Nixon 1990, Gray 1992). It can be directly linked to dense human population and the increase of human living standards, which lead to population growth in the coastal zone and increasing industrial and agricultural activity. The increased use of fertilizers in agriculture (e.g. and the subsequent release of nitrogen oxides from fertilized soils) and deforestation is largely responsible for the increased nutrient inputs (Nixon 1990, Gray 1992, Diaz 2001). Indeed, riverine concentrations of dissolved nitrogen and phosphorous have increased continuously over the last decades in many river systems (e.g. the River Po in the Northern Adriatic Sea, Justic et al 1995). Hypoxia is a severe problem as it results in the death of marine organisms and loss of fisheries, which occur at higher oxygen concentrations than hitherto believed (VaquerSunyer and Duarte 2008), particularly in warm waters (VaquerSunyer and Duarte 2011) and those containing sulfide (VaquerSunyer and Duarte 2010). Recognition of hypoxia as a mounting problem in the coastal ocean has led to managerial actions to increase oxygen concentrations, generally involving a reduction in nutrient and organic inputs to coastal waters (Carstensen et al 2006). Whereas the processes leading to the onset of hypoxia are well understood (Conley et al 2009a), the recovery process is less understood, including the timescales involved in the recovery of coastal ecosystems from hypoxia, particularly for those ecosystems that were permanently hypoxic for an extended time. Whereas many ecosystems have started to experience hypoxia, few have returned to normal oxygen conditions following hypoxia. Here we present an overview of the recovery of coastal ecosystems from hypoxia. We first discuss the definition of hypoxia and the regulation of the oxygen thresholds that separate hypoxic ecosystems from those ecosystems with normal oxygen concentrations. We then discuss the processes involved in ecosystem recovery from hypoxia and examine recovery processes and the pathway and timescales for recovery for selected case studies to formulate a proposed conceptual framework for ecosystem recovery from hypoxia.. 1.2. Definition of hypoxia Hypoxia has been traditionally defined as the conditions of water bodies where oxygen concentration falls below 2 mg O2 L−1 (1.4 ml O2 L−1 , Diaz and Rosenberg 1995), following the observation of fisheries collapses below this oxygen threshold (Rosenberg et al 1991, Diaz and Rosenberg 1995, Renaud et al 2007, Diaz and Rosenberg 2008, Vaquer-Sunyer and Duarte 2008). Critical examination of the oxygen levels causing significant mortality of benthic organisms indicated that the 2 mg O2 L−1 threshold is too low, particularly for the more sensitive taxa (Vaquer-Sunyer and Duarte 2008). Indeed, hypoxia-driven mortality already affects most groups of benthic organisms at oxygen concentrations of 3 mg O2 L−1 (83rd percentile of the distribution of mean lethal oxygen concentrations, and represents about 44% oxygen saturation in warm waters; Vaquer-Sunyer and Duarte 2008). Hypoxia affects organisms in different ways, reducing their tolerance to other stressors, changing their behaviour (Riedel et al 2008), limiting their energy budget and affecting their growth and activity (Burnett and Stickle 2001), eventually causing death. 1.3. Ecosystem recovery from hypoxia Recovery from hypoxia depends on the extent of hypoxia and the extent of the ensuing changes in the communities. Short-term (hours to days) hypoxia does not decimate animal communities completely, whereas long-term hypoxia may remove all animal taxa, leading to a dominance of bacteria (e.g. Beggiatoa at the sulfide/oxygen interfaces, Nelson and Jannasch 1983, Møller et al 1985). Recovery from hypoxia is initiated as soon as normal oxygen conditions (i.e. oxygen concentration >3 mg O2 L−1 ) are reached again and is usually dominated in its initial phase by fast growing species that played a minor role in the communities prior to hypoxia (Stachowitsch 1991). The colonizing species are typically small in size and short-lived, possessing opportunistic life history traits that allow them to colonize ecosystems soon after hypoxia is alleviated (Diaz and Rosenberg 1995). Depending on the magnitude of the hypoxic event, recovery often follows a different pattern of species establishment than that of species lost during hypoxia, resulting in a hysteresis-like response of biodiversity to the alleviation of hypoxia (Diaz and Rosenberg 2008). Key factors regulating ecosystem recovery from hypoxia are the severity and duration of the hypoxic event, the intensity of hydrodynamic and mixing processes (Diaz and Rosenberg 1995), and the presence of other human pressures such as fisheries or dredging. Depending on all these factors, communities impacted by hypoxia can take years (Pearson and Rosenberg 1978) or even decades (Stachowitsch 1991, Mee et al 2005) to recover to the original community composition and density as those present before the hypoxic event following return to normal oxygen conditions.. 2. Oxygen threshold of hypoxia: variability and drivers Although the traditional definition of 2 mg O2 L−1 to designate hypoxic waters has been used extensively in the literature, 2.
(4) Environ. Res. Lett. 6 (2011) 025003. A Steckbauer et al. most aerobic organisms because it inhibits the cytochrome c oxidase activity at micromolar concentrations (Nicholls 1975). Sulfide concentrations increase in the sediments and overlying waters during the development of hypoxia, adding to the stress associated with low oxygen conditions. Indeed, the presence of sulfide reduces the survival capacity of metazoan organisms under low oxygen conditions. Vaquer-Sunyer and Duarte (2010) showed, through a meta-analysis, that the presence of hydrogen sulfide decreases survival times of marine benthic communities under hypoxia by, on average, 30%. This reduction is concentration dependent and varies with the sulfide levels that animals experience in their natural environments. The effect of sulfide on survival is greater for eggs than for juvenile or adult stages (Vaquer-Sunyer and Duarte 2010). Water temperature also exerts a strong modulating effect on oxygen thresholds for hypoxia. Temperature influences metabolic processes, which increases exponentially with temperature (Brown et al 2004), raising the oxygen requirements of marine organisms. Temperature is a key factor controlling the extent of hypoxia (Conley et al 2007), acting though a multitude of interacting processes, including increasing stratification and reducing ventilation of marine waters (Sarmiento et al 1998), as well as decreasing oxygen solubility with warming (Carpenter 1966, Garcia and Gordon 1992). A meta-analysis of temperature effects on oxygen thresholds for benthic organisms showed that survival times are reduced by, on average, 74% and that median lethal concentration increases by a mean of 16% for marine benthic organisms exposed to warming (Vaquer-Sunyer and Duarte 2011). Seawater warming decreases survival times of marine benthic macrofauna under hypoxia by a median of 3.9 ± 1.7 h ◦ C−1 and increases the oxygen thresholds for hypoxiadriven mortality by a median of 1.0 ± 0.1% saturation ◦ C−1 (i.e. 0.07 ± 0.01 mg O2 L−1 ◦ C−1 ). An assessment of the impact of 4 ◦ C warming (the average increase in temperature expected for the end of the 21st Century under moderate emission scenarios) on the survival time and the threshold oxygen concentrations for mortality of benthic macrofauna using the average Q 10 (the relative rate of increase in a metabolic rate expected for a 10 ◦ C temperature increase) values for median survival time (3.01 ± 0.29) and median lethal oxygen concentration (2.09 ± 0.20) derived by Vaquer-Sunyer and Duarte (2011) predict that survival times will decrease by a mean of 35.6% under hypoxia and that the threshold oxygen concentrations for high mortality to occur will increase by, on average, 25.5% in a 4 ◦ C warmer ocean. Hence, ocean warming is expected to increase the vulnerability of benthic macrofauna to reduced oxygen concentrations, increasing the mortality of benthic fauna and greatly extending the area of coastal ecosystems affected by hypoxia-driven mortality (Vaquer-Sunyer and Duarte 2010). Consideration of the thermodynamics of respiration by aerobic organisms lead Brewer and Peltzer (2009) to propose that increased CO2 levels should also affect the thresholds of hypoxia for marine organisms. Indeed increased CO2 in seawater and the associated ocean acidification also affect. ample experimental evidence indicates that this value may be inadequate to describe the onset of hypoxia impacts for many organisms that experience significant mortality at higher oxygen concentrations (Gray et al 2002, Vaquer-Sunyer and Duarte 2008). A meta-analysis on the oxygen thresholds for hypoxia-driven mortality of marine benthic organisms showed that oxygen thresholds vary greatly across taxa and that the conventional definition of 2 mg O2 L−1 used to designate waters as hypoxic is below the empirical sublethal and lethal oxygen thresholds for half of the species tested (Vaquer-Sunyer and Duarte 2008). Hypoxia thresholds also vary greatly across taxonomic groups, with crustaceans being the most vulnerable taxonomic group, where half of the species tested experiencing high mortality at 2.45 mg O2 L−1 (median lethal oxygen concentration for half of the tested species, Vaquer-Sunyer and Duarte 2008). A more robust precautionary limit to avoid catastrophic mortality events and effectively conserve marine biota has been proposed at 4.6 mg O2 L−1 , the 90th percentile of the distribution of mean lethal concentrations, which would be expected to maintain the populations for most, except the 10% most sensitive, species (Vaquer-Sunyer and Duarte 2008). This oxygen threshold is quite elevated, particularly for warm costal waters, where this precautionary limit may represent about 70% oxygen saturation. On the basis of these results we recommend the use of 3.5 mg O2 L−1 as a new operational oxygen threshold to designate hypoxic waters, as this threshold represents the 88th percentile of the distribution of mean lethal oxygen concentrations, expected to maintain the population for most, except for those of the 12% most sensitive species. A threshold of 3.5 mg O2 L−1 designating hypoxic water masses is more realistic and achievable, as it corresponds to about 52% oxygen saturation on warm coastal waters, but it is less conservative, than the proposed precautionary limit of 4.6 mg O2 L−1 . The 2 mg O2 L−1 traditional definition of hypoxia, represents the 62nd percentile of the distribution of mean lethal oxygen concentration and corresponds to about the 30% oxygen saturation in warm waters. The proposed 3.5 mg O2 L−1 as a general threshold for hypoxia implies that the number and area of coastal ecosystems affected by hypoxia and the future extent of hypoxia impacts on marine life need be reassessed upwards (Vaquer-Sunyer and Duarte 2008). A considerable number of areas that are not considered hypoxic at present, would be rated as hypoxic under this new definition, implying that hypoxia-driven mortality impacts biota in these areas. Low oxygen concentration not only affects marine organisms but also fundamental biogeochemical processes. Oxygen deficiency affects nutrient concentrations in the water column, as hypoxia increases phosphorus fluxes from the sediments to the overlaying waters and reduces the ability of the ecosystem to remove nitrogen (Conley et al 2009b). During the onset of hypoxia, electron acceptors are consumed, and prokaryotes shift to use alternative electron acceptors such as nitrite, nitrate, sulfate or metal oxides. Benthic metabolism shifts from aerobic to anaerobic pathways when sediments and overlying water becomes anoxic, leading to the accumulation of reduced metabolites such as sulfide. Sulfide is toxic to 3.
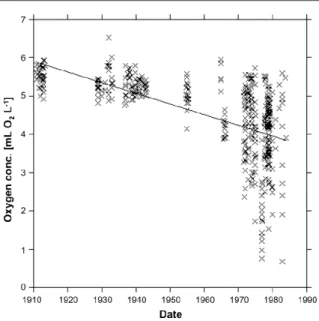
(5) Environ. Res. Lett. 6 (2011) 025003. A Steckbauer et al. respiratory processes by driving reduced binding affinity for oxygen in blood (Pörtner et al 2004) and a direct ventilatory sensitivity to CO2 (Burleson and Smatresk 2000, McKendry et al 2001). Hence, increased CO2 also poses challenges to aerobic respiration, possibly raising the oxygen thresholds for hypoxia, an impact that has only recently been postulated (Brewer and Peltzer 2009) and awaits an experimental test.. 3. Ecosystem recovery from hypoxia Whereas the impacts of hypoxia on ecosystems is relatively well understood through both observation of ecosystems undergoing hypoxia and experimentally induced hypoxia, the processes conducive to recovery are still poorly understood, as few ecosystems have recovered from hypoxia and the experimental assessment of hypoxia remains challenging. We examine here ecosystem recovery from hypoxia based on case studies of ecosystems that have indeed recovered from hypoxia, and consideration of the intervening biogeochemical processes determining the recovery pathway. Case studies are drawn from the Northern Adriatic Sea, the Black Sea, Danish estuaries, and Delaware Bay.. Figure 1. Oxygen concentration in the Northern Adriatic during August and September, over the period 1911–1984. Data from Justic et al (1987).. although hypoxic or even anoxic events are rapidly followed by mass mortality, the subsequent recovery from these mortality events takes years (Stachowitsch 1991). In the years 1984, 1985 and 1986 an increase of the biomass to 15, 49 and 36% of the former levels, respectively, were observed relative to the minimum biomass reached at the end of the hypoxic period in 1983. The recolonization process in these 3 years was dominated by atypical sessile species, including fast growing ascidians (Ciona intestinalis), Serpulide polychaetes and large populations of unusual species (Pinna sp. and Pecten jacobaeus). Intensive dredging in 1987 was conducive to biomass decline, followed by an increase in the total biomass by 15% (e.g. like in 1984), where the contribution of the species indicated above rose to nearly 39% of community biomass. A new small-scale mortality event occurred in 1988, when the community had not yet fully recovered, rendering further observation on the dynamics of recovery impossible. The development of the benthic community in the affected area was followed until 1994 (Kollmann and Stachowitsch 2001) to determine the long-term recovery of the community after 1983s mass mortality. This study showed that even within one decade, the community in the study area did not recover to its former composition, as described by Fedra et al (1976). Whereas the departure of the initial colonizer species from those present before hypoxia-driven impacts could be explained in terms of these species being opportunistic, this cannot explain failure of species that were dominant in the pre-disturbed community to recover. Hence, we suggest that other factors, including eutrophication, bottom fishing and dredging, affected the dynamics of the community during the recovery phase, possibly shifting the baselines relative to those in the pre-disturbed community and affecting community development. This case study shows that the slow return of the community to pre-anoxic conditions in terms of biomass involved a possible long-term shift in the composition of the. 3.1. The Northern Adriatic Sea The northern Adriatic Sea is particularly vulnerable to hypoxia (Stachowitsch 1986, Schinner et al 1997, Kollmann and Stachowitsch 2001). Its relatively high latitude makes the northern Adriatic subject to considerable seasonal fluctuations in temperature and solar radiation (Ott and Fedra 1977). Moreover, the semi-enclosed, shallow water body (mean depth 35 m), soft substrate, high riverine inputs of nutrients and organic matter (e.g. from the Po River, Degobbis et al 2000), high productivity and stratification all favour the development of seasonal hypoxic events (Stachowitsch 1986, Stachowitsch and Avcin 1988, Ott 1992). The benthic communities of the northern Adriatic Sea are characterized by macrobenthic communities living on soft-bottoms. The macroepibenthos suspension feeders in the Gulf of Trieste and along the Istrian coast are dominated largely by the sponge Reniera spp., the ascidian Microcosmus sulcatus and the brittle star Ophiothrix quinquemaculata, an assemblage termed the Ophiothrix–Reniera–Microcosmus community (ORMcommunity) by Fedra et al (1976). The epifauna are aggregated into so-called multi-species clumps or bioherms (Zuschin and Pervesler 1996), with an average biomass of 370 ± 73 g m−2 (wet weight). These communities are dominated by filter feeders, capable of removing approximately 5% of the pelagic biomass from the water column each day (Ott and Fedra 1977). Thus, the benthos acts as a buffer playing an important role as a natural eutrophication control (Officer et al 1982). Periodic hypoxic events have been observed in the Northern Adriatic for centuries (Crema et al 1991), but the frequency and extent of these events have increased during recent decades. As shown in figure 1 dissolved oxygen decreased since the 1910s (Justic et al 1987). Stachowitsch (1984, 1986) was among the first to describe the course of such oxygen crises in detail. These studies showed that 4.
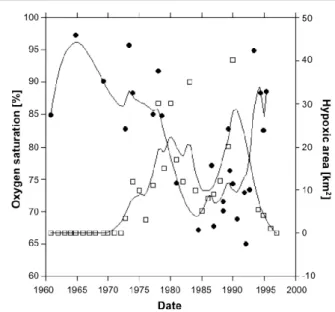
(6) Environ. Res. Lett. 6 (2011) 025003. A Steckbauer et al. Figure 2. Mytilus galloprovincialis biomass (g m−2 , full circles) and the size of the Phyllophora species (P. crispa, P. truncata) field in the Black Sea (km2 , open squares, Langmead et al 2009).. Figure 3. Oxygen saturation (%, full circles) and size of the hypoxic area (km2 , open squares) in the Black Sea. Data from Konovalov and Murray (2001) and Langmead et al (2009).. community structure so that recovery of the initial community structure may, if achieved, require extended time spans in excess of a decade. More formally, the Northern Adriatic exhibited hysteresis and shifting baselines in its recovery from hypoxia, a model proposed to affect the trajectories of coastal ecosystems when releasing pressures (Duarte et al 2009).. et al 1996, Humborg et al 1997). Increased nutrient inputs led to an increase in phytoplankton bloom frequency, cell density and number of bloom forming species from the beginning of the 1970s. Diatom and non-diatom blooms increased by a factor of 2.5 and 6 in bloom frequency and cell density respectively (Humborg et al 1997). Prior to the increase in nutrient inputs, the northwestern shelf of the Black Sea was inhabited by bivalves and red algae, including the keystone red algae species Phyllophora nervosa, covering an area of 11 000 km2 of the shelf, which provided habitat for about 118 species of invertebrates and 47 species of fish, some of them commercially important (Zaitsev 1992, Mee et al 2005). Increased phytoplankton blooms since 1975 led to low transparency and high production of detritus, causing oxygen depletion and hypoxia near the bottom when respired. These changes resulted in the decline of Phyllophora nervosa in the 1970s (figure 2). The bivalve communities, more resistant to hypoxia due to their capacity to withstand short periods of severe hypoxia (Mee et al 2005), experienced mortality as hypoxia increased in severity (figure 2). Mortality of mussels and other benthic filter feeders caused an increase in particulate organic carbon available to be respired by microbes, causing further oxygen depletion (Daskalov 2002). Indeed, benthic mortality under hypoxia acted as a feedback, amplifying benthic nutrient release and hypoxia. Oxygen concentrations decreased from the mid-1970s to 1986 parallel to an increase in the size of the hypoxic area (figure 3, Konovalov and Murray 2001, Langmead et al 2009). Konovalov and Murray (2001) suggest that there is a negative relationship between the thickness of the suboxic layer and the concentration of phosphate, implying that phosphate drives the proliferation of blooms, the decomposition of which eventually leads to hypoxia. These impacts were further exacerbated by the introduction of the ctenophore Mnemiopsis leidyi, which caused a collapse in the. 3.2. The Black Sea The Black Sea is a sensitive ecosystem that has experienced dramatic changes over the past decades. The sensitivity of the Black Sea results from its relatively large watershed and high riverine input, and the strong stratification due to the intrusion of subsurface salty Mediterranean water into the Black Sea basin through the Bosphorus Strait. Strong stratification reduces ventilation of thermocline waters, where oxygen consumption prevails, favouring oxygen depletion and the rise of the O2 –H2 S interface in the deepest part of the basin (Wilkin et al 1997). The oxygen balance of the Black Sea is also very sensitive to changes in riverine nutrient inputs, dominated by the Danube River, which contributes 70% of the riverine inputs into the Black Sea. In 1970–72 a dam was constructed on the Danube River at the Yugoslavia/Romania border by the so-called ‘Iron Gates’, which caused a significant change in the Danube’s discharge pattern (Humborg et al 1997). The annual silicate load decreased four-fold from 800×103 tons (assuming Si is present as H4 SiO4 ) in 1956–60 to 230–340 × 103 tons at present, due to retention behind the dam (Humborg et al 1997). In contrast, the annual P and N load increased two to four-fold, from 0.12 × 10⁵ ton and 1.4 × 10⁵ ton to 0.23–0.32 × 10⁵ ton and 4.8 × 10⁵ ton per year, respectively, due to the release of agricultural fertilizer (Cociasu et al 1996). This increase in nitrogen load led to a strong decrease in the annual mean Si:N ratios from 42 to 2.8, which can be correlated with to the increase in annual mean nitrogen concentration from about 1.3 µmol N L−1 in the early 1960s to about 7.9 µmol N L−1 in the 1980s (Cociasu 5.
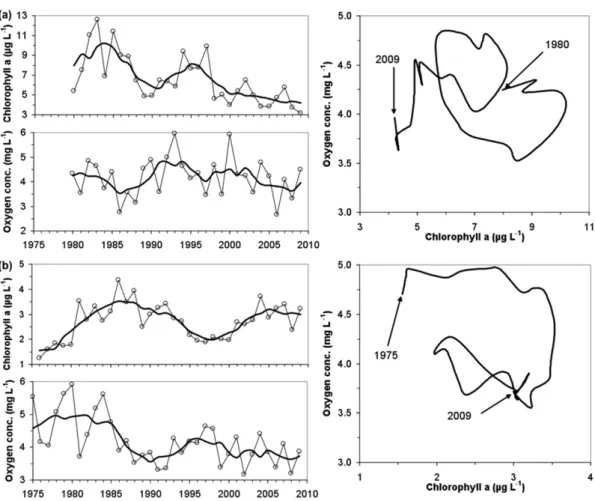
(7) Environ. Res. Lett. 6 (2011) 025003. A Steckbauer et al. a (Chla) (July–June, 12 months prior to the season used for oxygen means). To illustrate the time trajectories of oxygen conditions, 5 year moving averages were calculated to reduce the large interannual variation in the mean values. In both systems TN levels increased up to the beginning of the 1990s, peaking at 100 and 25 µmol L−1 for Skive Fjord and South Funen Sea, respectively (nutrient data not shown). Present TN levels are ca. 50 and 20 µmol L−1 , respectively. In Skive Fjord TP levels decreased since 1985 from about 3 to 1.7 µmol L−1 , whereas TP levels in South Funen Sea increased from 0.9 to 1.2 µmol L−1 in 1990 and then decreased to a present level of 0.7 µmol L−1 . In Skive Fjord Chla responded to reduced nutrient levels and decreased ca. 50% from ca. 9 µg L−1 in the mid-1980s to ca. 4.5 in most recent years (figure 4(a)). The response was less pronounced in South Funen Sea, where Chla increased from 1.5 µg L−1 in 1976 to >3 µg L−1 in the mid-1980s and has been oscillating between 2 and 3 µg L−1 since then (figure 4(b)). Despite decreasing trends of Chla since the mid-1980s, there has been no improvement in oxygen conditions in Skive Fjord (figure 4(a)) and actually a worsening of the oxygen conditions in South Funen Sea (figure 4(b)). Assuming that Chla is a proxy for the amount of organic matter leading to oxygen consumption in bottom waters and sediments, an inverse relationship between Chla and oxygen concentration was anticipated. However, time trajectories between Chla and oxygen concentrations reveal more complex and dynamic relationships that may not be directly applicable as a management tool (figure 4), unless other factors responsible for these complex trajectories are identified and quantified. Trends in both-Chla and oxygen show fluctuating behaviour, however, slightly out of phase that may indicate a delayed response in oxygen levels. Despite such potentially delayed responses there is no clear evidence to support the conceptual relationship suggesting that lower primary production and phytoplankton biomass would lead to reduced oxygen consumption and improved oxygen conditions. Consequently, there must be other mechanisms regulating hypoxia at these two sites and counteracting the management efforts to reduce the extent of hypoxia. Stratification patterns show no trends for the two sites, whereas bottom water temperature (June–October) has increased by 1.5 ◦ C during the study period at both sites (date not shown). Temperature-enhanced respiration combined with an altered nutrient diagenesis in the sediments under hypoxic conditions (Woulds et al 2007, Conley et al 2009c) can lead to both baselines and regime shifts, potentially explaining the lack of recovery observed in these two sites.. pelagic fish population and further increase in phytoplankton biomass, as it removed zooplankton grazers (Kidney 2002). A management framework was developed in the 1990s with the six Black Sea coastal countries (Bulgaria, Georgia, Romania, Russia, Turkey and Ukraine) signing the first convention for the protection of the Black Sea, primarily by reducing nutrient discharge (Mee et al 2005). The reduction of nutrient inputs was also a consequence of the collapse of the Soviet Union and the ensuing economic crisis, which resulted in reduced fertilizer application. The appearance of Beroe (B. ovata and B. cucumis), a predator of M. leidyi, helped the foodweb to recover. Kidney (2002) reports that phytoplankton biomass declined markedly and shifted towards a dominance of diatoms, signalling an improvement in ecosystem health. Moreover, the prevalence of fish mortality due to algal blooms decreased from more than eight species in the 1980s to only two species affected in the 1990s (Kidney 2002). Indeed, oxygen concentrations increased through the 1990s and the size of the hypoxic area decreased to reach pre-impact levels (figure 3). However, there was no sign of recovery of Mytilus galloprovincialis biomass or the area of the Phyllophora (P. crispa, P. truncata) field (figure 2), suggesting that the time elapsed since the return to normal oxygen concentrations is insufficient for the recovery of sensitive components of the ecosystems. This, again, provides evidence for hysteresis in ecosystem recovery from hypoxia. 3.3. Estuaries and coasts in Denmark Denmark first experienced the detrimental effects of coastal hypoxia on a relatively large scale in the 1980s, when extended areas of low oxygen water led to mass kills of fish and benthic animals; particularly the fishing of Norwegian lobster (Nephrops norvegicus) was severely affected and has never recovered. Ecosystem collapses following severe events of hypoxia in 1986, 1997 and 2002 have led to three action plans for restoring the aquatic environment, aiming at reducing nitrogen and phosphorus inputs by 50% and 80%, respectively. These adaptive management plans have been effective in reducing nutrient inputs and have significantly lowered nutrient levels in Danish coastal waters (Carstensen et al 2006). Despite reduced nutrient levels and extended periods with potential nutrient limitations, phytoplankton biomass is still high in many systems and hypoxia still prevails (Conley et al 2007). To exemplify this we will focus on two sites that have >30 years of data with reoccurring seasonal hypoxia. Skive Fjord is a shallow estuary (typically 5–10 m) and part of the larger estuarine complex Limfjorden in Northern Denmark, whereas South Funen Sea represents a coastal ecosystem with stagnant bottom waters at 15–40 m depth. During the summer and autumn months Skive Fjord is intermittently stratified, whereas the South Funen Sea is permanently stratified. Annual means were compiled from monitoring data from the Danish National Aquatic Monitoring and Assessment Program (DNAMAP) using the methods described in Conley et al (2007) for oxygen and temperature (June–October, the months when hypoxia may occur) and Carstensen et al (2006) for total nitrogen (TN), total phosphorus (TP) and chlorophyll. 3.4. Baltic Sea Hypoxia has occurred intermittently in the open waters of the Baltic Sea throughout the Holocene (Zillén et al 2008). The two most recent periods of hypoxia, e.g. during the Medieval Warm Period ca. 800–1200 AD and during the last ca. 100 years, are hypothesized to result from anthropogenic nutrient enrichment associated with changes in land use, development of agriculture and population growth (Zillén and Conley 2010). 6.
(8) Environ. Res. Lett. 6 (2011) 025003. A Steckbauer et al. Figure 4. Trends of chlorophyll a (July–June) and oxygen concentrations (June–October) for (a) Skive Fjord and (b) South Funen Sea. Trajectories to the right show the 5 year moving averages of Chla versus oxygen concentrations. Data were from the Danish National Aquatic Monitoring and Assessment Program (http://mads.dmu.dk).. the city of Stockholm have gradually increased with oxygen concentrations generally above hypoxic levels (figure 5). Despite this long-term increase in oxygen concentrations in bottom waters of the Inner Stockholm Archipelago (Lännergren 2010), bottom sediments have been characterized by highly reducing laminated sediments with impoverished macrobenthic communities. However, large populations of the invasive worm Marenzelleria sp. have been established in the last few years increasing oxygen penetration into sediments (Karlsson et al 2010). This case study demonstrates that recovery of benthic ecosystems can be delayed for decades even though significant increases in bottom water oxygen conditions occur.. Monitoring records show that the area of hypoxia has averaged 49 000 km2 over the last 50 years (Conley et al 2007) varying between 20 000 and 70 000 km2 depending on a number of factors, especially salt water inflows (Conley et al 2002). Hypoxia is the strongest factor influencing benthic community composition and abundance (Karlson et al 2002), although salinity variations also play a significant role in biodiversity. The separation between normal oxic, hypoxic and anoxic waters creates a temporal and spatial mosaic of habitats with recovery partly dependent upon the available pool of mobile colonists (Norkko et al 2006). These disturbances reduce the connectivity of populations and communities, which impairs recovery potential and threatens ecosystem resilience. Hypoxia is also common in the coastal zone of the Baltic Sea with over 100 sites recently identified as having experienced hypoxia with an increase in the number of systems experiencing hypoxia with time (Conley and Carstensen, unpublished data). Improvements in oxygen status were observed in 10 out of a total of 118 sites, whereas oxygen concentrations have declined in 32 sites, and 76 sites showed no trend at all. The majority of sites with improved oxygen conditions have occurred in the Stockholm Archipelago. Because of significant declines in nutrient loading from sewage treatment plants, bottom water oxygen concentrations in the Inner Stockholm Archipelago closest to. 3.5. Delaware Bay The Delaware Bay is a large, shallow, coastal plain estuary, formed by the 100 km long tidal Delaware River and the Bay itself. Water conditions changed following the arrival of Europeans (Stutz 1992) and by the middle of the 20th century the Delaware River was one of the ‘most polluted’ rivers in the world. Data of total nitrogen since the 1920s show an increase in loading through riverine inputs (Sharp 2010). Sharp (2010) documented long-term changes in oxygen values, which declined from well-oxygenated water and high 7.
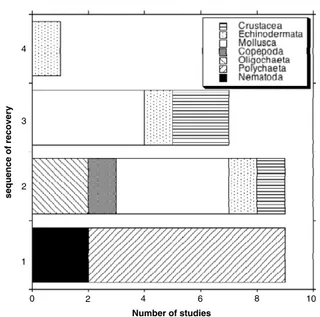
(9) Environ. Res. Lett. 6 (2011) 025003. A Steckbauer et al. Figure 5. Annual mean bottom water oxygen concentrations from stations located in the Inner Stockholm Archipelago (compiled from data kindly provided by C Lännergren, Stockholm Vatten).. Figure 7. Sequence of recovery of different taxa as indicated by the sequence of appearance of the taxa following the return to normal oxic conditions in a number of studies (out of a total of nine) describing the associated recolonization processes. Sequence one through four show the taxa that appeared first, that in second place and eventually that in fourth place along the colonization sequence. Some of the studies only showed recovery by two taxa, hence the number of studies showing a taxa recovering in fourth place are less than the total number of studies. The studies are: Rosenberg 1976, Arntz and Rumohr 1982, Travizi 1998, Lu and Wu 2000, Rosenberg et al 2002, Borja et al 2006, Lim et al 2006, Macleod et al 2007, Van Colen et al 2008.. in Delaware Bay are well documented (Sharp 2010), the biological responses to the onset of hypoxia and subsequent recovery of the oxygen values are not well documented and are confounded by the bacterial impacts to the oyster population indicated above. Yet, the dynamics of dissolved oxygen in Delaware Bay show that the recovery from hypoxia to normal oxic conditions may take several decades (i.e. 1960–1990, figure 6).. Figure 6. Long time record of dissolved oxygen concentrations (DO) in the Delaware River near Philadelphia from 1880 to present. The individual points represent average summer (July–August) values for individual years (redrawn from Sharp J H 2010 Limnol. Oceanogr. 55 535–48, copyright (2010) by the American Society of Limnology and Oceanography, Inc.).. 4. Patterns of recovery of biota from hypoxia water quality in the late 19th century to reach the lowest values in the 1920s–1970s (figure 6, Sharp 2010). A newspaper article during World War II (Anonymous 1944) described the discolouring of hulls and navy ships due to the presence of high hydrogen sulfide concentrations (Sharp 2010), which indicates the persistence of anoxia over many days, as otherwise hydrogen sulfide would not occur in the water column (Vaquer-Sunyer and Duarte 2010). Dissolved oxygen increased markedly following the development of sewage treatment plants, from about 1979 to 1990, with a significant annual increase of 10.4 µ mol O2 L−1 year−1 (r 2 = 0.95, p < 0.001) in the 5 year running average (Sharp 2010). In past decades the fauna of Delaware Bay were impacted by bacterial infections, further aggravating the impacts of hypoxia. There have been many records of oysters (Crassostrea virginica) infected by the ascetosporan parasite Haplosporidium nelsoni (MSX) (Haskin et al 1966, Ford and Figueras 1988). Whereas dissolved oxygen dynamics. The patterns of biological recolonization following hypoxia have been documented in nine reports (figure 7). Seven of these reports show that polychaetes pioneer and dominate the recovery process, with nematodes occasionally acting as pioneers (figure 7). Polychaetes are known to be the group most tolerant to low oxygen concentrations, explaining their role as pioneers in recolonizing areas after hypoxic events (Rosenberg 1976, Arntz and Rumohr 1982, Lu and Wu 2000, Rosenberg et al 2002, Borja et al 2006, Lim et al 2006). Molluscs are the second most important organisms in colonizing areas following hypoxia (figure 7). These patterns are consistent with experimental results of Lu and Wu (2000), who reported the initial recolonization within the first month after deploying sediment trays, previously defaunated by air-drying in the sunlight for 1 month in the Bay of Hong Kong. The first colonizers were polychaetes (57% of total species) and gastropods, 8.
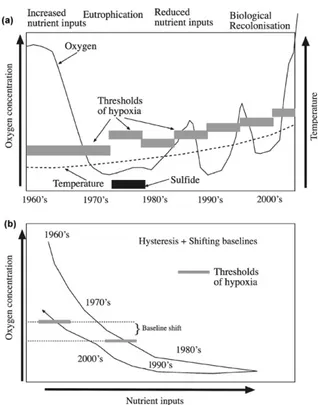
(10) Environ. Res. Lett. 6 (2011) 025003. A Steckbauer et al. contributing, in terms of numerical abundance, 27 % and 23 % of the community, respectively. Both abundance and number of species of the benthic community increased steadily, peaking at 6 and 9 months, respectively, and declined afterwards, indicating that an equilibrium community had been reached after approximately one year (Lu and Wu 2000). Another experiment, conducted in the Netherlands where small areas in a tidal mudflat were covered with a polyethylene sheet for 40 days (Van Colen et al 2008), showed recolonization to start with the gastropod Hydrobia ulvae, followed by the polychaetes Pygospio elegans, Nereis diversicolor and Polydora cornuta, and the bivalve Macoma balthica. The latter four species reached peak abundance after 98 days, and declined thereafter. The species Heteromastus filiformis and Aphelochaeta marioni colonized but never reached the abundance of the control values. Juvenile recovery was, in this study, much more important than recovery due to adults. Moreover, it showed a clear Pearson–Rosenberglike succession sequence, with a peak of abundance overshoot by opportunists (Van Colen et al 2008). However, other studies have provided evidence of an important role of adult recolonization. Wahl (1985) showed in an 8 month study in the Flensburg Fjord (May to December 1981) that adults of the anemone species Metridium senile appeared one week after the return to normal oxic conditions. Thus, the general sequences of recolonization of areas impacted by hypoxia following the return to normal oxic conditions followed a sequence typically initiated by polychaetes, followed by molluscs and then echinoderms (figure 7). These taxa correspond to the organisms with the lowest sublethal oxygen thresholds (Vaquer-Sunyer and Duarte 2008), which can best cope with hypoxic events. The timescales involved in the recovery of fauna span from months to years, whereas mortality following the onset of hypoxia occurs within hours to weeks. Hence, the recovery from hypoxia is expected to involve a hysteresis-like behaviour, due to the differential timescales of biological loss and recovery from hypoxia.. Figure 8. Conceptual diagram illustrating the characteristic temporal dynamics and processes conducive to hypoxia and subsequent recovery to normal oxygen concentrations (a), as well as the underlying dynamics of the relationship between oxygen and nutrient concentrations affected by hysteresis with shifting baselines (b).. of hypoxia (Vaquer-Sunyer and Duarte 2010) and acts as a trap binding oxygen, used to re-oxidize sulfide to sulfate. Moreover, anoxic conditions lead to the release of sediment stocks of nutrients, which maintain eutrophication processes even when nutrient inputs to the coastal ecosystem are reduced (Conley et al 2009b). These mechanisms anchor the ecosystem in a state of hypoxia and render the hypoxic state of ecosystems to be persistent, requiring major reduction in nutrient inputs for improvements to be realized (figure 8(b)). Once the biogeochemical buffers that tend to retain the ecosystem in a hypoxic state are weakened through, for instance hydraulic washout of the benthic nutrient pools, oxygen conditions may recover and the ecosystem may move into normal oxygen concentrations. However, this condition is not sufficient to restore the faunal components and benthic primary producers, which are essential, through their bioirrigation and bioturbation activities and their direct oxygen production, respectively, to maintain the normal oxygen state of the ecosystems. Hence, the normal oxic state is rather fragile and can be easily reverted to the hypoxic state in the interim, involving months to years, before colonization processes allow the restoration of the normal oxic biological community (figure 8(a)). In addition, baselines change along the decades spanning from the onset of hypoxia. In particular, the appearance of sulfide, when hypoxia prevails, raises the oxygen thresholds required for recolonization (figure 8, Vaquer-Sunyer and Duarte 2010). Moreover, warming of coastal waters during previous decades gradually raises the oxygen thresholds. 5. Towards an improved understanding of coastal ecosystem recovery from hypoxia The case studies and the patterns of biological recovery after hypoxia presented here reveal distinct timescales of ecosystems entering and recovering from hypoxia. Whereas hypoxia can readily develop following increased nutrient inputs and eutrophication, ecosystem recovery following reduced nutrient inputs involves annual to decadal timescales. The recovery time lag results from the combination of timescales involving the recovery of biogeochemical and biological components of the ecosystems (figure 8(a)). Hypoxia leads to the loss of ecosystem buffers that contribute to resilience against hypoxia. Loss of benthic invertebrate communities, with their capacity to increase oxygen penetration into the sediment through bioirrigation and bioturbation, favours a shift to anaerobic metabolic pathways, prominently sulfate reduction, with the appearance of sulfide as an end product, which exacerbates the biological impacts 9.
(11) Environ. Res. Lett. 6 (2011) 025003. A Steckbauer et al. required for recolonization further (figure 8, Vaquer-Sunyer and Duarte 2011). In addition, the long timescales for biological recovery, which the case studies reviewed above suggest span from months to years, add a time lag between the onset of normal oxygen concentrations and the recovery of the biological community. The net result of these processes is that nutrient inputs need be reduced well below the levels that triggered hypoxia for ecosystems to recover, as a result of time lags, hysteresis and shift in base lines (figure 8(b)). These processes result in decadal timescales for the recovery of ecosystems from hypoxia. These extended timescales render the recovery process a fragile one, as the recovery process may be interrupted by recurrent hypoxia events, aborting the incipient recovery, and arresting coastal ecosystems in periodic hypoxia, as observed in many coastal ecosystems (Conley et al 2009b). Because of the difficulties in restoring ecosystems back from hypoxia, managerial actions must focus on preventing the onset of hypoxia, by maintaining nutrient inputs below the levels conducive to hypoxia and by managing ecosystem components to build resistance to hypoxia.. Burnett L E and Stickle W B 2001 Physiological responses to hypoxia Coastal Hypoxia: Consequences for Living Resources and Ecosystems. Coastal and Estuarine Studies vol 58, ed N N Rabalais and R E Turner (Washington, DC: American Geophysical Union) pp 101–14 Carpenter J 1966 New measurements of oxygen solubility in pure and natural water Limnol. Oceanogr. 11 264–77 Carstensen J, Conley D J, Andersen J H and Ærtebjerg G 2006 Coastal eutrophication and trend reversal: a Danish case study Limnol. Oceanogr. 51 398–408 Cociasu A, Dorogan L, Humborg C and Popa L 1996 Long-term ecological changes in Romanian coastal water of the Black Sea Mar. Pollut. Bull. 32 32–8 Conley D J and Carstensen J, unpublished data Conley D J, Humborg C, Rahm L, Savchuk O P and F Wulff F 2002 Hypoxia in the Baltic Sea and basin-scale changes in phosphorus biogeochemistry Environ. Sci. Technol. 36 5315–20 Conley D J, Carstensen J, Ærtebjerg G, Christensen P B, Dalsgaard T, Hansen J L S and Josefson A 2007 Long-term changes and impacts of hypoxia in Danish coastal waters Ecol. Appl. 17 S165–84 Conley D J, Paerl H W, Howarth R W, Boesch D F, Seitzinger S P, Havens K E, Lancelot C and Likens G E 2009a Controlling eutrophication: nitrogen and phosphorus Science 323 1014–5 Conley D J, Carstensen J, Vaquer-Sunyer R and Duarte C M 2009b Ecosystem thresholds with hypoxia Hydrobiologia 629 21–9 Conley D J et al 2009c Hypoxia-related processes in the Baltic Sea Environ. Sci. Technol. 43 3412–20 Crema R, Castelli A and Prevedelli D 1991 Long term eutrophication effects on macrofaunal communities in the Northern Adriatic Sea Mar. Pollut. Bull. 22 503–8 Danovaro R 2003 Pollution threats in the Mediterranean Sea: an overview Chem. Ecol. 19 15–32 Daskalov G M 2002 Overfisheing drives a trophic cascade in the Black Sea Mar. Ecol. Prog. Ser. 225 53–63 Degobbis D, Precali R, Ivancic I, Smodlaka N, Fuks D and Kveder S 2000 Long-term changes in the northern Adriatic ecosystem related to anthropogenic eutrophication Int. J. Environ. Pollut. 13 495–533 Diaz R J 2001 Overview of hypoxia around the world J. Environ. Qual. 30 275–81 Diaz R J and Rosenberg R 1995 Marine benthic hypoxia: a review of its ecological effects and the behavioural responses of benthic macrofauna Oceanogr. Mar. Biol. Ann. Rev. 33 245–303 Diaz R J and Rosenberg R 2008 Spreading dead zones and consequences for marine ecosystems Science 321 926–9 Duarte C M, Conley D J, Carstensen J and Sánchez-Camacho M 2009 Return to neverland: shifting baseline affect eutrophication restoration targets Estuaries and Coasts 32 29–36 Fedra K, Ölscher E M, Scherübel C, Stachowitsch M and Wurzian R S 1976 On the ecology of a north Adriatic benthic community: distribution, standing crop and composition of the macrobenthos Mar. Biol. 38 129–45 Ford S E and Figueras A J 1988 Effects of sublethal infection by the parasite Haplosporidium nelsoni (MSX) on gametogenesis, spawning, and sex ratios of oysters in Delaware Bay, USA Dis. Aquat. Org. 4 121–33 Garcia H E and Gordon L I 1992 Oxygen solubility in seawater-better fitting equations Limnol. Oceanogr. 37 1307–12 Gilbert D, Rabalais N N, Diaz R J and Zhang J 2009 Evidence for greater oxygen decline rates in the coastal ocean than in the open ocean. Biogeosci. Discuss. 6 9127–60 Gray J S 1992 Eutrophication in the sea Marine Eutrophication and Population Dynamics ed G Colombo, I Ferrari, V U Cecchereli and R Rossi (Fredensborg: Olsen & Olsen) pp 3–15. Acknowledgments This research is a contribution to the ‘Water bodies in Europe: Integrative Systems to assess Ecological status and Recovery (WISER)’ project, funded by FP7 (contract number #226273) and project MEDEICG, funded by the Spanish Ministry of Science and Innovation (number CTM2009-07013). AS was funded by a fellowship from the government of the Balearic Islands. DJC and JC gratefully acknowledge funding by the BONUS HYPER Project and Baltic Sea 2020. We thank Christer Lännergren, Stockholm Vatten, for providing data.. References Andersen J H, Schlüter L and Aertebjerg G 2006 Coastal eutrophication: recent developments in definitions and implications for monitoring strategies J. Plankton Res. 28 621–8 Anonymous 1944 Usefulness of city as port threatened by river fumes Philadelphia Record. Anonymous 1991a Council directive of 21 May 1991 concerning urban waste water treatment (91/271/EEC) Official Journal L. 135 Anonymous 1991b Councol Directive 91/676/EEC of 21 December. Concerning the protection of waters against pollution caused by nitrates from agricultural sources Official Journal L. 375 Arntz W E and Rumohr H 1982 An experimental study of macrobenthic colonization and succession, and the importance of seasonal variation in temperate latitudes J. Exp. Mar. Biol. Ecol. 64 17–45 Borja A, Muxika I and Franco J 2006 Long-term recovery of soft-bottom benthos following urban and industrial sewage treatment in the Nervion estuary (southern Bay of Biscay) Mar. Ecol. Prog. Ser. 313 43–55 Brewer P G and Peltzer E T 2009 Limits to marine life Science 321 347–348 Brown J H, Gillooly J F, Allen A P, Savage V M and West G B 2004 Toward a metabolic theory of ecology Ecology 85 1771–89 Burleson M L and Smatresk N J 2000 Branchial chemoreceptors mediate ventilator response to hypercapnic acidosis in channel catfish Comp. Biochem. Physiol. 125 403–14. 10.
(12) Environ. Res. Lett. 6 (2011) 025003. A Steckbauer et al. Officer C B, Smayda T J and Mann R 1982 Benthic filter feeding: a natural eutrophication control Mar. Ecol. Prog. Ser. 9 203–10 Ott J A 1992 The adriatic benthos: problems and perspectives Proc. 25th EMBS Marine Eutrophication and Population Dynamics (Lido degli Estensi, Ferrara) (Fredensborg: Olsen & Olsen) pp 367–78 Ott J A and Fedra K 1977 Stabilizing properties of a high-biomass benthic community in a fluctuating ecosystem Helgoländer Wissenschaftliche. Meeresuntersuchungen 30 485–94 Pearson T H and Rosenberg R 1978 Macrobenthic succession in relation to organic enrichment and pollution of the marine environment Oceanogr. Mar. Biol. Ann. Rev. 16 229–311 Pörtner H O, Langenbuch M and Reipschläger A 2004 Biological impact of elevated ocean CO2 concentrations: lessons from animal physiology and earth history J. Oceanogr. 60 705–18 Renaud P E, Riedel A, Michel C, Morata N, Gosselin M, Juul-Pedersen T and Chiuchiolo A 2007 Seasonal variation in benthic community oxygen demand: a response to an ice algal bloom in the Beaufort Sea, Canadian Arctic J. Mar. Syst. 67 1–12 Riedel B, Zuschin M, Haselmair A and Stachowitsch M 2008 Oxygen depletion under glass: behavioural responses of benthic macrofauna to induced anoxia in the Northern Adriatic J. Exp. Mar. Biol. Ecol. 367 17–27 Rosenberg R, Agrenius S, Hellman B, Nilsson H C and Norling K 2002 Recovery of marine benthic habitats and fauna in a Swedish fjord following improved oxygen conditions Mar. Ecol. Prog. Ser. 234 43–53 Rosenberg R 1976 Benthic faunal dynamics during succession following pollution abatement in a Swedish estuary Oikos 27 414–27 Rosenberg R, Hellman B and Johansson B 1991 Hypoxic tolerance of marine benthic fauna Mar. Ecol. Prog. Ser. 79 127–31 Sarmiento J L, Hughes T M C, Stouffer R J and Manabe S 1998 Simulated response of the ocean carbon cycle to anthropogenic climate warming Nature 393 245–49 Schinner F, Stachowitsch M and Hilgers H 1997 Loss of benthic communities: warning signal for coastal ecosystem management Aquatic Conservation: Marine and Freshwater Ecosystems 6 343–52 Sharp J H 2010 Estuarine oxygen dynamics: what can we learn about hypoxia from long-term records in the Delaware Estuary? Limnol. Oceanogr. 55 535–48 (figure 6 redrawn from p 359) Stachowitsch M 1984 Mass mortality in the Gulf of Trieste: the course of community destruction Mar. Ecol. 5 243–64 Stachowitsch M 1986 The Gulf of Trieste: a sensitive ecosystem Nova Thalassia 8 (3) 221–35 Stachowitsch M 1991 Anoxia in the Northern Adriatic Sea: rapid death, slow recovery Modern and Ancient Continental Shelf Anoxia (Geol. Soc. Spec. Pub.) vol 58, ed R V Tyson and T H Pearson (London: The Geological Society) pp 119–29 Stachowitsch M and Avcin A 1988 Eutrophication-induced modifications of benthic communities Eutrophication in the Mediterranean Sea: Receiving Capacity and Monitoring of Long-term Effects (Unesco Rep. Mar. Sci.) 49 67–80 Stutz B 1992 Natural lives Modern Times (Crown Publishers) Travizi A 1998 Recovery of meiofauna after anoxic stress Period. Biol. 100 71–9 Van Colen C, Montserrat F, Vincx M, Herman P M J, Ysebaert T and Degraer S 2008 Macrobenthic recovery from hypoxia in an estuarine tidal mudflat Mar. Ecol. Prog. Ser. 372 31–42 Vaquer-Sunyer R and Duarte C M 2008 Thresholds of hypoxia for marine biodiversity Proc. Natl Acad. Sci. USA 105 15452–7 Vaquer-Sunyer R and Duarte C M 2010 Sulphide exposure accelerates hypoxia-driven mortality Limnol. Oceanogr. 55 1075–82 Vaquer-Sunyer R and Duarte C M 2011 Temperature effects on oxygen thresholds for hypoxia in marine benthic organisms Glob. Change Biol. 17 (5) 1788–97. Gray J S, Wu R S and Or Y Y 2002 Effects of hypoxia and organic enrichment on the coastal marine environment Mar. Ecol. Prog. Ser. 238 249–79 Haskin H H, Stauber L A and Mackin J A 1966 Minchinia nelsoni n. sp. (Haplosporida, Haplosporidiidae): causatve agent of the Delaware Bay oyster epizootic Science 153 1414–6 Humborg C, Ittekkot V, Cociasu A and Bodungen B v 1997 Effects of Danube river on Black Sea biogeochemistry and ecosystem structure Nature 386 385–8 Justic D, Legovic T and Rottinisandrini L 1987 Trends in oxygen-content 1911–1984 and occurrence of benthic mortality in the Northern Adriatic Sea Estuar. Coast Shelf Sci. 25 435–45 Justic D, Rabalais N N and Turner R E 1995 Stoichiometric nutrient balance and origin of coastal eutrophication Mar. Pollut. Bull. 30 41–6 Karlson K, Rosenberg R and Bonsdorff E 2002 Temporal and spatial large-scale effects of eutrophication and oxygen deficiency on benthic fauna in Scandinavian and Baltic waters—a review Oceanogr. Mar. Biol. Annu. Rev. 40 427–89 Karlsson O M, Jonsson P O, Lindgren D, Malmaeus J M and Stehn A 2010 Indications of recovery from hypoxia in the Inner Stockholm Archipelago Ambio 39 486–95 Kidney A E 2002 Fall and rise of the Black Sea ecosystem Science 297 1482–4 Kollmann H and Stachowitsch M 2001 Long-term changes in the benthos of the Northern Adriatic Sea: a phototransect approach Mar. Ecol. 22 135–54 Konovalov S K and Murray J W 2001 Variation in chemistry of the Black Sea on a time sclale of decades (1960–1995) J. Mar. Syst. 31 217–43 Langmead O, McQuatters-Gollop A, Mee L D, Friedrich J, Gilbert A J, Gomoiu M-T, Jackson E L, Knudsen S, Minicheva G and Todorova V 2009 Recovery or fecline of the northwestern Black Sea: a societal choice revealed by socio-ecological modelling Ecol. Model. 220 2927–39 Lännergren C 2010 Undersökninger i Stockholms skärgård 2009 (Investigations in Stockholm’s Archipeligo 2009) Stockholms Vatten Dnr 10SV299 Lim H, Diaz R J, Hong J-S and Schaffner L C 2006 Hypoxia and benthic community recovery in Korean coastal waters Mar. Pollut. Bull. 52 1517–26 Lu L and Wu R S S 2000 An experimental study on recolonization and succession of macrobenthos in defaunated sediment Mar. Biol. 136 291–302 Macleod C K, Moltschaniwskyj N A, Crawford C M and Forbes S E 2007 Biological recovery from organic enrichment: some systems cope better than others Mar. Ecol. Prog. Ser. 342 41–53 McKendry J E, Milsom W K and Perry S F 2001 Branchial CO2 receptors and cardiorespiratory adjustments during hypercarbia in Pacific spiny dogfish (Squalus acanthias) J. Exp. Biol. 204 1519–27 Mee L D, Friedrich J and Gomoiu M T 2005 Restoring the Black Sea in times of uncertainty Oceanography 18 (2) 100–11 Møller M M, Nielsen L P and Jørgensen B B 1985 Oxygen responses and mat formation by Beggiatoa spp. App. Environ. Microbiol. 50 (2) 373–82 Nelson D C and Jannasch H W 1983 Chemoautotrophic growth of a marine Beggiatoa in sulphide-gradient cultures Arch. Microbiol. 136 262–9 Nicholls P 1975 Inhibition of cytochrome-C oxidase by sulphide Biochem. Soc. Trans. 3 (2) 316–9 Nixon S W 1990 Marine eutrophication: a growing international problem Ambio 19 101 Nixon S W 1995 Coastal marine eutrophication—a definition, social causes, and future concerns Ophelia 41 199–219 Norkko A, Rosenberg R, Thrush S F and Whitlatch R B 2006 Scale and intensity-dependent disturbance determines the magnitude of opportunistic response J. Exp. Mar. Biol. Ecol. 330 195–207. 11.
(13) Environ. Res. Lett. 6 (2011) 025003. A Steckbauer et al. Zillén L and Conley D J 2010 Hypoxia and cyanobacterial blooms are not natural features of the Baltic Sea Biogeosciences 7 2567–80 Zillén L, Conley D J, Andrén T, Andrén E and Björck S 2008 Past occurrences of hypoxia in the Baltic Sea and the role of climate variability, environmental change and human impact Earth Sci. Rev. 91 77–92 Zuschin M and Pervesler P 1996 Secondary hardground-communities in the northern Gulf of Trieste, Adriatic Sea Senck. Marit. 28 53–63. Wahl M 1985 The recolonization potential of Metridium senile in an area previously depopulated by oxygen deficiency Oecologia 67 255–58 Wilkin R T, Arthur M A and Dean W E 1997 History of water-column anoxia in the Black Sea indicated by pyrite framboid size distributions Earth Planet. Sci. Lett. 148 517–25 Woulds C et al 2007 Oxygen as a control on sea floor biological communities and their roles in sedimentary carbon cycling Limnol. Oceanogr. 52 1698–709 Zaitsev Z 1992 Recent changes in the trophic structure of the Black Sea Fish. Oceanogr. 1 180–9. 12.
(14)
Figure
+2
Documento similar
Time course of cardiovascular and hematological responses in rats exposed to chronic intermittent hypobaric hypoxia (4600 m).. High Alt Med
The aim, of this work was to quantify the number and duration of the very high- speed running and sprinting events (VHSRS) and the recovery interval between them in 36 first and
In the preparation of this report, the Venice Commission has relied on the comments of its rapporteurs; its recently adopted Report on Respect for Democracy, Human Rights and the Rule
The draft amendments do not operate any more a distinction between different states of emergency; they repeal articles 120, 121and 122 and make it possible for the President to
H I is the incident wave height, T z is the mean wave period, Ir is the Iribarren number or surf similarity parameter, h is the water depth at the toe of the structure, Ru is the
Regulation of VCAM-1 levels through a VHL-PHD-NFκB-dependent pathway and its role in the immune response against clear-cell renal cell
In a previous study of this research group a significant increase of heart rate recovery from a maximum effort after a training protocol of resilience force in intermittent
The expression of most of the genes comprised in lung AM-related module 296 was upregulated in VHL-deficient AMs compared to control WT cells, including its associated
