Multivariate microaggregation with fixed group size based TSP
7
0
0
Texto completo
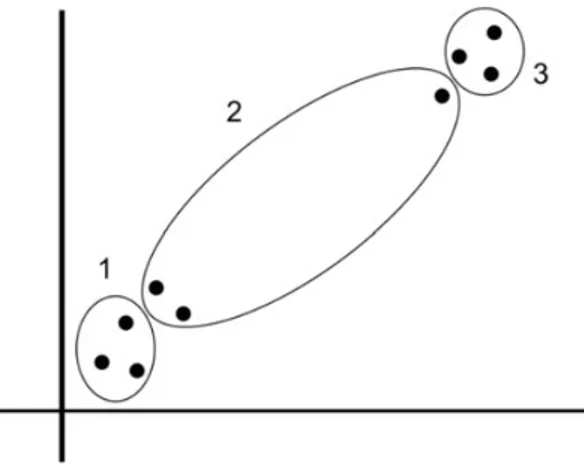
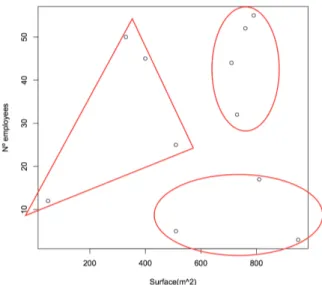
(2) 2. Fig. 1: Fixed-sized clustering with k=3. •. Key attributes. Also called quasi-identifiers are a set of attributes that can be linked with external information to identify the respondents. Examples are age, gender, job, zipcode, etc.. •. Confidential outcome attributes. These are attributes which contain sensitive information on the respondent. For example, salary, religion, political affiliation, health condition, etc.. The usual practice in SDC is for the data protector to apply microaggregation to a restricted set of attributes rather than to entire records in a dataset. A dataset is said to satisfy k-anonymity for k > 1 if, for each combination of values of key attributes, at least k records exist in the dataset sharing that combination, in this case, a snooper attempting re-identification with an identified external source can only hope to map an identified record in source to a group of k records in microaggreagated dataset. Microaggregation was proposed at Eurostat in the early nineties, and has since then been used by the British Office for National Statistics and other national agencies [4]. Example1 In this example we can see the use of microaggregation for k-anonymaity [2] [3]. The Table 1 show an original microdata set, for 11 companies in a certain town, the company name, the surface and the number of employees. The 3-anonymous version of the dataset in Table I is Table II. The identifier ”company name” has been deleted and optimal bivariate microaggregation with k=3 was used on the key attributes ”Surface” and ”Number of employees”. Both attributes were standardized to have mean 0 and variance 1 before microaggregation, in order to give them equal weight.. Fig. 2: Variable-sized clustering with k=3 TABLE I: Example1: original dastaset challenge is how to enforce cardinality constraints on groups without substantially increasing SSE. As shows, figure 2. Fixed-size microaggregation heuristics are computationally very efficient, however variable-size heuristics have lower information loss, increasing computational complexity, resulting in O(n3 ).. B. Privacy benefits of microaggregation The records in an original dataset [2] [11] can be classified in four categories: •. Identifiers. These are attributes that unambiguously identify the respondent. Examples are full name, social security number,etc. These data must be pre-processed and eliminated.. Company Name. Surface(m2 ). Number Employees. Com1 Com2 Com3 Com4 Com5 Com6 Com7 Com8 Com9 Com10 Com11. 790 710 730 810 950 510 400 330 510 760 50. 55 44 32 17 3 25 45 50 5 52 12.
(3) 3. Finally, we can see in Table II, that the 11 records were microaggregated into three groups. TABLE II: Example1: 3-anonymous version of dastaset. Surface(m2 ). Number Employees. 747.5 747.5 747.5 756.67 756.67 322.5 322.5 322.5 756.67 747.5 322.5. 46 46 46 8 8 33 33 33 8 46 33. II.. T HE PROPOSED METHOD. The proposed method is based on a well-known and important NP-hard combinatorial optimization problem, the traveling salesman problem (TSP) [8]. The TSP is to find a shortest possible tour that visits each city exactly once for a given list of cities an back to starting city. The innovation of our method lies in the representation as a graph theoretic problem to find clusters of records, in the dataset. This is done through TSP. A. Formulations of the TSP In this section, we briefly summarize two important formulations of the TSP [8] [5]. On the one hand, we will describe as a permutation problem and on the other hand can also be formulated as a graph theoretic problem. •. In example 1, there are two attributes that can make a graphical representation in R2 . In Fig.3 shows the results of three groups created.. Combinatorial optimization problem. The goal is to find the shortest tour that visits each city in a given list exactly once and then returns to the starting city. Formally, the TSP can be stated as follows. The distances between n cities are stored in a distance matrix D with elements di,j where i, j = 1, ..., n and the diagonal elemnets di,i are zero. A tour can be represented by a cyclic permutation π of {1,2,...,n} where π(i) represents the city that follows city i on the tour. Therefore, the TSP is then the optimization problem to find a permutation π that minimizes the length of the tour denoted by: n X. di,π(i). (4). i=1. For this challenge, the tour length of (n − 1)! permutation vectors have to be compared. This results in a problem which is very hard to solve, we know that is NP-complete [8]. •. Fig. 3: Optimal 3-partition of dataset. C. Contribution and plan of this paper In this paper we present a new method based on a problem from graph theory called Traveling Salesman Problem, that can be used over numerical dataset to group elements into similar groups for microaggregating a multivariate microdata. We will compare the results of the algorithms in terms of information loss and disclosure risk. In Section II the proposed algorithm is described. Section III presents experimental results. Finally, Section IV is a conclusion and future work.. Graph theory problem. The TSP is formulated by a complete graph G = (V, E), where the cities correspond to the node set V = {1, 2, ..., n} and each edge ei ∈ E has an associated weight wi representing the distance between the nodes it connects. The goal is to find a Hamiltonian cycle, i.e, a cycle which visits each node in the graph exactly once, with the least weight in the graph. This formulation leads to procedures involving minimum spanning trees for tour construction or edge exchanges to improve existing tours.. Finding the exact solution to a TSP with n cities requires to check (n − 1)! possible tours [8]. However, solving TSPs is an important part of applications in many areas including vehicle routing, computing wiring, machine sequencing and scheduling, frequency assignment in communication networks. Applications in statistical data analysis include ordering and clustering objects. For example, clustering and ordering using TSP solves is currently becoming popular in biostatistics [7]..
(4) 4. B. Heuristics for the TSP. path to the start city does not contribute to the path length.. The NP-hardness of the TSP already makes it more time efficient for small-to-medium size TSP instances to rely on heuristics in case a good but not necessarily optimal solution is sufficient (for example, figure 4). TSP heuristics typically fall into two groups: •. Tour construction heuristics which create tours from scratch, for instance, nearest neighbor algorithm and the insertion algorithms are tours constructors.. •. Tour improvement heuristics which use simple local search heuristics to improve existing tours.. Fig. 5: Hamiltonian path heuristic solution to records in example 1. Fig. 4: Hamiltonian cycle heuristic solution to records in example 1. C. The shortest Hamiltonian path The problem of finding the shortest Hamiltonian path through a graph (i.e., a path which visits each node in the graph exactly once, see figure 5) can be transformed into the TSP with cities an distances representing the graphs vertices and edge weights, respectively. Finding the shortest Hamiltonian path through all cities disregarding the endpoints can be achieved by inserting a ”dummy city” which has a distance of zero to all other cities. The position of this city in the final tour represents the cutting point for the path. The path starts with the first city in the list after the ”dummy” city and ends with the city right before it. Before it, the distance matrix between cities can be modified to solve related shortest Hamiltonian path starting with a given city. All distances to the selected city are set to zero, forcing the evaluation of all possible paths starting with this city and disregarding the way back from the final city in the tour. Note that, the distance to return from the last city in the. D. Rearrangement clustering The TSP can be used to obtain a clustering object [5]. The idea is that objects in clusters are visited in consecutive order and from one cluster to the next larger jumps are necessary. This type of clustering is called rearrangement clustering [1] and suggests to automatically find the cluster boundaries of k clusters by adding k dummy cities which have constant distance c to all other cities and are infinitely far from each other. In the optimal solution of the TSP, the dummy cities must separate the most distant cities and thus represent optimal boundaries for k clusters.. TABLE III: Example1: 3 Hamiltonian paths solution. Start City Com1 Com8 Com10. Hamilton Paths 1 8 10. 2 7 2. 3 6 6. 4 2 7. 5 10 8. 6 1 11. 7 5 9. 8 4 3. 9 3 4. 10 9 5. 11 11 1. Analyzing table 3, we can see that there are patterns that repeat. In mathematics, a n-tuple is a sequence of n elements [9], where n is non-negative integer. Continuing with example 1 where k-partition is 3-partition, the clustering problem is defined as finding tuples of k elements with greater frequency, in TSP solution. We can see, that the 3-tuple (3,4,5) appears in all paths. In the paths that start in Com10, the tuple is inverted as (5,4,3) but indicates proximity or a data clustering. It is also noted that the same applies to the 3-tuple (6,7,8), which appears on all Hamiltonian paths..
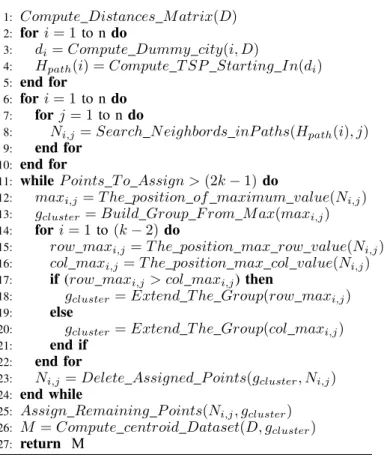
(5) 5. Algorithm 1 Multivariate Microaggregation with Fixed Group Size Based TSP Require: D dataset with n p-dimensional data points Require: k Minimum cardinality constraint Ensure: M Microaggregated Dataset 1: 2: 3: 4: 5: 6: 7: 8: 9: 10: 11: 12: 13: 14: 15: 16: 17: 18: 19: 20: 21: 22: 23: 24: 25: 26: 27:. Compute Distances M atrix(D) for i = 1 to n do di = Compute Dummy city(i, D) Hpath (i) = Compute T SP Starting In(di ) end for for i = 1 to n do for j = 1 to n do Ni,j = Search N eighbords inP aths(Hpath (i), j) end for end for while P oints T o Assign > (2k − 1) do maxi,j = T he position of maximum value(Ni,j ) gcluster = Build Group F rom M ax(maxi,j ) for i = 1 to (k − 2) do row maxi,j = T he position max row value(Ni,j ) col maxi,j = T he position max col value(Ni,j ) if (row maxi,j > col maxi,j ) then gcluster = Extend T he Group(row maxi,j ) else gcluster = Extend T he Group(col maxi,j ) end if end for Ni,j = Delete Assigned P oints(gcluster , Ni,j ) end while Assign Remaining P oints(Ni,j , gcluster ) M = Compute centroid Dataset(D, gcluster ) return M. E. The new fixed-size microaggregation heuristic A multivariate dataset consisting of n records and p numerical attributes can be represented as n points x1 , ..., xn in Rp . In our case, each record is represented by a city and its attributes are the position where the city is in the graph. The new fixed-size heuristic proposed in this paper, described in Algorithm 1, is as follows: •. Find a Hamiltonian path Hpath (n) traversing all n points of the dataset, starting in city n. Let the πHpath (n) be the permutation of {1, ..., n} expressing the order in which the points are traversed by Hpath (n).. •. Search the neighbors that are visited in order, resulting a simmetryc matrix Ni,j where the term i, j represents the number of times that i appears at a distance of (k − 1) in the paths to j.. •. The group generation starts searching the maximum value in Ni,j , that representing two neighboring cities that appear along the path. To find a k-partition, we search the maximum value in row and maximum value en column, select the largest and add it to the group.. This last step is done in (k − 2) times. At this moment, we have a k-partiton of the dataset int a number of groups. •. Compute the groups centroid. The centroids of the groups forming the matrix M, that is the microaggregated dataset.. Note that, if there are between k and 2k − 1 unassigned points a new cluster is formed with these points, if there are less points to be clustered, they are assigned to their closest cluster. Therefore, as all clusters have k points, this does not affect the size constraint imposed by microaggregation (i.e. in an optimal k-partition, each cluster must contain a number of points between k and 2k − 1).. F. Running example The new method, described in Algorithm 1, is illustrated by the next toy example. Let be D our data set from Example 1, considering k = 3. The algorithm operates in the next steps: •. Find a Hamiltonian path Hpath (n) traversing all n points of the dataset, starting in city n. The result is shown in table IV. TABLE IV: Hamiltonian paths on toy example.. Start City Com1 Com2 Com3 Com4 Com5 Com6 Com7 Com8 Com9 Com10 Com11. Hamilton Paths 1 2 3 4 5 6 7 8 9 10 11. 3 1 1 6 2 5 8 10 6 11 10. 4 3 2 7 1 2 10 11 5 8 8. 6 5 5 11 3 1 11 7 2 7 7. 7 4 4 10 4 3 4 9 1 9 9. 11 6 6 8 6 4 3 5 3 6 6. 10 9 7 9 9 7 1 2 4 4 4. 8 8 11 5 8 11 2 1 11 3 5. 9 10 10 2 10 10 5 3 10 1 2. 5 11 8 1 11 8 6 4 8 2 3. •. Search the neighbors that are visited in order, resulting a simmetryc matrix Ni,j where the term i, j represents the number of times that i appears at a distance of (k − 1) in the paths to j. For instance, we can see in table V, that Company 1 appears in 11 paths close to Company 2.. •. The group generation starts searching the maximum value in Ni,j , that representing two neighboring cities that appear along the path. To find a k-partition, we search the maximum value in row and maximum value en column, select the largest and add it to the group. The table VI shows the result.. 2 7 9 3 7 9 9 6 7 5 1.
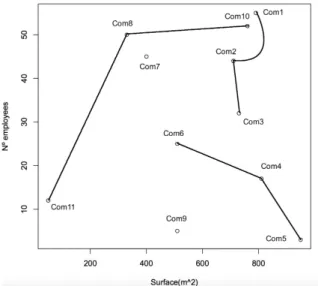
(6) 6. TABLE V: Hamiltonians paths on the toy example. Neighborhood at a distance of (k-1). Com1 Com2 Com3 Com4 Com5 Com6 Com7 Com8 Com9 Com10 Com11. Com1 11 11 8 11 0 1 0 1 1 1. Com2 11 10 2 10 3 2 0 4 1 1. Com3 11 10 9 3 5 1 1 1 0 3. Com4 8 2 9 3 8 4 1 4 2 3. Com5 11 10 3 3 6 2 1 6 1 2. TABLE VI: Generated group. Com6 0 3 5 8 6 7 4 7 1 3. Com7 1 2 1 4 2 7 6 5 10 9. Com8 0 0 1 1 1 4 6 10 11 8. Com9 1 4 1 4 6 7 5 10 6 3. Com10 1 1 0 2 1 1 10 11 6 11. Com11 1 1 3 3 2 3 9 8 3 11 -. TABLE VII: Addition of the last records. Group. Record 1. Record 2. Record 3. Group. Record 1. Record 2. Record 3. Record 4. Group 1 Group 2 Group 3 Remaining Points. Com1 Com10 Com6 Com7. Com2 Com8 Com4 Com9. Com3 Com11 Com5. Group 1 Group 2 Group 3. Com1 Com10 Com6. Com2 Com8 Com4. Com3 Com11 Com5. Com7 Com9. The figure 6 represents the generated group with the dataset from example 1.. In the last step, compute the groups centroids. The groups centroids forming the matrix M, that is the microaggregated dataset. The table VIII shows the centroids: TABLE VIII: Toy example: 3-anonymous version of dastaset.. Fig. 6: Generated group with MF-TSP. The proposed method can leave some records unassigned at the end of the main loop. Thus, it is necessary to assign these records to a group before ending the algorithm. The remaining records are assigned to their closest group. Adding last points result, we can see in table VII.. Surface(m2 ). Number Employees. 743.33 743.33 743.33 695 695 695 385 385 695 385 385. 43.66 43.66 43.66 12.5 12.5 12.5 39.75 39.75 12.5 39.75 39.75.
(7) 7. III. E XPERIMENTAL R ESULTS In this section we present the experimental results of our proposed method. We have used a real microdata set called ”Census”. That microdata set contains 1,080 records with 13 numerical attributes. Our method falls into the category of fixed-size microaggregation heuristics. Therefore, to study the information loss parameter we have varied the value of k in the range [3, 4, 5, 10], we compared the results with those obtained with the MDAV and V-MDAV methods, for the same values of k. After microaggregating the data sets, we have analyzed the information loss introduced by each method. From table IX, we can see that the results obtained by MDAV and V-MDAV are very similar, but our method has a greater information loss for any value of k, the error introduced grows proportionally to k. After analyzing these results, we can conclude that our method get good results for k = 3. TABLE IX: Experimental results. Information loss caused by MDAV,V-MDAV and our method Dataset. Method. k=3. k=4. k=5. k = 10. Census. MDAV V-MDAV MF-TSP. 5,66 5,69 6,00. 7,51 7,52 9,24. 9,01 8,98 11,6. 14,07 14,07 25,49. R EFERENCES [1]. [2]. [3]. [4] [5]. [6]. [7]. [8]. [9]. [10]. IV. C ONCLUSION AND FURTHER WORK MF-TSP, a new heuristic method for multivariate microaggregation has been proposed in this article. MF-TSP is a fixed group size method, the level of privacy required is controlled by a parameter k (minimum group size). Once k has been chosen, the data protector is interested in minimizing information loss, in our case that happens whit k = 3. A number of research issues remain open and will be addressed in future work, • Modify the neighborhood search method based on a window [2k − 1] to a new method. • Modify the algorithm to a variable-size microaggregation method. • Study groups formed comparing the result with MDAV.. [11]. [12]. C LIMER , S., AND Z HANG , W. Rearrangement clustering: Pitfalls, remedies, and applications. J. Mach. Learn. Res. 7 (Dec. 2006), 919– 943. D OMINGO -F ERRER , J., M ARTINEZ -BALLEST É , A., M ATEO -S ANZ , J., AND S EB É , F. Efficient multivariate data-oriented microaggregation. The VLDB Journal 15 (2006), 355–369. D OMINGO -F ERRER , J., S EB É , F., AND S OLANAS , A. A polynomialtime approximation to optimal multivariate microaggregation. Computers and Mathematics with Applications 55, 4 (2008), 714 – 732. FOR NATIONAL S TATISTICS , O. Statistical disclosure control for 2011 census. H AHSLER , M., AND H ORNIK , K. Tsp - infrastructure for the traveling salesperson problem. Journal of Statistical Software 23, 2 (12 2007), 1–21. H ERRANZ , J., M ATWIN , S., N IN , J., AND T ORRA , V. Classifying data from protected statistical datasets. Computers and Security 29, 8 (2010), 875 – 890. J OHNSON , O., AND L IU , J. A traveling salesman approach for predicting protein functions. Source Code for Biology and Medicine 1 (2006). cited By 12. L IAO , Y.-F., YAU , D.-H., AND C HEN , C.-L. Evolutionary algorithm to traveling salesman problems. Computers and Mathematics with Applications 64, 5 (2012), 788 – 797. Advanced Technologies in Computer, Consumer and Control. M ARTINEZ , S., S ANCHEZ , D., AND VALLS , A. Semantic adaptive microaggregation of categorical microdata. Computers and Security 31 (2012), 653–672. M ATEO -S ANZ , J., AND D OMINGO -F ERRER , J. A comparative study of microaggregation methods. QÜESTIIÓ 22, 3 (1998), 511–526. S OLANAS , A., G ONZALEZ -N ICOLAS , U., AND M ARTINEZ BALLEST É , A. A variable-mdav-based partitioning strategy to continuous multivariate microaggregation with genetic algorithms. In Neural Networks (IJCNN), The 2010 International Joint Conference on (2010). S OLANAS , A., AND M ARTINEZ -BALLEST É , A. Vmdav: A multivariate microaggregation with variable group size. 17th COMPSTAT Symposium of the IASC, Rome (2006), 917–925..
(8)
Figure

+3

Documento similar
In this way, a powerful method following that methodology and being based on circuit theory, is the so-called Network Simulation Method (NSM), a numerical approach applied to
In this paper we have proposed a novel method for isosurface extraction from a discrete data field, which can be advan- tageously used for interface reconstruction in volume of
Namely, in this paper, we present HIGEA, a mobile-cloud-based system based on a conversational agent that naturally embeds caregiver burden assessment test questions into
In this paper we have considered the problem of forecasting the global horizontal irradiance in very short time using a particular dataset obtained from the Plataforma
Abstract: In this paper, we analyse consumer acceptance, preferences and attitudes to camel milk based on a cross-country study based on qualitative focus groups with
In this paper, we show how these invariant manifolds can be calculated, and used in a formally exact reaction rate calculation based on perturbation theory for any
In this paper we have shown that the storage capacity of a binary attractor neural network can be increased by using a learning procedure based on the bump formations
In this paper, a new feature selection approach is proposed based on a modified Teaching- Learning-based Optimization (TLBO) combined with four new binarization methods: the
