The origin of the atomic and molecular gas contents of early type galaxies II Misaligned gas accretion
18
0
0
Texto completo
(2) 2. Claudia del P. Lagos et al.. ≈ 42 per cent of ETGs have ionised gas misaligned with the stellar kinematics (i.e. the angle between the angular momenta of the stars and the gas is > 30 degrees). The way the angle between the different galaxy components is measured in the observations is using high signal-to-noise (S/N > 40 ; Emsellem et al. 2004) integral field spectroscopy and millimeter wave interferometry, from which one can construct two-dimensional kinematic maps. Davis et al. (2011) calculated position angles from the 2D kinematic maps of the stellar and gas components in a way that they trace the bulk of the components rather than substructures. From the position angles, the projected misalignments, rather than the threedimensional misalignments, were measured. Typical uncertainties in the measured position angles in ATLAS3D are of 10 degrees. Davis et al. (2011) also show that the molecular and ionised gas components are aligned with each other, suggesting a common origin. The high fraction of stellar/gas misalignments reported by Davis et al. (2011) led to speculation that the origin of this gas is external, pointing to minor mergers as the dominant source of the gas in ETGs that show misaligned gas disks (e.g. Davis et al. 2011; Serra et al. 2012). This intriguing inference has been explored in simulations of galaxy formation very recently, with small samples of simulated galaxies. For example, Serra et al. (2014) show that although simulations can reproduce the nature of slow and fast rotators of the early-type population (see also Naab et al. 2013), the HI contents predicted by these simulations are too low, while also being almost always kinematically aligned with the stellar component. The main disadvantage of the work of Serra et al. is that only 50 simulated galaxies were analysed and therefore strong conclusions regarding the consistency of the simulations with observations cannot be reached. An important caveat in the interpretation presented by Davis et al. (2011) and Serra et al. (2012), in which only minor galaxy mergers account for the misaligned gas disks observed in ETGs, is that it ignores the stochastic nature of matter accretion from sources (other than mergers) predicted in a Λ cold dark matter (CDM) universe (e.g. Dekel et al. 2009; Johansson et al. 2012). It implies that gas accretion from sources other than galaxy mergers, such as cooling from the hot halo and collimated inflows of gas from filaments, is always aligned with the stellar component. Sales et al. (2012), Sharma et al. (2012), Bett & Frenk (2012), Aumer et al. (2013) and Padilla et al. (2014) show strong evidence from simulations that in a ΛCDM universe the angular momentum of galaxies is not necessarily aligned with that of their host haloes, as accretion from either the cosmic web or mergers can be stochastic. Bett & Frenk (2012) go a step further and show that the inner parts of haloes, where galaxies live, can suffer much more frequent flips of their angular momentum vector than the halo as a whole (see also Sharma et al. 2012). Bett et al. (2010) show that the median angle between the inner (. 0.25 Rvir ) and total (6 Rvir ) angular momentum vectors is ≈ 25 degrees. Bett et al. also show that the inclusion of baryons drives even larger misalignments, with half of the galaxies having their spin axis misaligned by more than 45 degrees from the host halo spin (see also Bryan et al. 2013 and Tenneti et al. 2014). There is also evidence from hydro-dynamical simulations that the angular momentum of galaxies is affected by the large scale structure; i.e. filamentary structure can fuel gas into galaxies changing its angular momentum direction (e.g. Danovich et al. 2014; Dubois et al. 2014). The result of such accretion process can be alignment with respect to large structures, outside haloes, particularly in the low mass regime (Dubois et al. 2014).. Our motivation is therefore to investigate the alignments between the galaxy components, stars and cold gas (atomic and molecular gas), and the dark matter halo by following the flips in the angular momentum of ETGs throughout their growth history. By flips we mean any change in the direction of the angular momentum vector. This allows us to statistically assess the probability of having a present day ETG with a gas disk that is misaligned with respect to the stellar component. For consistency with the measured projected misalignment angle between different galaxy components in the observations, we show throughout the paper predictions of projected misalignments. The study of angular momentum in galaxies is particularly relevant as ongoing and future surveys, such as Mapping Nearby Galaxies at APO (MaNGA1 ), Calar Alto Legacy Integral Field spectroscopy Area survey (CALIFA2 ), the Sydney-Australian-Astronomical-Observatory Multiobject Integral-Field Spectrograph (SAMI3 ), and ultimately the Square Kilometer Array (SKA4 ), promise to transform our understanding of angular momentum in galaxies in their different components. An example of this is the mass-spin-morphology relation presented by Obreschkow & Glazebrook (2014). For this study we use the semi-analytical model GALFORM in a ΛCDM cosmology (Cole et al. 2000) presented by Lacey et al. (2014, in prep.). This model includes the improved treatment of star formation (SF) implemented by Lagos et al. (2011b,a). This extension explicitly splits the hydrogen content of the ISM of galaxies into HI and H2 . In Paper I we show that the Lacey et al. model provides a very good representation of the gas contents of ETGs (in the form of HI and H2 ) in the local Universe, particularly when gradual ram pressure stripping of the hot gas is included (see Lagos et al. 2014a for predictions of the gas content of galaxies in the Lacey et al. model at high-redshifts). This paper is organised as follows. In §2 we summarise the main aspects of the GALFORM model and the flavour presented by Lacey et al. (2014). In §3 we summarise the method for following the flips in the angular momenta of the different component of galaxies (stars, cold gas and dark matter halo), originally introduced by Padilla et al. (2014). In §4, we present the growth history of ETGs and analyse the transient nature of galaxy morphologies. In §5, we describe how we calculate the angular momentum flips throughout the history of ETGs and present the expectation for the number of misaligned gas disks and compare with observations. We also introduce a new scenario that can lead to gas disks becoming misaligned in addition to galaxy mergers. In §6 we discuss limitations of the model presented here, also showing predictions for late-type galaxies, and give our conclusions in §7.. 2 MODELLING THE MORPHOLOGICAL EVOLUTION, NEUTRAL GAS CONTENT AND STAR FORMATION IN GALAXIES In paper I, we provided a detailed description of all the relevant physical mechanisms which affect the history of ETGs, such as disk formation, bulge formation, ram pressure stripping of the hot gas, star formation and recycling of mass and metals in stars. Here we outline the processes that are modelled in GALFORM and give a brief overview of the model we adopt as a standard in this paper to 1 2 3 4. https://www.sdss3.org/future/manga.php http://califa.caha.es/ (Husemann et al. 2013). http://sami-survey.org/ (Croom et al. 2012). https://www.skatelescope.org/.
(3) II. Misaligned gas accretion study the alignment between cold gas and stars in galaxies, which is a variant of the model of Lacey et al. (2014). GALFORM accounts for the main physical processes that shape the formation and evolution of galaxies. These are: (i) the collapse and merging of dark matter (DM) haloes, (ii) the shock-heating and radiative cooling of gas inside DM haloes, leading to the formation of galactic disks, (iii) star formation in galaxy disks (quiescent mode), (iv) feedback from supernovae (SNe), from heating by active galactic nuclei (AGN) and from photo-ionization of the intergalactic medium (IGM), (v) chemical enrichment of stars and gas, (vi) galaxy mergers driven by dynamical friction within common DM haloes which can trigger bursts of star formation, and lead to the formation of spheroids, (vii) global disk instabilities, which also lead to the formation of spheroids, and (viii) gradual ram pressure stripping of the hot gas. Galaxy luminosities are computed from the predicted star formation and chemical enrichment histories using a stellar population synthesis model (see Gonzalez-Perez et al. 2014). Note that in the literature ‘quiescent’ is generally used to refer to passive galaxies and/or to those with low star formation rates (SFRs) compared to the median at a given stellar mass, but here we use it to distinguish star formation taking place in the disk of galaxies from the starburst mode, which takes place exclusively in the central spheroid of the galaxy and at efficiencies that are generally higher. Here we focus on the variant of GALFORM presented in Lacey et al. (2014; hereafter Lacey14) which includes all the processes listed above. One important feature of the Lacey14 model is that it adopts a non-universal stellar initial mass function (IMF). The IMF describing SF in disks (i.e. the quiescent mode) is the Kennicutt (1983) IMF5 , while a more top-heavy IMF is adopted in starbursts (i.e. with an IMF slope x = 1). This is inspired by Baugh et al. (2005), who used a top-heavy IMF to reconcile the model predictions with observations of the number counts and redshift distribution of submillimeter galaxies. We note, however, that Baugh et al. adopted a more top-heavy IMF for starbursts, with x = 0, than is used for Lacey14. We now give some details of each of the processes above as included in Lacey14: • In Lacey14 the halo merger trees are extracted from the WMAP7 (Komatsu et al. 2011) version of the Millennium cosmological N -body simulation (Springel et al. 2005) (refer to as MSW7 simulation). The cosmological parameters are Ωm = ΩDM + Ωbaryons = 0.272 (with a baryon fraction of 0.167), ΩΛ = 0.728, σ8 = 0.81 and h = 0.704. • Gas cooling is calculated assuming that gas in haloes follows a β profile (Cavaliere & Fusco-Femiano 1976). The amount of cooling then depends on the gas density and its metallicity following the tabulated cooling function of Sutherland & Dopita (1993). The amount of gas that is added to the disk depends on the cooling time and the free-fall time (see Cole et al. 2000 and Benson & Bower 2010). Given the time elapsed since the formation of the DM halo (i.e. the last mass doubling), the free-fall radius, rff , is the maximum radius in the hot halo from which material could have moved to the disk; the cooling radius, rcool , encloses the radius within which gas has had time to cool. The mass accreted onto. 5. The distribution of the masses of stars produced follows dN (m)/d ln m ∝ m−x , where N is the number of stars of mass m formed, and x is the IMF slope. For a Kennicutt (1983) IMF, x = 1.5 for masses in the range 1 M⊙ 6 m 6 100 M⊙ and x = 0.4 for m < 1 M⊙ .. 3. the disk simply corresponds to the hot gas mass enclosed within r = min[rcool , rff ]. • Lacey14 adopts two different SF laws, one for quiescent SF (i.e. taking place in the disk) and another for starbursts (driven by galaxy mergers and disk instabilities). In the case of quiescent SF, Lacey14 adopts the SF law introduced by Blitz & Rosolowsky (2006), where stars form from the molecular gas in the disk, and the partition of atomic and molecular gas depends on the hydrostatic pressure in the midplane of the disk (see Lagos et al. 2011b for details). For starbursts, the SFR is calculated from the available cold gas mass (HI plus H2 ), regulated by a SF timescale, τSF , which depends on the dynamical timescale of the bulge, τdyn , τSF = max(τmin , fdyn τdyn ). The proportionality fdyn = 20 is a free parameter, and τmin is a minimum starburst duration, which is set to τmin = 100 Myr. • The mass entrainment of supernovae driven winds, β, in GALFORM is parametrised by the circular velocity of the galaxy, taken to be a proxy for the gravitational potential well. In Lacey14, β = (Vcirc /320km s−1 )−3.2 . Detailed calculations of SNe feedback suggest the power-law index of this parametrisation should be in the range −1 to −2.7 (Murray et al. 2005; Creasey et al. 2013; Lagos et al. 2013). The power-law index of −3.2 in Lacey14 comes from the Monte-Carlo exploration of parameters originally done in Bower et al. (2006), which pointed to that value as the best parameter to recover a flat faint-end in the K-band luminosity function. However, since this value is in tension with the more recent studies above, we are currently exploring the effect of including more physical parametrisations (Mitchell et al. 2014; Mitchell et al. in prep.). However, we expect the effect of these new parametrisations on the conclusions presented in this paper to be secondary. This is because the selected model ETGs for the study here are relatively massive LK > 6 × 10⁹ M⊙ , and more affected by AGN feedback (see Paper I for details). • In GALFORM AGN feedback is assumed to act in haloes where the cooling time is longer than the free fall time at the cooling radius (‘hot accretion’ mode; Fanidakis et al. 2012). In such a halo, the AGN power is computed and if it is greater than the cooling luminosity, the cooling flow is switched off (see Bower et al. 2006). • For photoionisation feedback, it is assumed that no gas is allowed to cool in haloes with a circular velocity below Vcrit at redshifts below zreion (Benson et al. 2002). Taking into account simulations by Okamoto et al. (2008) and observational constraints on the reionisation redshift (Komatsu et al. 2011), Lacey14 adopt Vcrit = 30 km s−1 and zreion = 10. • For chemical enrichment, we adopt the instantaneous mixing approximation for metals in the ISM, and change the amount of metals recycled depending on the IMF adopted. The stellar evolution models of Marigo (2001) and Portinari et al. (1998) are adopted to calculate the ejected mass and metals from intermediate and massive stars, respectively. • Lacey14 adopt the updated dynamical friction timescale of Jiang et al. (2008) to estimate the timescale for the orbital decay of satellite galaxies towards the centre. This decay is due to energy and angular momentum losses driven by dynamical friction with the DM halo material. Once the galaxy merger takes place, a starburst takes place in the centre, where the SFR is taken to be proportional to the amount of cold gas (HI plus H2 ) in the system, regulated by a SF timescale. This SF timescale is calculated as described above. Note that the Jiang et al. (2008) formula is an update of the widely used Lacey & Cole (1993) dynamical friction timescale, using recent N -body simulations. • Global disk instabilities in galaxies occur if the disk becomes.
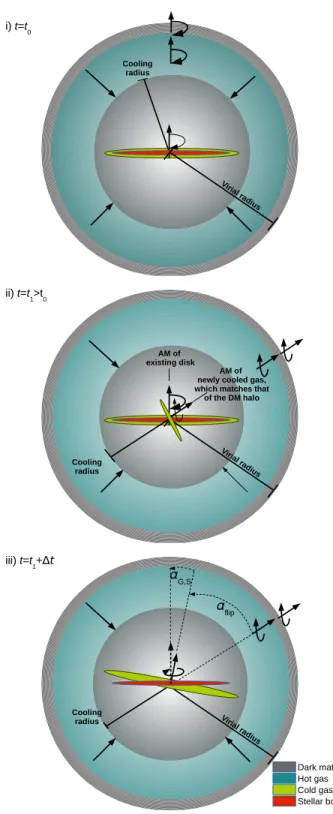
(4) 4. Claudia del P. Lagos et al.. sufficiently massive that its self-gravity is dominant over the pressure produced by rotation. In this case, the disk becomes unstable to small perturbations caused by minor satellites or DM substructures. The criterion for instability was described by Efstathiou et al. (1982), Mo et al. (1998) and Cole et al. (2000). SF in the case of instabilities proceeds as in starbursts driven by galaxy mergers. It is important to remark here that the way disk instabilities are treated in GALFORM are a simplification of what detailed simulations show. For example Ceverino et al. (2010), Bournaud et al. (2011) and Bournaud et al. (2014) show that when disks are globally unstable, large clumps of gas are formed that can be long lived due to the large accretion rates that counteract the mass loss due to outflows and stripping. These long live clumps can migrate to the central parts of the galaxy and build a large bulge in less than 1 Gyr. This is captured in our simplified model through the triggering of a starburst in the central bulge of galaxies. However, contrary to our assumption here, simulations show that the disk is not fully destroyed in the process of disk instability. We plan to investigate the effect this has on the history of ETGs in a future paper. • The standard treatment of the hot gas in the subhaloes around satellite galaxies is usually referred to as ‘strangulation’ of the hot gas, which means that once a galaxy becomes a satellite (when it crosses the virial radius of the larger halo), its hot gas is removed instantaneously and is transferred to the hot gas reservoir of the main halo. This is the model adopted in the default Lacey14 model. However, in Paper I we show that this treatment is too extreme and leads to ETGs having too low HI and H2 gas fractions compared to observations. In Paper I we argue that gradual ram pressure stripping of the hot gas is needed in order to bring gas fractions into agreement with observations. The latter is calculated by considering the ram pressure of the hot gas in the main halo acting against the hot gas of the satellite galaxy as it moves through the halo, and the gravity of the satellite retaining part of the hot halo (see McCarthy et al. 2008; Font et al. 2008). The Lacey14 model including this scheme of gradual ram pressure stripping of the hot gas is referred to as Lacey14+GRP. The latter is our standard model for the rest of the paper, which we show in Paper I to provide HI and H2 gas fractions and mass functions in very good agreement with the observations of the ATLAS3D and HIPASS surveys. Note that we do not include ram-pressure stripping of the cold gas disk of galaxies. Although this process has been shown to be important in cluster environments (e.g. Cortese et al. 2011; Boselli et al. 2014), most ETGs in the model and in ATLAS3D reside in environments other than galaxy clusters, and therefore we do not expect this process to change the conclusions we present in this paper (see paper I for more details). • To calculate the circular velocity and size of the galaxy disk in GALFORM it is assumed that there is conservation of angular momentum and centrifugal equilibrium in the process of gas cooling, while for the size of bulges, energy conservation and virial equilibrium are assumed during galaxy mergers or disk instabilities. In addition, the mass distribution in the halo and the lengthscales of the disk and the bulge adjust adiabatically in response to their mutual gravity.. 3 FOLLOWING FLIPS IN THE ANGULAR MOMENTUM OF THE GAS, STARS AND DARK MATTER HALO We use the Monte-Carlo based method developed by Padilla et al. (2014) to follow the flips in the angular momenta of the cold gas (atomic plus molecular) and stars in galaxies, and the DM. Figure 1. Schematic showing the methodology of Padilla et al. (2014) applied to our simulated ETGs. In panel (i) we show a recently formed galaxy, in which all the components have angular momenta that are perfectly aligned. In a later timestep, t1 (panel (ii)), the DM halo and hot gas flip their angular momenta direction due to accretion. This flip can only be propagated to the galaxy by the accretion of cooled gas from the hot halo, which is shown as a condensation of cold gas with a spin aligned with the DM halo. The flip the disk suffers is limited by the mass of accreted cooled gas relative to the mass in the disk. In panel (iii) we show the case where only a small amount of cooled gas is accreted relative to the gas mass that was already in the disk, driving a small flip. The outcome of this processes is a misalignment αflip between the gas disk and the dark matter halo and an angle αG,S between the gas disk and the stellar body..
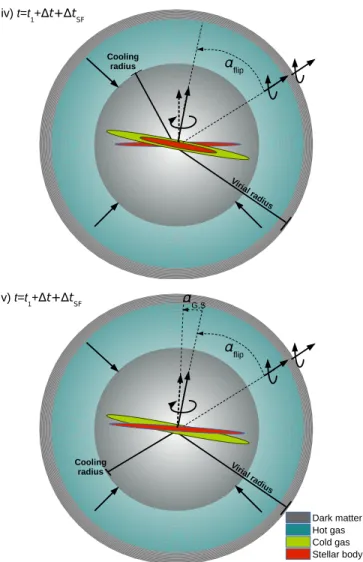
(5) II. Misaligned gas accretion. Figure 2. Continuation of Fig. 1. In panel (iv) we show that the cold gas disk has been flipped due to the recent gas accretion. Stars form in this flipped gas disk in a timescale ∆tSF . The angular momentum of the stellar disk is shown by the dashed arrow. In (v) we show the resulting flip in the stellar disk due to the formation of new stars, which had a different angular momentum direction than that of the older stars. In this example, the newly formed stars represent a lower mass than the older stars, which is not enough to flip the stellar disk back into alignment with the gas disk. Therefore there is a residual angle between the angular momenta of the gas disk and the stars, αG,S .. halo. Padilla et al. based their study on the Millennium-II simulation (Boylan-Kolchin et al. 2009), which has a resolution that is 125 times better than the Millennium simulation described in § 2. This allowed Padilla et al. to accurately calculate the angu~ in all DM haloes and subhaloes with masses lar momentum, J, 10 −1 & 10 h M⊙ , based on at least 1000 particles6 . Thus, the direction of J~ can be accurately traced before and after accretion of matter and merger events. Padilla et al. built a probability distribution function (PDF) for the angle between J~ before and after the accretion, ∆αDM , which depends on the relative change in mass. There are also variations with redshift, due to the expansion of the 6 Note that in Millennium-I a halo of mass 1010 h−1 M is resolved with ⊙ 10 particles only, which makes the measurements of angular momentum very noisy. 5. universe and the relative angular momentum brought by the material as time passes. Thus, we build the PDFs for different redshifts and relative mass changes. In addition, smooth accretion of matter (which is from the cosmic web and it is not resolved in individual haloes) and halo mergers drive different magnitudes of angular momentum flips even though they may cause a similar change in mass, with halo mergers tending to drive higher ∆αDM than accretion onto haloes (see Appendix A for the PDFs produced by Padilla et al.). The strongest assumption Padilla et al. make to apply this methodology to galaxies is that accretion onto galaxies produces flips in the angular momenta, ∆αbar , of the same order as in the haloes (namely, it will depend on the relative change in mass, on the nature of the accretion, i.e. whether it is from smooth accretion or mergers, and on time), ∆αbar (∆Mbar |Mbar , t) ≡ ∆αDM (∆MDM |MDM , t). In other words, Padilla et al. sample the PDFs created from the Millennium-II simulation to find by how much the angular momentum of a galaxy flips due to accretion. This can be done for the different galaxy components. Padilla et al. (2014) implemented the method above in the semi-analytic model SAG (Lagos et al. 2008; Jiménez et al. 2011), modifying the specific angular momentum of galaxies in the model. This also affects the sizes of galaxies and therefore star formation and the strength of feedback. Padilla et al. did not change any model parameters and show the effect of this new physical model on galaxy properties. Ruiz et al. (2013) presented the recalibration of the Padilla et al. (2014) model and the fits to the stellar mass function. Here, we apply the Padilla et al. (2014) model as postprocessing to GALFORM to calculate the flips in the direction of the angular momentum of ETGs due to their growth history, but we do not modify the sizes of galaxies or any other property as a result. For this reason, there is no need for changing any parameter in the model. By post-processing GALFORM using the Padilla et al. Monte-Carlo method, we can accumulate the flips of the angular momentum vector of the gas disk and, based on the assumption that new stars form perfectly aligned with the gas disk at the time they form, we can calculate the angle between the angular momenta of the gas disk and the stellar body at each timestep in the evolution of galaxies. Although these changes are expected in such a model, Padilla et al. (2014) show that the changes are not major except in the fraction of massive galaxies that are ETGs, in a way that the model including the change in the specific angular momentum due to flips in the direction of the angular momentum vector produces a higher fraction of ETGs than the previous model. We therefore do not expect a self-consistent calculation to strongly change the conclusions we present in this paper. We can take the predicted history of each ETG in our simulation (based on the Lacey14+GRP model) and calculate the angle between the gas and stars in galaxies and the DM halo. The history of ETGs is fully characterised by minor and major merger events, disk instabilities, accretion of gas from the halo, outflow gas to the halo by recent star formation (SNe feedback), mass loss from intermediate and low-mass stars to the ISM, and heating of the halo gas due to the energy injected there by the AGN (AGN feedback). All these events will change the gas and stellar contents of ETGs. The way we apply the Padilla et al. methodology to our galaxies is as follows: • In an individual halo, the angular momenta of the hot gas and dark matter are perfectly aligned before the first galaxy forms. • When the first galaxy forms, the gas cools down preserving the.
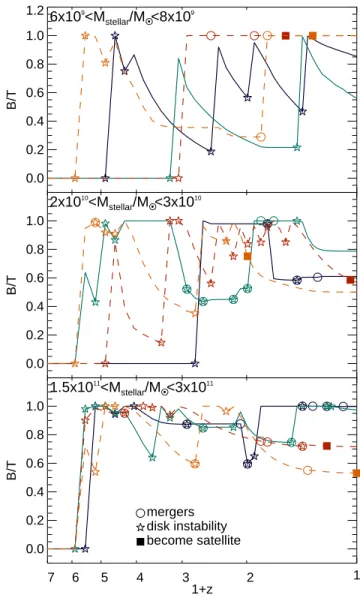
(6) 6. Claudia del P. Lagos et al.. specific angular momentum of the hot gas and its direction, leading to a gas disk that is perfectly aligned with the hot halo (see panel (i) in Fig. 1). Since stars form from this gas disk, they will also be aligned with the gas and hot halo components. • When a DM halo of mass MDM accretes matter, ∆MDM , at a time t, it flips its angular momentum direction by an angle ∆αDM (∆MDM |MDM , t). This change is instantly propagated to the angular momentum of the hot gas (see panel (ii) in Fig. 1). As a result, there will be some level of misalignment between the gas in the disk that cooled from the hot gas before it flipped and the dark matter halo. Note that the instantaneous reaction of the hot halo assumed here is for simplicity. In reality, there is a torque timescale associated with this process, although this should act on a relatively short timescale of the order of the dynamical timescale of the halo. The stars remain fully aligned with the cold gas disk. • When new gas cools down from the flipped hot gas halo, it comes misaligned with the existing gas and stellar disk (see panel (ii) in Fig. 1). The timescale for this gas to cool down and be accreted onto the galaxy disk is calculated as described in § 2 (second bullet point). The cooled gas will change the direction of the angular momentum vector of the cold gas disk towards that of the hot halo (see panel (iii) in Fig. 1). The resulting cold gas disk will form stars, and will also change the direction of the angular momentum vector of the stellar disk towards that of the cold gas disk (as in panel (iv) in Fig. 2). Depending on the cooled mass and the mass of the newly formed stars relative to the existing disk, there will be a remaining angle between the angular momenta of the cold gas and stellar disks (panel (v) in Fig. 2). The resulting flip in the angular momentum direction of the cold gas and stellar components are calculated as a mass-weighted angle. From this it is implicit that the stars will have an angular momentum direction set mainly by the angular momentum direction of stars at the time of the peak of the star formation activity. • When there is a process such as disk instabilities or galaxy mergers that drive the formation of galaxy bulges from a preexisting stellar disk, we assume that the newly formed bulge preserves the direction of the angular momentum the stellar disk had. Any further star formation episode will affect the direction of the angular momentum of the bulge as a result. This means that when we talk about stellar component we mean bulge plus disk, and assume these are always aligned with each other. This is supported by theoretical work that shows how the components slew to each other to align their angular momenta (Binney & May 1986). • During disk instabilities, the cold gas is consumed in a starburst and therefore loses its memory of the flips it had accumulated over time, while stars preserve this memory. In a subsequent gas accretion episode the gas will come with the angular momentum direction of the current hot halo, and may form stars. We calculate the change these newly born stars produce in the angular momentum vector of the stellar body as we explained above (see panel (vi) in Fig. 2). • In the case there is a galaxy merger, we take the PDFs corresponding to the galaxy merger case (see Appendix A), and then we apply the same methodology as above to get the new angle between the angular momenta of the cold gas and stellar body. For the same fractional change in mass, galaxy mergers tend to produce larger flips in the angular momentum direction than results from gas accretion. Since the growth history is recorded for each ETGs at the output times of the simulation, we perform the above calculations at every time step, producing a history for the angle between the an-. gular momenta of the different components of ETGs. An important assumption in this model is that consequent flips in the angular momenta of the galaxy components are not correlated. This means that flips can change the angular momenta in random directions, and are not necessarily correlated with the direction at previous times. We test this assumption in § 6. Note that in this model we do not take into account any relaxation of the gas disk towards the stellar component due to torques. In the case of the dark matter component this is implicitly included, as the distributions of flips was obtained by Padilla et al. (2014) using a N -body simulation, which includes the gravitational interactions. If the gas is faster in its relaxation than the DM components, then the calculation here would represent upper limits for the angle between the gas and the stellar components of ETGs. An important consideration is that this is done for individual galaxies in their sub-haloes. This prevents central galaxies from changing their angular momentum direction due to substructures in the halo. In other words, central galaxies are not affected by changes in the angular momenta of their satellite galaxies (unless they merge). In observations the measured position angle of the gas is measured in ionised and molecular gas, which are aligned, suggesting a common origin (Davis et al. 2011). However, in our model we treat the cold gas, which includes atomic and molecular gas, as a single component, and therefore we do not distinguish possible misalignments between HI and H2 . In observations, HI is not always aligned with H2 , and indeed a 30 per cent of ETGs show unsettle HI morphologies (Serra et al. 2012), while this percentage in the case of H2 is much lower. We simplified the problem by considering the bulk neutral gas and in our model this approximation might not be so critical as the neutral gas that is subject to environmental interactions is the lower density gas which does not contributes so significantly to the total neutral gas mass.. 4 THE HISTORY AND MORPHOLOGICAL DEVELOPMENT OF ETGS Morphology is a transient property of galaxies that is tightly connected to their growth history. This is because it depends on the ability of galaxies to grow galaxy disks after events which lead to spheroid formation, such as disk instabilities or galaxy mergers. Throughout the paper we consider ETGs at z = 0 in the Lacey14+GRP model, which we selected to have LK > 6 × 10⁹ LK , MHI+H2 > 107 , M⊙ and Mbulge /Mtot > 0.5, where LK is the K-band luminosity, MHI+H2 is the mass of HI plus H2 , Mbulge is the stellar mass in the bulge and Mtot is the total stellar mass of the galaxy. These selection criteria are adopted to mimic the selection criteria of ATLAS3D (see Paper I for details). In order to help visualise the transient nature of morphology, we show in Fig. 3 the bulge-to-total stellar mass ratio, B/T , of randomly selected ETGs in different present-day stellar mass bins, separating central galaxies (solid lines) from satellites (dashed lines). The first interesting feature is that massive galaxies tend to have had an early-type morphology (i.e. B/T > 0.5) for a longer period than lower mass galaxies. This is seen in the example cases of Fig. 3, and also applies to the general ETG population. The cause of this difference between massive and lower mass ETGs is that low mass galaxies tend to regrow their disk more efficiently than more massive galaxies. In the case of the most massive galaxies, this is typically due to AGN feedback preventing the formation of a new disk. This was discussed in detail in Paper I. The more efficient regrowth of galaxy disks in the lower mass ETGs is due to the contin-.
(7) II. Misaligned gas accretion 1.2. galaxy merger at z = 1.1). This can happen during minor mergers with very small satellite-to-central galaxy mass ratios. In the case of model satellite galaxies, there can be disk regrowth once they become satellites in the case of gradual ram-pressure stripping (which is implemented in the Lacey14+GRP model we use here). An example of this are the satellite galaxies in the middle panel of Fig. 3, which continue their disk regrowth, compared to a satellite galaxy in the bottom panel, which stops growing its B/T ratio. The satellite galaxies in the middle panel of Fig. 3 show regrow of their disks as a consequence of the gradual ram pressure stripping mechanism included in the Lacey14+GRP model, as opposed to the strangulation scenario that results in no further gas cooling. The satellite galaxy of the bottom panel of Fig. 3 that became a satellite at z ≈ 0.3 does not show any disk regrowth (i.e. its B/T does not significantly change in the time the galaxy has been satellite). The reason for this is that the halo mass of the latter galaxy is higher than those of the satellite galaxies in the middle panel of Fig. 3. This translates into ram pressure stripping being more efficient in the former case. Very different stellar mass assembly histories can lead to galaxies having an early-type morphology, as the example galaxies of Fig. 3 show. The specific history of each ETG is expected to have a strong effect on the alignment of their stellar, gas and dark matter components. In the model of Padilla et al. (2014), every galaxy merger, disk instability and smooth accretion event is considered when following the angular momenta flips. We use the individual gas accretion history of every ETG to estimate their angular momenta alignments in the next section.. 6x10⁹<Mstellar/MO•<8x109. 1.0. B/T. 0.8 0.6 0.4 0.2 0.0. 2x10¹⁰<Mstellar/MO•<3x1010 1.0. B/T. 0.8 0.6 0.4 0.2 0.0. 1.5x10¹¹<Mstellar/MO•<3x1011 1.0 0.8 B/T. 7. 0.6 0.4. 5 THE ORIGIN OF MISALIGNED GAS DISKS IN EARLY-TYPE GALAXIES. mergers disk instability become satellite. 0.2 0.0 7. 6. 5. 4. 3. 1+z. 2. 1. Figure 3. Bulge-to-total stellar mass ratio as a function of redshift for 4 randomly selected galaxies with present-day stellar masses in three different ranges, as labelled. Solid lines correspond to randomly selected present-day central galaxies, while dashed lines show satellite galaxies. Using symbols we show where each galaxy undergoes a galaxy merger (circles), disk instability (stars) and when it becomes satellite (filled square).. uous accretion of newly cooled gas. The reason why gas accretion continues even at later times (see, for example, the central galaxy in the top panel of Fig. 3 that has a B/T = 0.56 at z = 0) is that these ETGs are hosted by lower mass haloes (Mhalo . 5 × 10¹¹ M⊙ ) and have no AGN to heat cooling flows. Central galaxies in the middle and bottom panels of Fig. 3 are hosted by higher mass haloes, Mhalo & 1012 M⊙ . We also show in Fig. 3 the times when galaxies underwent galaxy mergers and disk instabilities, and in the case of satellite galaxies, we show when they were accreted onto their current halo. Note that every time a galaxy in the model displays a rapid growth in its B/T ratio, this is due to a galaxy merger or disk instability, as can be seen in the example galaxies in Fig. 3. Also note that not all galaxy mergers lead to higher B/T , but in some cases there is an associated growth of the disk (see for example one of the central galaxies in the bottom panel of Fig. 3 that had a. In this section we discuss the expected frequency of ETGs that have gas disks misaligned with their stellar component in the Lacey14+GRP model. We compare extensively with the observations of the ATLAS3D , which are discussed in detail in Davis et al. (2011). We find that the percentage of misaligned gas disks and stellar components in the ETGs of ATLAS3D is ≈ 42±6 per cent7 .. 5.1 Lower limits on the number of misaligned gas disks in ETGs In order to show how much misalignment is expected from mergers alone we post-process the ETGs selected from the Lacey14+GRP model using the Padilla et al. (2014) scheme, but we do not apply any misalignment due to gas accretion from the hot halo. The results of this exercise are shown in Fig. 4. If we only allow mergers to drive misalignments, the model fails to reproduce the observed tail of ETGs that have angles between the angular momenta of the stars and the cold disk, αG,S > 30 degrees. We find 2 per cent of ETGs with αG,S > 30 degrees. This percentage increases to 5 per cent in the case we adopt the Lacey & Cole 1993 dynamical friction timescale. This indicates that other sources of misaligned gas are important if the model is to agree with the observations. The fractions calculated above represent lower limits as it is assumed that gas accretion onto galaxies from processes other than galaxy mergers come in perfectly aligned with the stellar body. In. 7. The error in this percentage correspond to a Poisson error..
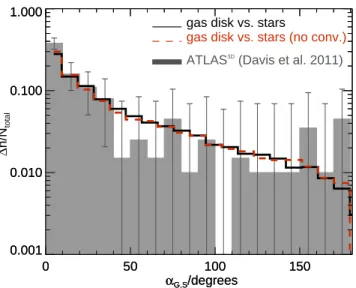
(8) 8. Claudia del P. Lagos et al. 1.000. gas disk vs. stars gas disk vs. stars (no conv.). 1.000. gas disk vs. stars gas disk vs. stars (no conv.). ATLAS3D (Davis et al. 2011). ∆n/Ntotal. 0.100. ∆n/Ntotal. 0.100. 0.010. 0.001 0. ATLAS3D (Davis et al. 2011). 0.010. 50. 100 αG,S /degrees. 150. Figure 4. Distribution of angles between the angular momenta of the gas disk and the stellar component, αG,S (dashed line), for ETGs with LK > 6 × 10⁹ , L⊙ and MHI + MH2 > 107 M⊙ in the Lacey14+GRP model, under the test case that the only source of misaligned gas is galaxy mergers. Observational measurements from ATLAS3D are shown by the shaded histogram. Errorbars are Poisson errors. The y-axis is normalised to represent fractions (number of galaxies in the bin divided by the total number in the sample). We convolve the predicted distribution of angles with a normalised Gaussian distribution with its centre at zero degrees and a standard deviation of 15 degrees (solid line), which corresponds to the expected scatter in the observations reported by Davis et al. (2011).. 0.001 0. 50. 100 αG,S/degrees. 150. Figure 5. Distribution of angles between the angular momenta of the gas disk and the stellar component, αG,S (dashed line), and after the convolution with a Gaussian of width 15 degrees (solid line), for ETGs with LK > 6 × 10⁹ , L⊙ and MHI + MH2 > 107 M⊙ in the Lacey14+GRP model. Here we fully apply the Padilla et al. (2014) Monte-Carlo method. The y-axis is normalised to represent fractions (number of galaxies in the bin divided by the total number in the sample). Observational measurements are as in Fig. 4.. 5.2 The distribution of misaligned gas disks in ETGs due to the history of angular momenta flips. Paper I, we show that the vast majority of recent galaxy mergers (i.e. those that took place in the last 1Gyr) correspond to minor mergers that drive starbursts only in 10 per cent of cases. The remaining 90 per cent correspond to the accretion of small galaxies onto the larger ETGs. Of all ETGs with cold gas masses MHI+H2 > 107 M⊙ , the percentage that have their current cold gas content supplied mainly by galaxy mergers ranges from 11 per cent to 25 per cent. The main driver of the variation in this percentage is the adopted dynamical friction timescale. Adopting the Jiang et al. (2008) dynamical friction timescale, as in Lacey14, leads to earlier minor mergers and consequently a lower merger rate at z = 0, leading to the 11 per cent figure referred to above. On the other hand, adopting the Lacey & Cole (1993) dynamical friction timescale, as in the models of Lagos et al. (2012) and Gonzalez-Perez et al. (2014), leads to a higher rate of minor mergers at z = 0, corresponding to the 25 per cent value referred to above. However, these mergers do not necessarily cause a notable change in the angular momentum of the stellar and/or cold gas bodies. In fact the calculation of Padilla et al. (2014) shows that galaxy mergers produce larger angular momentum flips than other forms of accretion but the angle between the angular momentum of the haloes before and after the merger is likely to be small (see Appendix A). This angle also depends on the mass ratio between the two galaxies. This is the reason why a relatively high fraction of ETGs have their current gas content supplied mainly by galaxy mergers, but do not show significant misalignments.. We now apply the full scheme introduced by Padilla et al. (2014) to GALFORM galaxies as a more complete calculation than that in § 5.1. We remind the reader that we take the mass growth history of ETGs from the Lacey14+GRP model and post-process it to follow the flips of the angular momenta. The full calculation of Padilla et al. (2014) includes changes in the direction of the angular momenta of galaxy components due to both galaxy mergers and the accretion of cooled gas from the hot halo. Fig. 5 shows the predicted distribution function of the angle between the cold gas (HI+H2 ) and the stellar component of ETGs, αG,S . We also show these distributions after convolving with a Gaussian distribution with its centre at zero degrees and a standard deviation of 15 degrees, which corresponds to the expected scatter in the observations of (Davis et al. 2011). Observations of the ATLAS3D reported by Davis et al. (2011) are shown by the solid histogram with the error bars corresponding to Poission errors. The application of the angular momentum flips model described in § 3 leads to 46 per cent of ETGs having αG,S > 30 degrees and a distribution of αG,S that agrees with the observed distribution of ETGs within the error bars (in § 6 we quantify the agreement between the model predictions and observations using the Kolmogorov-Smirnov test). This is interpreted as misalignment arising not only from recent mergers, as was assumed in § 5.1, but also from the accretion history of ETGs, which can slew the angular momentum of the stellar component over time with respect to the DM halo and also the gas. We find that the angle αG,S of each galaxy is strongly affected by recent accretion onto the galaxy compared to the time when the.
(9) II. Misaligned gas accretion. -5.0 -4.8 -4.6 -4.4 -4.1 -3.9 -3.7 -3.5 -3.3 -3.1 -2.8 -2.6 -2.4. log(dn dz-1 dangle-1 / Mpc-3 h3 ∆z-1 degree-1). 4.5. (1+z) to last gas accretion. 4.0 3.5 3.0 2.5 2.0 1.5 1.0 0. 50. 100 αG,S/degrees. 150. -4.9 -4.7 -4.5 -4.3 -4.1 -3.9 -3.7 -3.4 -3.2 -3.0 -2.8 -2.6 -2.4. 15. log(dn/dlog(Mhalo)/dangle/ Mpc-3 h3). log10(Mhalo/MO•). 14. 13. 12. 11. 0. 50. 100 αG,S/degrees. 150. Figure 6. Top panel: The redshift to the last time each ETG had a gas accretion episode (either due to gas cooling from the hot halo or galaxy mergers), zLG , as a function αG,S in the Lacey14+GRP model. Here we include the same model galaxies as Fig. 5. The coloured contours show number density per unit redshift and angle, with the scale shown by the key (here dz and dangle are the bins in redshift and angle, respectively). The solid line shows the median αG,S for bins in zLG , while the dashed line shows the median zLG for bins in αG,S . Bottom panel: As in the top panel but here we show the sub-halo mass where the ETG resides. Here dlog(Mhalo ) and dangle are the bins in halo mass and angle, respectively.. galaxy assembled its stellar mass8 . We find that if galaxies assembled 80 per cent of their stellar mass before the last episode of cold gas accretion (either from gas cooling from the hot halo or galaxy mergers), they are more likely to show misalignments between the 8. We define this as the time the galaxy had assembled 80 per cent of its z = 0 stellar mass.. 9. angular momenta of the cold gas and the stellar component. Indeed, we find that ETGs that have αG,S > 30 degrees at z = 0 assembled 80 per cent of their stellar mass by z ≈ 0.6, while their last important gas accretion episode took place later at z ≈ 0.3, on average. On the other hand, in the sample of ETGs with αG,S < 30 degrees at z = 0, we find that 80 per cent of their stellar mass was assembled by z ≈ 0.7, while their last important gas accretion episode took place at around the same time, on average. This happens because the new gas accretion episodes do not contribute strongly to the stellar mass, and so they hardly change the direction of the angular momentum of stars, while the cold gas can be greatly affected if the change in cold gas mass is important. This result is shown in the top panel of Fig. 6, where we show the redshift of the last cold gas accretion episode of ETGs (either due to gas cooling from the hot halo or a galaxy merger), zLG , as a function of αG,S . This cold gas accretion episode can have any mass, but it is on average quite significant; the median cold mass accreted in this last accretion episode is 3 × 10⁹ M⊙ for ETGs with Mstellar = 1010 M⊙ and 7 × 10⁸ M⊙ for ETGs with Mstellar = 1011 M⊙ . We also show the median αG,S for bins in zLG and vice-versa to show the dominant trends. Recent accretion can lead either to aligned or misaligned cold gas/stellar components, which can be seen from the higher density of galaxies at low zLG regardless of the value of αG,S . All ETGs with earlier last cold gas accretion episodes have more aligned stellar and gas components. This is clear from the median αG,S ≈ 10 degrees of galaxies that have zLG > 3. Similarly, the median value of zLG ≈ 1 for galaxies with αG,S ∼ 0 is higher than for galaxies with higher values of αG,S . Note that the median αG,S increases for decreasing zLG . Another important property that is strongly correlated with the formation time and accretion history of galaxies, and therefore with αG,S , is the mass of the sub-halo that hosts an ETG. The bottom panel of Fig. 6 shows that misalignment happens in our model only in intermediate ranges of sub-halo masses, 7 × 10¹⁰ M⊙ < Msubhalo < 1013 M⊙ . The main halo is the largest gravitationally bound structure, which are identify in the N -body simulation using the friends-of-friends algorithm Davis et al. (1985). Halos can contain substructures that are self-gravitating, which are call subhaloes and are identify using sub-finder algorithms (Knebe et al. 2013) (see Jiang et al. 2014 for a recent description on how haloes and sub-haloes are identified and followed in the N -body simulations used by GALFORM). The most massive sub-halo within haloes generally hosts the central galaxy, while lower mass subhaloes contain satellite galaxies. Not all satellites retain information about their sub-halo given that the dark matter halo can get heavily stripped so that is not considered a substructure within the main halo anymore. In these cases the sub-halo mass corresponds to the mass of the sub-halo the last time it was identified in the simulation. In the case of ETGs living in massive sub-haloes, Msubhalo > 1013 M⊙ , most of the gas accretion took place at higher redshifts, where most of the star formation happened. This leads to alignment between the angular momenta of the stars and the gas; for Msubhalo > 1013 M⊙ , the median αG,S ≈ 8 degrees, while for a halo mass of Msubhalo ≈ 3 × 10¹¹ M⊙ the median αG,S ≈ 50 degrees. Similarly, the median halo mass of low αG,S is higher than for higher values of αG,S . Large misalignments, for example αG,S > 90 degrees, are exclusive of ETGs hosted by haloes 7 × 10¹⁰ M⊙ < Msubhalo < 3 × 10¹² M⊙ . In the case of the lowest mass sub-haloes, galaxies have undergone a quieter history, with fewer interactions relative to ETGs hosted by larger mass haloes. This leads the ETG population hosted.
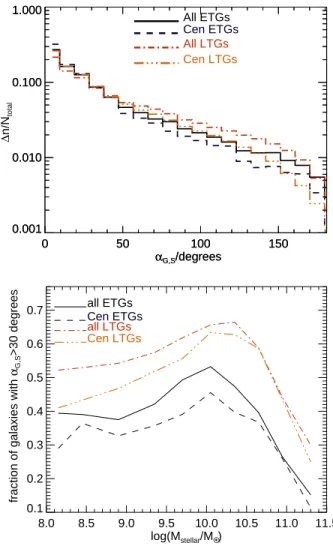
(10) 10. Claudia del P. Lagos et al. in each sub-volume of 3 × 10⁵ Mpc3 . This number is very close to the number 260 of ETGs in the ATLAS3D . These variations are quite large and we find that the observed sample of ETGs would need to be extended up to 100 Mpc to reduce the variance in the fraction of ETGs with αG,S > 30 degrees to a few percent.. 1.000. ∆n/Ntotal. 0.100. 5.2.2 Dependence on galaxy properties. 0.010. 0.001 0. 50. 100 αG,S/degrees. 150. ∆n/Ntotal. 1.00 0.10 0.01 0.35. 0.40 0.45 0.50 fraction of ETGs with αG,S>30 degrees. Figure 7. Top panel: Distribution of αG,S for ETGs with LK > 6 × 10⁹ , L⊙ and MHI + MH2 > 107 M⊙ in the Lacey14+GRP model, and for the realisations of the ATLAS3D volume (3 × 10⁵ Mpc3 ) that give the highest (dashed line), median (solid line) and lowest (dot-dashed line) fraction of ETGs with αG,S > 30 degrees. The observed ATLAS3D distribution is shown by the solid histogram. Bottom panel: Distribution of the fraction of ETGs that have αG,S > 30 degrees in the 30 realisations done of the ATLAS3D volume in the Lacey14+GRP model. The median of the distribution is 46 per cent.. by low mass sub-haloes to having fewer ETGs with αG,S > 30 degrees than is the case of ETGs hosted by higher mass sub-haloes. 5.2.1 Variance from field to field An important question that arises from a sample such as ATLAS3D , which is complete up to a distance of 42 Mpc, is what is the effect of the large scale structure on the statistical analysis we have performed in § 5.2 (i.e. cosmic variance)? In other words, if we were to observe different volumes of 3 × 10⁵ Mpc3 (which corresponds to a cube of side ≈ 68 Mpc), how much variance would we observe in the distribution of αG,S ? In this section we investigate the variance of the distribution of αG,S . We make a random selection of 30 sub-volumes within the MS-W7 simulation, with each having a volume of 3 × 10⁵ Mpc3 . The resulting distribution of this experiment and the fraction of ETGs with αG,S > 30 degrees that result are shown in Fig. 7. We find that the percentage of ETGs that have αG,S > 30 degrees can vary from 35 − 53 per cent, with a median of 46 per cent. This translates into a variance of ≈ 25 per cent in the volume probed by ATLAS3D . This number agrees very well with the variance as a function of probed volume reported by Driver & Robotham (2010). We also find that the number of ETGs selected to have LK > 6×10⁹ L⊙ and a mass of HI plus H2 > 107 M⊙ is on average 300. In this section we focus on the galaxy properties we find are correlated with αG,S and analyse the physical drivers of such correlations. These properties are K-band Luminosity and stellar mass, cold gas fraction, satellite/central dichotomy and the SFR. We find no strong dependence of the distribution of αG,S on other galaxy properties, such as bulge-to-total stellar mass ratio or total neutral gas mass (HI plus H2 ). K-band Luminosity and Stellar mass. We find that K-band luminosity (often used as a proxy for stellar mass) is anti-correlated with the angle between the angular momenta of the cold gas and the stellar component, αG,S . The top-panel of Fig. 8 shows the Kband luminosity as a function of αG,S . Overlaid are observations of individual galaxies from the ATLAS3D survey (Davis et al. 2011). The distribution of αG,S seen in the ATLAS3D observations is very similar to the predictions of the model: there is a higher number density of galaxies at αG,S < 30 degrees, with the density of galaxies decreasing towards αG,S > 30 degrees, but with galaxies covering the full range of αG,S at LK < 2 × 10¹¹ L⊙ . At higher K-band luminosities, the model predicts that ETGs show aligned gas and stellar components, with the largest angles being αG,S ≈ 20 degrees, in agreement with the observations. These galaxies reside in the highest mass haloes, with a median sub-halo mass of Mhalo ≈ 9 × 10¹³ M⊙ (shown in Fig. 6), which explains why the model predicts a correlation between K-band luminosity and αG,S . For instance, ETGs with 6 × 10⁹ L⊙ < LK < 1010 L⊙ , have on average its last cold gas accretion episode at z ≈ 0.3, while 80 per cent of the stellar mass of these ETGs was in place at z ≈ 0.4. In contrast, ETGs with LK > 3 × 10¹¹ L⊙ had the last cold gas accretion episode on average at z ≈ 2.2, while 80 per cent of the stellar mass of these ETGs was in place only by z ≈ 0.29 . The latter is due to AGN feedback acting on the most massive galaxies from early-on. We have repeated this experiment with stellar mass rather than K-band luminosity and find the same trends. In order to quantify the agreement with the observations, we calculate the fraction of ETGs in the model and the observations that have αG,S < 30 degrees in bins of K-band luminosity. The results of this experiment are shown in the bottom panel of Fig. 8. For the observations, we calculate Poisson error bars, which are shown by the hatched region, while for the simulations we calculate an errorbar associated with the variance expected from field-to-field, which we discuss in § 5.2.1. There is good agreement between the observations and the model. Previous calculations by Dubois et al. (2014) point to stellar mass being strongly correlated with the spin of galaxies and hence is a good indicator of whether the angular momentum of the galaxy is aligned with the halo. However, Dubois et al. do not analyse the alignments between the different galaxy components.. 9. Note that the timescale we discuss here for the stellar mass build-up is an assembly age rather than a stellar age. This is because the stellar ages of these galaxies are much higher than the assembly age (see for example Kauffmann 1996 and Baugh et al. 1996)..
(11) II. Misaligned gas accretion. 11. 1.000 log(Mcold/LK)<-3 -3<log(Mcold/LK)<-2.2 log(Mcolor/LK)>-1.5. -4.6 -4.4 -4.3 -4.1 -4.0 -3.8 -3.6 -3.5 -3.3 -3.2 -3.0 -2.9 -2.7 -1. -1. -3. 3. -1. -1. log(dn dlog(LK) dangle / Mpc h dex degree ) ATLAS3D sources. 0.100. log10(LK/LO•). ∆n/Ntotal. 11.5. 11.0. 0.010. 10.5 0.001 0. 50. 100 αG,S/degrees. 150. fraction of ETGs with αG,S>30 degrees. 0. 50. 100 αG,S/degrees. fraction of ETGs with αG,S>30 degrees. 10.0. 150. ATLAS3D sources Model predictions. 1.0. 1.0. 0.1 -4 0.1. 10.0. 10.5 log(LK/LO•). 11.0. 11.5. Figure 8. Top panel: K-band luminosity as a function of the angle between the neutral gas and stellar component, αG,S , for simulated ETGs from the Lacey14+GRP model and observations from the ATLAS3D survey (Davis et al. 2011). The contours show number density per unit K-band luminosity and angle, as indicated by the colour bar. Here dlog(LK ) and dangle are the bins in K-band luminosity and angle, respectively. Bottom panel: The fraction of ETGs that have αG,S > 30 degrees as a function of the K-band luminosity. Observational measurements from the ATLAS3D are shown by the solid line and hatched region, where the latter corresponds to the Poisson error bars. In the model predictions, the error bars correspond to the variations in the fraction due to variance from field-to-field (which we discuss in § 5.2.1).. Gas Fraction. We find that the cold gas fraction, expressed as the ratio between the HI+H2 mass and the K-band luminosity, is correlated with the level of misalignment between the angular momenta of the cold gas disk and the stellar component such that galaxies with low cold gas fractions tend to be more aligned than galaxies that are gas-rich. This is shown in the top panel of Fig. 9.. ATLAS3D sources Model predictions. -3. -2 log(Mcold LK-1 / MO• LO•-1). -1. Figure 9. Top panel: Distribution of αG,S in ETGs with LK > 6 × 10⁹ L⊙ in the Lacey14+GRP model and in different bins of cold gas fraction, MHI+H2 /LK [M⊙ /L⊙ ]. Observational measurements from the ATLAS3D are shown by the shaded histogram. The y-axis is normalised to represent fractions. Bottom panel: As in the bottom panel of Fig. 8, but here we show the fraction of ETGs that have αG,S > 30 degrees as a function of the cold gas fraction.. Galaxies with high cold gas fractions typically have had recent cold gas accretion, which have changed the cold gas content considerably, while their stellar mass has not changed significantly over the same timescale. The effect of this is that the angular momentum of the stellar body is only mildly modified by the newly formed stars, while the angular momentum of the cold gas changes considerably. The gas fraction here is correlated with the recent gas accretion history. We find that this relation holds even when we look at galaxies in a narrow range of stellar masses, pointing to this correlation being independent of stellar mass. Serra et al. (2014) show that there is a trend of galaxies with low HI fractions to show alignments between the stellar and HI components, while misalignments are more likely in ETGs with higher HI gas fractions. This trend agrees qualitatively with our predictions. We quantify this trend by calculating the fraction of.
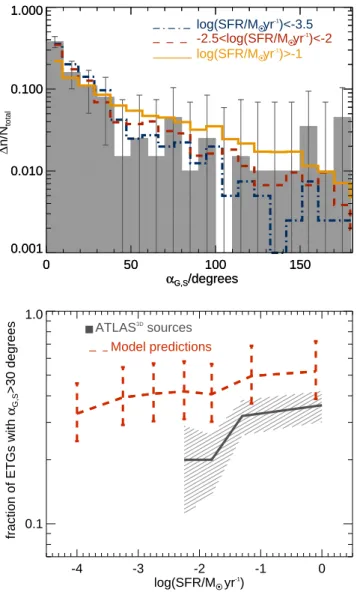
(12) 12. Claudia del P. Lagos et al.. 1.000. 1.000 log(SFR/MO•yr-1)<-3.5 -2.5<log(SFR/MO•yr-1)<-2 log(SFR/MO•yr-1)>-1. centrals satellites. ∆n/Ntotal. 0.100. ∆n/Ntotal. 0.100. 0.001 0. 0.010. 50. 100 αG,S/degrees. 150. Figure 10. As in the top panel of Fig. 9 but for central and satellite galaxies.. ETGs that have αG,S > 30 degrees as a function of cold gas fraction, (HI+H2 )/LK , for ETGs in both simulations and observations. In the case of non-detections of HI and/or CO for ATLAS3D galaxies, we take the value of the upper limit on the HI and/or H2 mass. The results are shown in the bottom panel of Fig. 9, where the error bars are as in the bottom panel of Fig. 8. We find that the correlation predicted by the model between αG,S and cold gas fraction is also observed in the ATLAS3D , which is reassuring. This is evidence that our model contains some of the mechanisms that drive the misalignments observed in ATLAS3D . Satellites vs. Centrals. Fig. 10 shows the histogram of the angle between the angular momenta of the cold gas and stellar components in ETGs, separating central and satellite galaxies. There is a trend for satellite galaxies to show misalignments more often than centrals. Satellite galaxies in the model are quenched by ram pressure stripping of the hot gas and SNe driven winds. The former start operating when the galaxy becomes a satellite. Overall, this results in satellite galaxies having 80 per cent of their stellar mass in place earlier than central galaxies, which exhibit more recent star formation. For satellites, accretion of cold gas onto the galaxy can continue for as long as the satellite retains part of its hot gas halo. However, a lot of this cold gas is too low density to transform into H2 , resulting in low SFRs that do not alter the stellar mass of the galaxy. In the case of central galaxies, both star formation and accretion of cold gas continue for longer which leads to higher levels of alignment between the two components. Unfortunately, we cannot test this prediction with the current available data, but with larger datasets than ATLAS3D we would be able to cross-match with group catalogues and test this idea. Note that the trend of satellite/centrals is not driven by stellar mass. We can see this by fixing the stellar mass and then looking at satellite and central galaxies. As an example, for the stellar mass bin 1010 M⊙ < Mstellar < 3 × 10¹⁰ M⊙ , the fraction of satellite ETGs with αG,S > 30 degrees is 62 per cent, while for centrals this fraction is 45 per cent. However, there is a strong connection between the frequency of misalignments in centrals and satellites and the range of sub-halo masses hosting these two galaxy populations. The median sub-halo mass of satellite ETGs in the model is Msubhalo ≈ 3 × 10¹¹ M⊙ , where the peak of the frequency of mis-. 0.001 0. fraction of ETGs with αG,S>30 degrees. 0.010. 50. 100 αG,S/degrees. 150. 1.0 ATLAS3D sources Model predictions. 0.1. -4. -3. -2 -1 log(SFR/MO• yr-1). 0. Figure 11. As in Fig. 9 but for bins of SFR. In ATLAS3D , there are SFRs available from WISE, and combined with GALEX for galaxies that have detection in the far-UV, for only 56 sources (Davis et al. 2014). This is why the statistics worsen when plotted as a function of the SFR compared to the trends shown in the bottom panel of Fig. 9.. alignments takes place (see bottom panel of Fig. 6). On the other hand, the median sub-halo mass of central ETGs in the model is Msubhalo ≈ 1012 M⊙ . Star formation rate. Fig. 11 shows the distribution of αG,S in three different bins of SFR. We find that in the model, ETGs with low SFRs are associated with a preference for lower values of αG,S compared to those with higher SFRs. This is because higher SFRs in ETGs are associated with important recent cold gas accretion. Note that a similar trend is found between αG,S and the specific SFR (the ratio between the SFR and the stellar mass; SSFR); i.e. galaxies with lower SSFR show lower values of αG,S . At a fixed stellar mass we find that the correlation between αG,S and SFR becomes stronger. This is because stellar mass is positively correlated with SFR but anti-correlated with αG,S . Thus, when plotting all stellar masses the positive correlation between SFR and αG,S becomes weaker. Note however, that the driver of the correlation of.
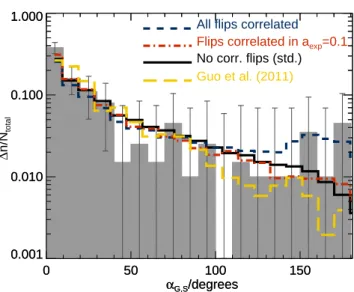
(13) II. Misaligned gas accretion Table 1. The two-sided KS probability, pKS , calculated using galaxies from ATLAS3D and the Lacey14+GRP model under the scenario of no correlated flips over time, all flips correlated over time and flips correlated only over an interval in expansion factor of aexp = 0.1. We also show the value of pKS for the publicly available model of Guo et al. (2011).. 1.000. 13. All flips correlated Flips correlated in aexp=0.1 No corr. flips (std.) Guo et al. (2011). Model. pKS. No flips correlated (Lacey14+GRP) All flips correlated (Lacey14+GRP) Flips correlated over aexp = 0.1 (Lacey14+GRP). 0.16 0.002 0.04. Guo et al. (2011). 0.0001. αG,S with SFR and cold gas fraction is the same and therefore they are not independent. We test the existence of a correlation between αG,S and SFR using ATLAS3D and the measured SFRs presented by Davis et al. (2014). Davis et al. measured SFRs in ETGs using a combination of ultraviolet information from GALEX and infrared photometry from WISE, when far-UV photometry was available, or only WISE data when not far-UV was available. This was possible for a subsample of 56 ETGs. This worsens the statistics, but nevertheless we perform the calculation of the fraction of ETGs with αG,S > 30 degrees as a function of SFR to reveal possible trends. This is shown in the bottom panel of Fig. 11. The model predictions are also shown. The observations suggest a trend that goes in the same direction as the predictions of our model. It would be possible to confirm such a trend if SFRs were available for all ETGs in the ATLAS3D , as is the case of the cold gas fraction.. 6 LIMITATIONS OF THE MODEL AND DISCUSSION An important assumption of the model of Padilla et al. (2014) is that flips in the angular momenta of the galaxy components are uncorrelated over time. This means that an angular momentum flip at a given time, for instance, of the gas disk, has a direction uncorrelated to the direction of previous flips. This is not necessarily the case in reality, as matter can come in from preferred directions, for example from filaments. These filaments bring large specific angular momentum compared to that of the halo, and hence are capable of changing the direction of the galaxy angular momentum towards the preferred direction of filaments (Pichon et al. 2011; Sales et al. 2012; Danovich et al. 2012; Aumer et al. 2013; Danovich et al. 2014). This means that subsequent accretion episodes can come from the same (or similar) directions, which translates into angular momentum flips being correlated in direction over time. The ability of these cold flows to reach the halo centre where galaxies live is under debate. For example, Nelson et al. (2013) suggest that cold streams do not self-shield as efficiently as previously thought, as there is important heating as cold streams travel through the dark matter halo towards the centre. They show that the maximum fraction of gas accreted onto galaxies that did not get shock heated to a temperature close to the virial temperature of the halo is ≈ 0.3 for a present-day halo mass of 5 × 10¹⁰ M⊙ h−1 . This fraction decreases with increasing halo mass. Thus, it is still unclear to what extent angular momentum flips can be correlated in direction over time. Here we test the idea of all flips in angular momentum be-. ∆n/Ntotal. 0.100. 0.010. 0.001 0. 50. 100 αG,S/degrees. 150. Figure 12. Distribution of angles between the angular momenta of the cold gas disk (HI+H2 ) and the stellar body, αG,S , for ETGs with LK > 6 × 10⁹ , L⊙ and MHI + MH2 > 107 M⊙ in the Lacey14+GRP model, when we consider no correlated angular momentum flips over time (standard model; solid line), when all flips are correlated in direction over time (dashed line), and when flips are correlated only during finite time intervals (i.e. during an interval of expansion factor aexp = 0.1; dot-dashed line). We also show the predicted distribution of αG,S from the semi-analytic model of Guo et al. (2011).. ing correlated in direction over time, and compare this assumption with our standard model, which assumes uncorrelated flips. Fig. 12 shows the histogram of αG,S for our standard model and for the model when all flips are correlated in direction over time. The latter model produces a flatter distribution of αG,S , particularly at αG,S > 100 degrees. The fraction of galaxies with αG,S > 30 degrees rises from 46 per cent in our standard model to 52 per cent. In order to quantify which model produces results closer to the observed one we calculate the two-sided Kolmogorov-Smirnov (KS) probability, pKS (calculated using the ATLAS3D results). The values of pKS are shown in Table 1 for the standard model (i.e. uncorrelated flips) and for the realisation that assumes correlated flips over time. From the values in Table 1, one can conclude that observations prefer flips in angular momenta that are not fully correlated over time, i.e. the direction of flips in angular momentum at any time cannot know about all previous flips. Another possibility is that if correlated flips exit, the correlation spans timescales that are shorter than the age of galaxies. In order to test this idea, we perform an experiment where flips are correlated in direction during a finite period of time. We choose to quantify this by the interval in expansion factor where flips are correlated, aexp . We show the result of this experiment for aexp = 0.1 in Fig. 12 and the results of the KS test in Table 1. This model predicts a fraction of galaxies with αG,S > 30 degrees of 48 per cent and from the results of Table 1 one can conclude that the model using uncorrelated flips is still in better agreement with the observations. We also show for reference in Fig. 12 the predictions from a different semi-analytic model, that of Guo et al. (2011). In this model they follow the 3-dimensional angular momenta of the gas and stars in galaxies along similar lines to those presented in § 3. In Guo et al. stars and gas are treated as independent bodies and they.
Figure
+7


![Figure 9. Top panel: Distribution of α G,S in ETGs with L K > 6 × 10 9 L ⊙ in the Lacey14+GRP model and in different bins of cold gas fraction, M HI+H 2 /L K [M ⊙ /L ⊙ ]](https://thumb-us.123doks.com/thumbv2/123dok_es/7300898.447315/11.918.65.423.163.830/figure-panel-distribution-etgs-lacey-model-different-fraction.webp)
Documento similar