A Collection of New Dwarf Galaxies in NGC 5128's Western Halo
8
0
0
Texto completo
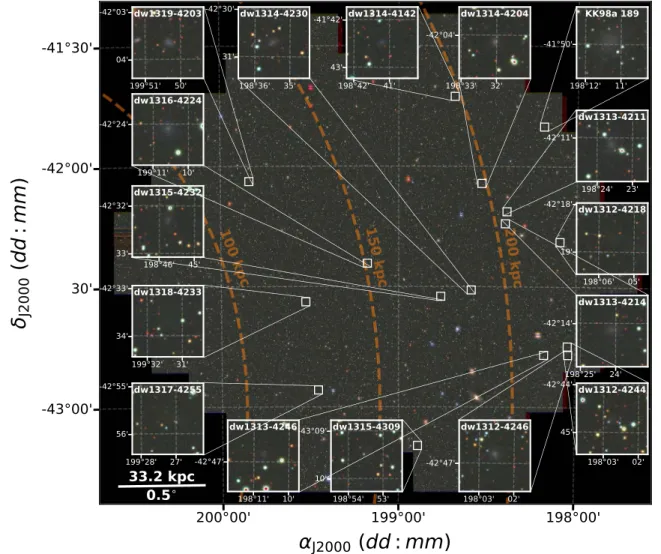
(2) The Astrophysical Journal Letters, 867:L15 (8pp), 2018 November 1. Taylor et al.. campaign (Taylor et al. 2017) that uses the Dark Energy Camera (DECam) mounted on the 4 m Blanco telescope at the Cerro Tololo Interamerican Observatory (CTIO) to image ∼72 deg2of the sky around NGC 5128. Specifically, for each filter we utilize a set of DECam images centered on (α, δ)=(13: 16: 30.83, −42: 21: 41.06). Images were acquired over 2014 April 4–5 with total integration times of 1200, 100, 60, 100, and 200 s targeted to reach a signal-to-noise ratio (S/N)≈five point-source depths of 24.1, 22.7, 22.5, 22.1, and 21.7 in the u′, g′, r′, i′, and z′ filters, respectively. Image preprocessing was carried out by the DECam community pipeline (CP; Valdes et al. 2014) to remove instrumental signatures (bias subtraction, flat-fielding, cross-talk correction, fringing, etc.). From the CP calibrated frames, we use the 5 ASTROMATIC software suite (Source Extractor (SE); SCAMP; SWARP; PSFEx; Bertin & Arnouts 1996; Bertin et al. 2002; Bertin 2006) to register frames to a common coordinate system and account for pixel scale distortions across the DECam field of view using the 2MASS astrometric reference star catalog and calibrate our photometry to the Sloan Digital Sky Survey (SDSS) system using frames of the LSE_44 SDSS southern standard star field taken at varying airmass during the observing nights.. described by effective radius reff, the intensity Ieff at reff, and parameters defining the model shape n and bn that are linked such that half of the total model light is contained within reff. For each band we use an iterative surface-brightness (μ) model-fitting approach (Muñoz et al. 2015; Eigenthaler et al. 2018; Ordenes-Briceño et al. 2018a) by starting with reasonable initial guesses for magnitudes and sizes, and run SE on each cutout with a low detection threshold (DETECT_THRESH=0.5) to construct a segmentation map to mask non-dwarf sources. We then run GALFIT on the masked image and allow all of the parameters—including the minor-to-major iso-photal axis ratio (b/a) and position angles (PAs)—to vary simultaneously. In most cases, models quickly converge to a solution, and in the cases that fail we fix the input magnitude and reff to obtain reasonable estimates on b/a and n, and then fix those parameters while freeing the magnitudes and sizes for refinement. Once an initial model solution has been derived, we then subtract it from the original image, use SE to derive an improved mask and generate a more refined dwarf model, and iterate this process until dwarf properties negligibly vary. The results of this technique are shown in Figure 2 for a selection of dwarfs, where each block is titled by the dwarf identifiers. In each block, the original monochromatic imaging is shown in the upper rows with the corresponding models in the middle rows above the residual images. Close inspection of the residuals shows that the models estimate the μ profiles very well, with the iterative masking strategy effectively decoupling the dwarf signal even in the presence of foreground star contamination. We list the full suite of photometric measurements in Table 1 alongside absolute V-band magnitudes (MV), reff, n, and stellar mass estimates ( ; see Section 3.2). In all cases, the recovered photometric centroids for the dwarf candidates agree to <1″ across filters, providing consistent anchors upon which the remaining model parameters are based. Total apparent magnitudes fall in the range 22.31mu′/mag18.82 and 19.97mz′/mag16.40 in the bluest and reddest filters, corresponding to foreground extinction-corrected (Schlafly & Finkbeiner 2011) −7.42MV/mag−10.82, using the conversion of Jester et al. (2005). Overall we find filterdependent shape parameters in the range 0.15n2.73, and 0.27b/a1.00. Averaging across filters for each dwarf gives shape parameter ranges of 0.37n2.14, and 0.47b/a0.89 with a sample average ánñ » 0.94 and áb añ » 0.72, consistent with typical structural parameters of other dwarf galaxies in the nearby universe (e.g., Eigenthaler et al. 2018). While GALFIT is excellent for model fitting, it is deficient in error estimation. For this, we use the ensemble of all five filters to place uncertainty estimates on the overall sizes and magnitudes. Table 1 lists the mean of each set of filterdependent model reff along with corresponding 1σ error budgets. To estimate errors on the total dwarf magnitudes we use the variance in the sets of modeled reff, n, and b/a to generate new models by fixing each at their maximized/ minimized values, and leaving the magnitudes unconstrained. We use the resulting sets of six models to determine the set of (reff, n, b/a) that produces the brightest/faintest magnitudes and adopt the difference as the uncertainties listed in Table 1.. 3. Analysis 3.1. Dwarf Detection and Photometric Analysis We detect dwarf candidates using a full-color RGB image constructed from our u′g′z′ imaging with custom PYTHON image processing scripts. This filter combination samples the full optical spectral energy distribution (SED) and is sensitive to old, metal-poor stellar populations expected of primordial dwarf galaxies, while the inclusion of the u′-band also serves to sample flux from younger stellar components arising from more recent star formation. Figure 1 shows the RGB image with orange dashed curves indicating NGC 5128-centric isoradial contours. We visually searched this image for faint, extended sources displaying smooth morphologies with shallow surface-brightness (μ) profiles typical of low-luminosity dwarfs. Using this method, we unambiguously find 16 dwarf galaxy candidates, of which a single previously known dwarf is recovered (KK98a 189; Karachentseva & Karachentsev 1998) and the remaining 15 are reported here for the first time, noting that one dwarf (dw1317-4255) has recently been confirmed to be a true member of the Centaurus A group Crnojević et al. 2018). The set of zoom-in images in Figure 1 show the dwarf candidates and measure 2′ on a side, corresponding to physical ∼2.2×2.2 kpc2 regions at the distance of NGC 5128. We point out that by employing a “by eye” detection technique, we are unable to make a robust estimate of the completeness limit to our imaging in a straightforward manner and thus cannot make broad statements on the true total population of dwarfs in this region. We instead defer such an analysis to a future work detailing the overall properties of dwarfs detected throughout our survey region, noting that a lack of completeness estimate does not affect our conclusions. We use GALFIT (v3.0.5; Peng et al. 2010) to measure the structural and photometric properties of the dwarfs. We first create 3 65×3 65 (4 × 4 kpc2) image cutouts in all filters centered on each dwarf. We model the dwarfs using 1D Sérsic (Sérsic 1963) profiles defined as I (r ) = Ieff exp {-bn [(r reff )1 n - 1]}, 5. 3.2. Dwarf Stellar Masses We compute by fitting the extinction-corrected total dwarf magnitudes to SEDs predicted by simple stellar. http://www.astromatic.net/. 2.
(3) The Astrophysical Journal Letters, 867:L15 (8pp), 2018 November 1. Taylor et al.. Figure 1. Locations of the new dwarf galaxy candidates on a u′g′z′-based RGB color image. White-bordered images show 1 5×1 5 cutouts centered on the dwarfs, corresponding to ∼1.7×1.7 kpc2 at the distance of NGC 5128. The scale of the background frame is indicated in the lower-left corner. Dashed orange curves show distances corresponding to 100, 150, and 200 kpc from NGC 5128. North is up, east is to the left.. population (SSP) synthesis models (Bruzual & Charlot 2003). We allow SSP ages and metallicities in the ranges 1–15 Gyr and 0.0001–0.05 [Z/H]. We calculate the χ2 goodness of fit for masses predicted between our observed photometric SEDs, and all SSP models. We assume an average , weighted by exp (-c 2 ), which together with the allowed ranges in age/ metallicity help to mitigate the age–metallicity degeneracy (Zhang et al. 2017). The resulting estimates are listed in the last column of Table 1, and we find that they occupy a relatively narrow range of 5.17 log M 6.48, with a mean log á Mñ = 5.73. With sizes of 70reff/pc300, these objects are broadly consistent with properties of LG dSphs, in particular those that show the highest stellar surface densities, and have many analogs in the Local Volume (LV; Chiboucas et al. 2009; McConnachie 2012; Müller et al. 2015, 2017a, see also Figure 3).. Henkel et al. 2017; Müller et al. 2017b, 2018a; Park et al. 2017), and the Fornax galaxy cluster core (Muñoz et al. 2015; Eigenthaler et al. 2018). We also show low-mass satellites identified in the LG (McConnachie 2012; Bechtol et al. 2015; Smercina et al. 2017; Homma et al. 2018; Muñoz et al. 2018b). For consistency with the LG dwarf data, where possible we show absolute V-band magnitudes converted from g′- and r′-band magnitudes (Jester et al. 2005); however, for some of the dwarfs (Chiboucas et al. 2009; Crnojević et al. 2016; Eigenthaler et al. 2018) neither g′ nor r′ imaging is available, so we defer to those that are available. The size–luminosity relation of the new candidates shows a similar slope as other low-luminosity dwarfs in the nearby universe. Our selection technique biases us toward higher μV such that the new candidates fall almost parallel to lines of iso-μV (gray dashed lines), a trend that is not replicated by LG systems. The faintest of the new dwarfs populate a parameter space mostly devoid of LG analogs, but with several representative systems found throughout the LV. We note that four candidates—namely T18-dw1312-4247, 1314-4204, 1314-4231, and 1319-4203—fall below the main reff–MV relation with reff;100 kpc and MV;−9 mag. These objects have no known analogs and we thus consider the possibility of them being associated with background galaxies at a distance of ∼50 Mpc. Should this be the case, we indicate the. 3.3. Size–Luminosity Relation Figure 3 compares the modeled reff and total luminosities to other low-mass stellar systems in the NGC 5128-M83 complex (Crnojević et al. 2014, 2016; Müller et al. 2015, 2017a), and for additional context to various other dwarfs in the LV, including the M81, M101, M96, and Leo systems (Chiboucas et al. 2009; Merritt et al. 2014; Javanmardi et al. 2016; Bennet et al. 2017; 3.
(4) The Astrophysical Journal Letters, 867:L15 (8pp), 2018 November 1. Taylor et al.. Figure 2. Sample of dwarf galaxy model fits. Blocks are titled by the dwarf identifiers, and show results in the u′g′r′i′z′ filters from left to right. All images measure ∼55″ (∼1 kpc2) on a side. Upper rows in each block show original imaging, with the GALFIT models in the central rows, and model-subtracted residual frames in the row below.. (Eigenthaler et al. 2018), and overlap with several dwarf galaxies elsewhere in the LV; however, a sharp truncation in the size– luminosity relation is seen beyond the faintest dwarf candidates, with a noticeable gap near −7.5MV/mag−5.5. We refrain from speculating on the dearth of LG dwarfs in this region, but note that such compact dwarfs beyond the LG can exhibit similar. size–luminosity parameter locations for the whole sample by dashed star symbols. We discuss this notion further in Section 4, where we find them more likely to be associated with NGC 5128. Many of the new candidates coincide with the faintest dwarf galaxies known in the Fornax galaxy cluster at MV;−8 mag 4.
(5) 5. ID. αJ2000 (hh: mm: ss). δJ2000 (dd: mm: ss). u′ (mag). g′ (mag). r′ (mag). i′ (mag). z′ (mag). MV (mag). reff (″). n. dw1312-4246 dw1312-4244 dw1312-4218 dw1313-4246 dw1313-4211 dw1313-4214 dw1314-4204 dw1314-4230 dw1314-4142 dw1315-4232 dw1315-4309 dw1316-4224 dw1317-4255 dw1318-4233 dw1319-4203. 13:12:10.18 13:12:10.93 13:12:22.48 13:12:42.87 13:13:34.28 13:13:36.40 13:14:08.17 13:14:21.93 13:14:44.82 13:15:02.98 13:15:33.97 13:16:42.27 13:17:48.49 13:18:05.59 13:19:21.26. −42:46:48.53 −42:44:43.66 −42:18:41.58 −42:46:50.57 −42:11:08.38 −42:14:08.11 −42:04:08.51 −42:30:41.87 −41:42:28.27 −42:32:17.78 −43:09:27.18 −42:24:05.32 −42:55:40.45 −42:33:37.10 −42:03:38.74. 20.27±0.11 21.90±0.26 21.98±0.18 21.76±0.11 19.74±0.09 20.11±0.12 20.78±0.05 20.96±0.20 21.62±0.09 20.88±0.21 22.31±0.12 19.34±0.22 21.54±0.22 20.67±0.57 20.47±0.05. 18.76±0.12 20.26±0.19 21.23±0.24 20.32±0.12 18.49±0.08 18.78±0.16 19.18±0.05 19.35±0.12 20.30±0.07 19.58±0.23 21.17±0.18 17.77±0.15 19.70±0.21 19.47±0.42 19.12±0.06. 18.81±0.17 19.88±0.12 20.16±0.13 20.11±0.13 18.29±0.07 18.43±0.15 18.97±0.05 19.05±0.16 20.55±0.04 19.02±0.14 20.63±0.18 17.94±0.25 19.89±0.17 18.84±0.46 19.05±0.08. 17.76±0.19 19.18±0.33 19.58±0.12 19.02±0.13 17.13±0.08 17.31±0.16 18.06±0.05 18.07±0.09 19.44±0.04 18.02±0.18 19.51±0.15 16.86±0.20 18.61±0.25 18.41±0.38 18.11±0.04. 17.86±0.13 18.75±0.47 19.97±0.15 18.92±0.11 17.14±0.09 17.61±0.17 18.22±0.04 17.86±0.11 19.79±0.08 18.32±0.21 19.31±0.17 16.84±0.14 18.73±0.30 18.82±0.34 18.11±0.07. −9.37 −8.12 −7.54 −7.95 −9.79 −9.58 −9.11 −8.96 −7.74 −8.91 −7.42 −10.32 −8.46 −9.14 −9.15. 6.23±0.70 7.51±1.32 6.39±0.66 5.39±0.65 12.00±0.96 9.69±1.19 4.47±0.30 5.92±0.72 3.89±0.25 8.44±1.78 6.05±0.76 14.34±2.01 12.93±1.11 16.78±3.95 4.91±0.40. 1.32±0.35 0.68±0.24 0.68±0.07 1.32±0.19 1.07±0.11 1.06±0.20 0.91±0.14 0.89±0.28 1.01±0.40 1.50±0.37 0.46±0.14 2.14±0.58 0.37±0.09 0.37±0.13 0.52±0.09. +0.34 5.890.36 +0.35 5.350.38 +0.34 5.170.35 +0.35 5.430.49 +0.35 6.150.44 +0.35 6.030.40 +0.35 5.780.35 +0.35 5.890.56 +0.35 5.230.30 +0.35 5.760.42 +0.36 5.27-0.51 +0.34 6.300.35 +0.35 5.550.31 +0.32 5.610.42 +0.34 5.820.34. KK98a 189. 13:12:45.23. −41:49:55.23. 18.82±0.08. 17.40±0.04. 17.35±0.04. 16.42±0.03. 16.40±0.04. −10.82. 14.94±0.68. 0.73±0.05. +0.35 6.480.33. log (Me). The Astrophysical Journal Letters, 867:L15 (8pp), 2018 November 1. Table 1 Photometric Properties of the Dwarf Galaxy Candidates. Note.Column (1) lists dwarf identifiers based on the on-sky coordinates listed in columns (2)–(3). Columns (4)–(8) show the total apparent magnitudes in each filter, followed by the foreground extinction-corrected absolute V-band luminosities, effective radii, average Sérsic index, and stellar mass estimates in columns (9), (10), (11), and (12), respectively.. Taylor et al..
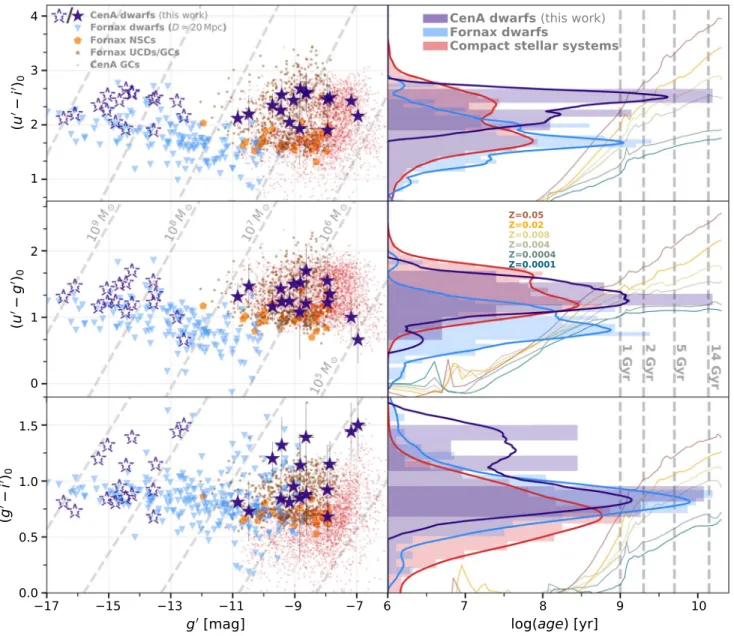
(6) The Astrophysical Journal Letters, 867:L15 (8pp), 2018 November 1. Taylor et al.. Figure 3. Size–luminosity diagram including the present dwarf candidates, LG ultra-faint dwarfs and dSphs, and other dwarf galaxies within the LV and nearby universe, including Fornax cluster dwarfs, and dwarf galaxies associated with more isolated nearby (50 Mpc; see Section 3.3) giant galaxies. We differentiate those already known in the Centaurus A/M83 complex for easier comparison to the candidates presented in this Letter (purple vs. blue stars). Where available, we plot Vband luminosities and convert g′ and r′ magnitudes to V using the relation of Jester et al. (2005); if this is not possible, we plot g′ or r′-band photometry as available from the literature. Empty dashed stars show the sample from this Letter shifted to the distance of a background group at a distance of 50 Mpc (see Section 4).. morphologies to background elliptical galaxies in monochromatic imaging, and only reveal themselves via RGB imaging with sufficiently wide SED coverage. Given this and the overall difficulty identifying such objects beyond the Local Group, it is likely that this region will continue to be filled out as future imaging campaigns probe ever deeper into various giant galaxy environments.. of stellar population properties—with the nuclei and CSS populations, despite having much more diffuse morphologies. The right-hand column in Figure 4 shows a comparison of the sample color distributions, indicated by the shaded histograms aligned to the y-axes, and corresponding Epanechnikov-kernel density estimates (thicker solid lines). We find that while there is some overlap with the generally older and metal-poor Fornax dwarf galaxies, the bulk of the NGC 5128 dwarfs have colors consistent with the secondary red peaks shown by the CSS samples, which shows up most prominently in the (u′−i′)0 color. If the redder colors exhibited by the NGC 5128 dwarfs are due to a metallicity effect, then this might imply early formation within the halos of the giant galaxy progenitors of NGC 5128 itself, where they could incorporate material rapidly enriched by the giants at early times. Alternatively, higher metallicities could be due to either a prolonged primordial star formation history enabling self-enrichment, or a non-primordial burst of star formation may have occurred, possibly by previously enriched gas shocked upon infall into NGC 5128’s halo. The former scenario might be expected from the density-morphology relation (Dressler 1980), where early star formation failed to be suppressed owing to the relatively low-density environment of the Centaurus A group precluding a high number of harassing encounters. In either case, it would require that these dwarfs must have at one point been embedded in dark matter halos of sufficient mass to retain enriched material expelled by early supernovae, which was likely subsequently stripped during infall, thus preventing very recent star formation that would give rise to bluer colors.. 3.4. Comparison to Stellar Population Synthesis Predictions Figure 4 shows a comparison of the new dwarf candidates to those in the Fornax galaxy cluster with u′, g′, and i′ imaging (Muñoz et al. 2015; Eigenthaler et al. 2018), with the same symbol/color definitions as in Figure 3. We also plot nuclear star clusters (NSCs) corresponding to the nucleated dwarf galaxies present in the Fornax sample (orange; OrdenesBriceño et al. 2018b), and compact stellar systems (CSSs) including GCs and ultra-compact dwarf galaxies (UCDs) also confirmed to be members of the Fornax cluster (brown; Wittmann et al. 2016). Finally, we also show for comparison a large sample of NGC 5128 GCs (red points; Taylor et al. 2017) The left column shows (u′−i′)0, (u′−g′)0, and (g′−i′)0 versus Mg′ color–magnitude diagrams (CMDs) for the various samples. The trend toward bluer colors at fainter luminosities is apparent for the Fornax dwarfs in all three panels, most prominently for the (u′−i′)0 CMD, and is typically considered to represent a mass–metallicity relation. The new NGC 5128 dwarf candidates are offset from the Fornax dwarf sample toward redder average colors by Δ(u′−i′)0≈0.6 and Δ(g′−i′)0≈0.4 mag, and appear more consistent—in terms 6.
(7) The Astrophysical Journal Letters, 867:L15 (8pp), 2018 November 1. Taylor et al.. Figure 4. Photometric color properties of low-mass stellar systems. Left panels: (u¢ - i ¢)0 , (u′−g′)0, and (g′−i′)0 vs. g′ color–magnitude diagrams are shown from top to bottom, where the current sample is compared to the Fornax cluster sample shown in Figure 3 (blue triangles), where respective photometry is available. Purple stars show the new NGC 5128 dwarfs, and dashed gray lines show iso- relations using the prescription of Bell et al. (2003). Also shown by orange and brown points are color information for Fornax cluster CSSs including NSCs, UCDs, and GCs, with red points representing NGC 5128 GCs. Right panels: color distributions are shown aligned along the y-axis for the Fornax (blue), NGC 5128 (purple), and combined CSS (red) samples and compared to Bruzual & Charlot (2003) SSP models for a range of metallicities shown by the colored tracks. SSP model tracks are indicated by the thin curves colored according to metallicity, with model ages corresponding to the logarithmic x-axis, and solid gray lines indicating 1, 2, 5, and 14 Gyr.. The relatively high μV may indicate that, rather than being members of the Centaurus A group, these candidates may be associated with known giant galaxies in the background. To guard against this, we queried the NASA/IPAC Extragalactic Database for any background sources classified as galaxies falling within 30′ of a given dwarf candidate that have measured redshifts and/or distances. This projected radius corresponds to a physical separation of ∼200 kpc from a giant host located 25 Mpc away—close enough that dwarf galaxies would be easily spotted by their diffuse natures, while orbiting within a purported host-centric radius where the projected surface number density profile remains high (e.g., Ordenes-Briceño et al. 2018a). Through this exercise, we cannot formally exclude the possibility that at least some of these galaxies, particularly those lying in the southwestern region of the imaging, may be associated with the galaxy group NGC 5011, located at a distance of ∼50 Mpc.. 4. Discussion and Summary We have increased the population of likely dwarf galaxy satellites of the Centaurus A group by 15, and recovered a single known dwarf (Karachentseva & Karachentsev 1998; Karachentsev et al. 2013) in the five optical u′g′r′i′z′ bands. All candidates reside ∼100–225 kpc in NGC 5128’s northwest halo, and their relatively small sizes (reff ≈ 70–300 pc) and stellar masses ( » 10 5 - 6 M) are mostly similar to dSphs found in the Local Universe; however, their relatively high μeff≈23–26 mag arcsec−2 partially populate a region of the low-mass size–luminosity relation not seen in the LG. Rather, these dwarf galaxies appear to be a natural extension of the size–luminosity relation seen in larger galaxy complexes in the nearby universe toward fainter magnitudes that are not yet well sampled in these complexes. 7.
(8) The Astrophysical Journal Letters, 867:L15 (8pp), 2018 November 1. Taylor et al.. Given this potential host, we calculate the corresponding sizes and luminosities of our candidates should they indeed be members of NGC 5011. We plot the results on Figures 3 and 4 as empty dashed stars, and find that, while the faintest half of our candidates fall within the locus of known dwarf galaxies at the bright/large end of the size–luminosity relation, the brightest show a combination of size and luminosity that is essentially devoid of analogs in the LV. When we apply the same exercise to the CMDs in Figure 4, we find that this implies luminosities that are similar to the brightest dwarf galaxies reported in the Fornax sample, but such luminous dwarf galaxies are simply not found in other LV galaxy complexes that are—like NGC 5128—significantly less massive hosts than Fornax. Moreover, if a significant number of these candidates are in fact associated with NGC 5011, this would imply a very shallow slope for the NGC 5011 faint-end galaxy luminosity function. We cannot formally exclude this possibility, given the implication that a group like NGC 5011 would be hosting a significant population of luminous dwarfs thus far only found in galaxy cluster environments. This therefore suggests that it is likely that most, if not all, of the present candidates are indeed associated with NGC 5128, which will ultimately require spectroscopic verification. Given that the majority of new dwarf candidates are very likely to be associated with NGC 5128, we turn our attention back to Figure 1, specifically noting the existence of at least two groups of three galaxies (dw1314-4204, 1313-4211, and 1313-4214; and dw1312-4244, 1312-4246, and 1313-4246), each with projected separations of 20 kpc. While it is impossible to determine their true 3D locations in NGC 5128’s halo with the current data, we note that such groups are to be expected from modern cosmological zoom-in simulations (e.g., Wetzel et al. 2015; Besla et al. 2018), and thus may represent important examples of dwarf groups in the early stages of interaction while infalling upon NGC 5128’s halo. If so, then these groups, and the present dwarf sample as a whole may represent a valuable opportunity to study these processes in detail in the very nearby universe.. ORCID iDs Matthew A. Taylor https://orcid.org/0000-0003-3009-4928 Paul Eigenthaler https://orcid.org/0000-0001-8654-0101 Thomas H. Puzia https://orcid.org/0000-0003-0350-7061 Roberto P. Muñoz https://orcid.org/0000-0003-1743-0456 Yasna Ordenes-Briceño https://orcid.org/0000-00017966-7606 References Astropy Collaboration, Robitaille, T. P., Tollerud, E. J., et al. 2013, A&A, 558, A33 Bechtol, K., Drlica-Wagner, A., Balbinot, E., et al. 2015, ApJ, 807, 50 Bell, E. F., McIntosh, D. H., Katz, N., & Weinberg, M. D. 2003, ApJS, 149, 289 Belokurov, V., Walker, M. G., Evans, N. W., et al. 2010, ApJL, 712, L103 Bennet, P., Sand, D. J., Crnojević, D., et al. 2017, ApJ, 850, 109 Bertin, E. 2006, in ASP Conf. Ser. 351, Astronomical Data Analysis Software and Systems XV, ed. C. Gabriel et al. (San Francisco, CA: ASP), 112 Bertin, E., & Arnouts, S. 1996, A&AS, 117, 393 Bertin, E., Mellier, Y., Radovich, M., et al. 2002, in ASP Conf. Ser. 281, Astronomical Data Analysis Software and Systems XI, ed. D. A. Bohlender, D. Durand, & T. H. Handley (San Francisco, CA: ASP), 228 Besla, G., Patton, D. R., Stierwalt, S., & Rodriguez-Gomez, V. 2018, MNRAS, 480, 3376 Bruzual, G., & Charlot, S. 2003, MNRAS, 344, 1000 Chiboucas, K., Karachentsev, I. D., & Tully, R. B. 2009, AJ, 137, 3009 Crnojević, D., Sand, D. J., Bennet, P. N., et al. 2018, arXiv:1809.05103 Crnojević, D., Sand, D. J., Caldwell, N., et al. 2014, ApJL, 795, L35 Crnojević, D., Sand, D. J., Spekkens, K., et al. 2016, ApJ, 823, 19 Dressler, A. 1980, ApJ, 236, 351 Eigenthaler, P., Puzia, T. H., Taylor, M. A., et al. 2018, ApJ, 855, 142 Harris, G. L. H., Rejkuba, M., & Harris, W. E. 2010, PASA, 27, 457 Henkel, C., Javanmardi, B., Martínez-Delgado, D., Kroupa, P., & Teuwen, K. 2017, A&A, 603, A18 Homma, D., Chiba, M., Okamoto, S., et al. 2018, PASJ, 70, S18 Hunter, J. D. 2007, CSE, 9, 90 Ibata, R. A., Lewis, G. F., Conn, A. R., et al. 2013, Natur, 493, 62 Javanmardi, B., Martinez-Delgado, D., Kroupa, P., et al. 2016, A&A, 588, A89 Jester, S., Schneider, D. P., Richards, G. T., et al. 2005, AJ, 130, 873 Karachentsev, I. D., Makarov, D. I., & Kaisina, E. I. 2013, AJ, 145, 101 Karachentseva, V. E., & Karachentsev, I. D. 1998, A&A, 127, 409 McConnachie, A. W. 2012, AJ, 144, 4 Merritt, A., van Dokkum, P., & Abraham, R. 2014, ApJL, 787, L37 Müller, O., Jerjen, H., & Binggeli, B. 2015, A&A, 583, A79 Müller, O., Jerjen, H., & Binggeli, B. 2017a, A&A, 597, A7 Müller, O., Jerjen, H., & Binggeli, B. 2018a, arXiv:1802.08657 Müller, O., Jerjen, H., Pawlowski, M. S., & Binggeli, B. 2016, A&A, 595, A119 Müller, O., Pawlowski, M. S., Jerjen, H., & Lelli, F. 2018b, Sci, 359, 534 Müller, O., Scalera, R., Binggeli, B., & Jerjen, H. 2017b, A&A, 602, A119 Muñoz, R. P., Eigenthaler, P., Puzia, T. H., et al. 2015, ApJL, 813, L15 Muñoz, R. R., Côté, P., Santana, F. A., et al. 2018a, ApJ, 860, 65 Muñoz, R. R., Côté, P., Santana, F. A., et al. 2018b, ApJ, 860, 66 Ordenes-Briceño, Y., Eigenthaler, P., Taylor, M. A., et al. 2018a, ApJ, 859, 52 Ordenes-Briceño, Y., Puzia, T. H., Eigenthaler, P., et al. 2018b, ApJ, 860, 4 Park, H. S., Moon, D.-S., Zaritsky, D., et al. 2017, ApJ, 848, 19 Pawlowski, M. S., Pflamm-Altenburg, J., & Kroupa, P. 2012, MNRAS, 423, 1109 Peng, C. Y., Ho, L. C., Impey, C. D., & Rix, H.-W. 2010, AJ, 139, 2097 Sánchez-Janssen, R., Ferrarese, L., MacArthur, L. A., et al. 2016, ApJ, 820, 69 Schlafly, E. F., & Finkbeiner, D. P. 2011, ApJ, 737, 103 Sérsic, J. L. 1963, BAAA, 6, 41 Smercina, A., Bell, E. F., Slater, C. T., et al. 2017, ApJL, 843, L6 Taylor, M. A., Puzia, T. H., Muñoz, R. P., et al. 2017, MNRAS, 469, 3444 Valdes, F., Gruendl, R. & DES Project 2014, in ASP Conf. Ser. 485, Astronomical Data Analysis Software and Systems XXIII, ed. N. Manset & P. Forshay (San Francisco, CA: ASP), 379 Wenger, M., Ochsenbein, F., Egret, D., et al. 2000, A&AS, 143, 9 Wetzel, A. R., Deason, A. J., & Garrison-Kimmel, S. 2015, ApJ, 807, 49 Wittmann, C., Lisker, T., Pasquali, A., Hilker, M., & Grebel, E. K. 2016, MNRAS, 459, 4450 Zhang, H.-X., Puzia, T. H., & Weisz, D. R. 2017, ApJS, 233, 13. We thank the anonymous referee for a fair critique of this work, and the useful feedback that served to improve the original manuscript. M.A.T. is supported by the Gemini Observatory, which is operated by the Association of Universities for Research in Astronomy, Inc., on behalf of the international Gemini partnership of Argentina, Brazil, Canada, Chile, and the United States of America. This project is supported by FONDECYT Regular project No. 1161817 and the BASAL Center for Astrophysics and Associated Technologies (PFB-06). This project used data obtained with the Dark Energy Camera (DECam), which was constructed by the Dark Energy Survey (DES) collaboration. This research has made use of the NASA Astrophysics Data System Bibliographic Services, the NASA Extragalactic Database, and the SIMBAD database and VizieR catalog access tool, operated at CDS, Strasbourg, France (Wenger et al. 2000). Facility: CTIO:Blanco/DECam. software: ASTROPY (Astropy Collaboration et al. 2013), MATPLOTLIB (Hunter 2007), SCAMP (Bertin et al. 2002), SWARP (Bertin 2006), SOURCE EXTRACTOR (Bertin & Arnouts 1996), GALFIT (Peng et al. 2010), 8.
(9)
Figure


Documento similar