Thermomechanical And Metallurgical
Modelling Of Laser Hardening And Laser
Cladding Processes
PhD Thesis
Alejandro Suárez Díaz
Departament of Industrial Engineering Escuela Politécnica Superior
Universidade da Coruña
Thermomechanical And Metallurgical
Modelling Of Laser Hardening And Laser
Cladding Processes
PhD Thesis Alejandro Suárez Díaz
Directed by the Professors: Armando J. Yáñez Casal
María J. Tobar Vidal
Departament of Industrial Engineering Escuela Politécnica Superior
Copyright c Alejandro Suárez Díaz
Acknowledgements
I want to express my special gratitude to my parents, who encouraged me to learn things and gave me the freedom I need since I was a child. They always supported me, both in the good and bad moments. Their qualities are an example to follow. Special thanks to the rest of my family and friends, for always been so supportive, teach me so many things and be responsible of some of the best moments of my life.
I want to thank all the colleagues from the Laboratory of Laser Industrial Applications of the Universidade Da Coruña, for their help, ideas and interesting things that I have learned with them. Specially to my director, Armando, who encouraged me to do postgraduate studies from the beginning and was always supportive and optimistic. Also to Jose, who introduced me to the eld of laser materials processing and taught me lots of interesting things during this four years, and to Diego, my apprentice, who served as a meticulous editor for the thesis.
I also want to express my gratitude to my supervisor in Siemens AG at Mülheim an der Ruhr during my six months stay, and to the friendly people I met there. I want to acknowledge the excellent people working at the ESRF who helped me with the experimental procedure as well as the processing of the data. Also my gratitude to the funny professors of materials science at the University Rey Juan Carlos, in Madrid, where I was doing another six months stay. And nally, I want to acknowledge the funding given by the spainish Ministery of Science and Innovation as a FPI grant.
Summary
The development of high stresses and distortions is one of the main concerns in laser surface heat treatments. The objective of the present thesis is to contribute to the better understanding of the thermomechanical behavior during laser transformation hardening and laser metal deposition techniques, including as well the development of a exible tool with customizable models for the numerical calculation of the thermomechanical variables, and the microstructural evolution through phase transformation models.
Such a tool will be useful for the prediction of the residual strains and stresses after the processes as well as the phase changes, helping with its optimization and understanding, thus reducing the number of test trials necessary to achieve the desired results. Something that has paramount importance when unique or expensive workpieces should be treated.
The model was validated using several experimental techniques to assess its predictions and ne tune some of its parameters.
Resumen
La generación de altas tensiones y deformaciones es una de las mayores preocupaciones en los tratamientos térmicos superciales por láser. El objetivo de la presente tesis es el de contribuir al mejor entendimiento del comportamiento termomecánico durante el endurecimiento supercial por láser y las técnicas de deposición de metal por láser, incluyendo también la creación de una herramienta exible con modelos adaptables para el cálculo numérico de las variables termomecánicas, así como la evolución microestructural mediante modelos de transformación de fase.
Tal herramienta será útil en la predicción de los esfuerzos y deformacíones residuales después del tratamiento, ayudando con su optimización y mejor entendimiento, y por tanto reduciendo el número de ensayos necesarios para alcanzar los resultados deseados. Algo de gran importancia cuando piezas únicas o de gran valor deben tratarse.
El modelo ha sido validado utilizando varias técnicas experimentales para comparar sus predicciones y ajustar algunos de sus parámetros.
Resumo
A xeración de altas tensións e deformacións é unha das maiores preocupacións dos tratamentos térmicos superciais por láser. O obxectivo da presente tesis é o de contribuir ao mellor entendemento do comportamento termomecánico durante o endurecemento supercial por láser e as técnicas de deposición de metal por láser, incluindo tamén o desenvolvemento dunha ferramenta exible con modelos adaptables para o cálculo numérico das variables termomecánicas, así como da evolución microestrutural mediante modelos de transformación de fase.
Tal ferramenta será de utilidade na predicción dos esforzos e deformacións residuais despois do tratamento, axudando coa sua optimización e mellorando o seu entendemento, e por tanto diminuindo o número de ensaios necesarios para obter os resultados desexados. Algo de meirande importancia cando pezas únicas ou de gran custo deben ser tratadas.
O modelo foi validado mediante o uso de varias técnicas experimentais para comparar o grao de axeitamento das súas prediccións e axustar algúns dos seus parámetros.
xviii Index
5 Material Modelling: Plasticity And Phase Transformations 53 5.1 Plasticity . . . 53
Index xix
6.8.2 Mechanical Analysis . . . 83
6.9 Thermomechanical Anlysis Of LTH . . . 84
6.9.1 Without Phase Transformations . . . 84
6.9.2 With Phase Transformations . . . 88
7 Model For Laser Metal Deposition 93 7.1 Introduction . . . 93
III Experimental Validation Of The Models 107 8 Measurement Of Residual Strains And Stresses 109 8.1 Introduction . . . 109
8.2 Techniques To Measure Residual Stresses . . . 110
8.3 Techniques Selected For The Validation Of The Models . . . 111
9 Measurement Of Temperatures And Distortions On Steel Plates 113 9.1 Measurement Of Temperatures . . . 113
11 Estimation Of The Residual Stresses With Nanoindentation Techniques 141 11.1 Introduction . . . 141
11.2 Experimental . . . 143
11.2.1 Materials . . . 143
xx Index
11.2.3 Nanoindentation Measurements . . . 144
11.3 FEM Models . . . 146
11.3.1 Laser Cladding Model . . . 146
11.3.2 Nanoindentation Model . . . 146
11.4 Results And Discussion . . . 148
11.4.1 Residual Stresses After The Cutting Of The Samples . . . 148
11.4.2 Hardness Measurements By Nanoindentation . . . 148
11.4.3 Conclusions . . . 151
12 Measurement Of Residual Stresses With Synchrotron Radiation 153 12.1 Introduction . . . 153
12.2 Experimental . . . 154
12.2.1 Materials . . . 154
12.2.2 Laser Cladding Experimental Setup And Sample Preparation . . . 154
12.2.3 Synchrotron Experimental Setup And EDXRD Stress Measurement Technique . . . 154
12.3 FEM Model . . . 156
12.4 Results And Discussion . . . 158
12.4.1 Single Track Samples . . . 158
12.4.2 Multitrack Sample . . . 160
12.4.3 Conclusions . . . 161
Conclusions 163
List Of Contributions 165
List of Figures
2.1 Eects and applications of lasers under various operating conditions (from [1]) . 6 2.2 (a) Eect of temperature on laser light absorptivity (from [2]). (b) Reectivity as
a function of wavelength for various materials (from [3]). . . 8
3.1 LTH of a cylindrical workpiece at high rotational speeds (from [4]) . . . 10 3.2 LTH with a rastering beam (from [5]) . . . 11 3.3 Commom beam shapes used in LTH and their corresponding hardened proles. (a)
Gaussian beam. (b) Rectangular beam. (c) Rectangular-Gaussian beam. (from [6]) 12 3.4 Iron-Carbon equilibrium phase diagram . . . 13 3.5 Experimentally determined and calculated volume fraction of martensite for
TAmax=850 and 1150oC and dierent heating rates at cooling rate of: (a) 1000
K/s and (b) 3000 K/s (from [7]) . . . 14 3.6 Comparison of predicted case depth from thermal-kinetic modelling with
experimental measures, with respect to energy density variation under: (a) constant speed; (b) constant power (from [8]) . . . 15 3.7 Commom shapes of hardened zone after LTH with pulsed beam (from [9]) . . . . 16 3.8 Cross section plots in laser hardened tracks including the eect of back-tempering:
(a) phases; (b) hardness (from [10]) . . . 17 3.9 Predicted and measured hardness prole along the width of the sample for a two
pass LTH process including the eect of back-tempering (from [10]) . . . 18 3.10 Predicted longitudinal residual stresses (in the laser moving direction) below
surface as a function of depth below surface for: (a) dierent carbon contents; (b) dierent laser input energy for a 0.44% C steel (from [11]) . . . 19 3.11 Predicted longitudinal residual stresses (in the laser moving direction) below
surface as a function of depth below surface for: (a) dierent carbon contents; (b) dierent laser input energy for a 0.44% C steel (from [11]) . . . 20 3.12 Predicted and measured hardness prole along the width of the sample for a two
pass LTH process including the eect of back-tempering (from [12]) . . . 21 3.13 Overview of the main considerations in laser keyhole welding (from [13]) . . . 22 3.14 Plastic zones during welding. The dashed lines correspond to the line of maximum
temperatures (from [14]) . . . 23 3.15 Fluid dynamics of the melt pool during laser beam deep penetration welding
of stainless steel: (a) vertical view; (b) horizontal view. Laser power: 3 kW; wavelength: 10.6µm; beam radius: 200µm; prole: Gaussian; feed rate: 6 m/min
(from [13]) . . . 25
xxii List of Figures
3.16 Pore formation during laser beam deep penetration welding of stainless steel at high feed rates. Laser power: 6 kW; wavelength: 10.6µm; beam radius: 200 µm;
prole: Gaussian; feed rate: 12 m/min (from [13]) . . . 26 3.17 Von Mises equivalent stress during hybrid laser-GTAW welding (from [15]) . . . . 28 3.18 Temperature distribution (in Kelvin) at t=20 s for a multistep laser pulse energy
(from [16]) . . . 30 3.19 Coaxial laser cladding: (a) particle concentration; (b) particle velocity (from [17]) 31 3.20 (a) Temperature distribution for several points in the cladding and workpiece,
during the laser cladding of a valve seat; (b) Principal residual stresses (from [18]) 32 3.21 Von Mises residual stresses after the cladding process of 3 overlapped clad tracks
(from [19]) . . . 33 3.22 Distributions of longitudinal (a) and transverse (b) residual stresses on a cross
section through six overlapping beads of Stellite 21 on AISI 1045, including phase transformations (from [20]) . . . 34 3.23 Vickers hardness distribution after cooling to room temperature, for a substrate
of: (a)m= 102.8g, (b)m= 13.5g (from [21]) . . . 35
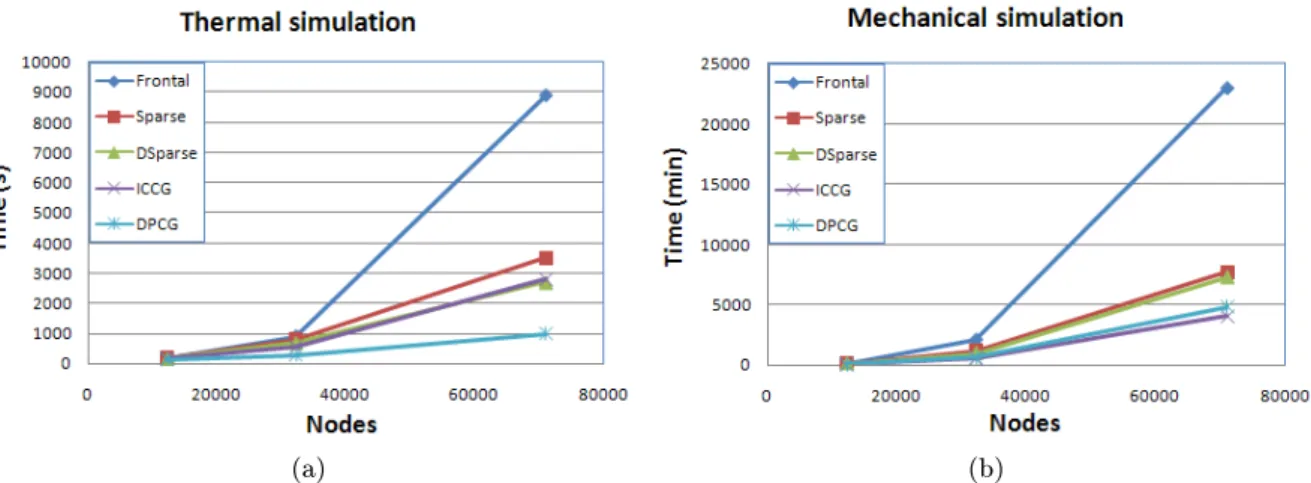
4.1 Couplings between all the relevant elds in LTH simulations. Weak couplings are in grey (4, 6) . . . 40 4.2 Scheme of the Full Newton-Raphson method in 1D. . . 44 4.3 Computing time vs number of nodes for several solvers in: (a) thermal analysis;
(b) mechanical analysis. . . 47 4.4 Computer menory vs number of nodes for several solvers during: (a) thermal
analysis; (b) mechanical analysis. . . 47 4.5 Shape changes under a bending moment: (a) ideal situation; (b) fully integrated
rst order element; (c) reduced integration rst order element . . . 48 4.6 Dierent meshes for the element behavior and convergence study. . . 50
5.1 Deformation of a metal: (b) pure elastic; (c) elastic-plastic; (d) pure plastic . . . 53 5.2 Schematic 2D diagrams showing: (a) isotropic hardening; (b) kinematic hardening 56 5.3 (a) Strain during phase transformation austenite ferrite; (b) thermal conductivity
of bcc and fcc iron phases . . . 57 5.4 Carbon diusion during austenitization: (a) fast intragranular diusion in pearlite;
(b) slow homogenization of a hypoeutectoid steel (from [22]) . . . 57 5.5 Iron-Carbon phase diagram showing the medium carbon steel CK45 and a
representation of the dierent microstructures during austenitization . . . 59 5.6 TTA diagram for CK45 carbon steel . . . 60 5.7 Schematic of the geometrical model for the pearlite dissolution . . . 61 5.8 Schematic of the geometrical model for the austenitization of proeuctectoid ferrite 61 5.9 Carbon diusion from homogeneous austenite to ferrite calculated for several times. 62 5.10 Calculation of anisothermal growth kinetics by using Scheil's additivity principle
and JMA equation (from [23]). . . 63 5.11 Tempered martensite volume fraction calculated for several temperatures and times. 64
List of Figures xxiii
6.4 Dierent laser modes: (a,d) TEM00 (Gaussian); (b,e) TEM01* (Annular); (c,f) Uniform (Top Hat) . . . 71 6.5 (a) Representation of a temperature dependent absorptivity in an ANSYS Table;
(b) scheme of a 3D ANSYS Table . . . 72 6.6 Residual plastic strains during a simulation of LTH with complex trajectories . . 72 6.7 Scheme of the macros used for the LTH simulations. Phase transformation model
can be used in each load step (A) or after the thermal simulation (B). . . 73 6.8 Scheme showing the phase transformations in steels and their relationships . . . . 75 6.9 Vector for each element containing the information required for the calculation of
the phase transformations for steels. . . 76 6.10 Scheme of the macros called by the phase transformation macro for steels. . . 76 6.11 (a) Temperature map in the cross section of a plate during a LTH simulation; (b)
corresponding austenite volume fraction. . . 77 6.12 (a) Martensite volume fraction in the cross section of a plate during a LTH
simulation; (b) corresponding retained austenite volume fraction. . . 78 6.13 (Tempered martensite volume fraction in the cross section of a plate during a LTH
simulation. . . 78 6.14 (a) Austenite volume fraction in the cross section of a plate during a LTH
simulation; (b) martensite volume fraction at the end of the simulation. . . 79 6.15 Phase diagram for alloys Ti-6Al with dierent vanadium contents from [24] . . . 80 6.16 Vector for each element containing the information required for the calculation of
the phase transformations for titanium. . . 81 6.17 Boundary conditions during the mechanical analysis: (a) model with symmetry;
(b) without symmetry. . . 83 6.18 Mesh used in the LTH simulation. . . 84 6.19 (a) Temperature map during the simulation; (b) temperature histories of several
consecutive nodes. . . 85 6.20 Vertical displacements (deformed shape multiplied by 30): (a) During the heating
(t=0.4s); (b) after the cooling. . . 85 6.21 Schematic representation of the generation of strains and stresses during LTH. . . 85 6.22 Stresses during the heating stage (t=0.8s): (a) X; (c) Y; (e) Z; Stresses after the
cooling down (t=100s): (b) X; (d) Y; (f) Z. . . 86 6.23 Residual strains: (a) elastic; (b) plastic . . . 86 6.24 Von Mises equivalent stress (represented in isosurfaces): (a) During the heating
(t=0.8s); (b) after the cooling down (t=100s). . . 87 6.25 Temporal history of one node heated by the laser beam: (a) stresses; (b) strains. 88 6.26 Coecients of thermal expansion, with and without austenitization. . . 88 6.27 Phase volume fractions: (a) austenite (t=1s); (b) austenite (t=100s); (c)
martensite (t=1s); (d) martensite (t=100s); (e) temperature map (t=1s); (f) nal hardness prole. . . 89 6.28 Residual stresses in the following directions: (a) X; (b) Y; (c) Z; (d) Von Mises. . 90 6.29 Residual strains: (a) elastic; (b) plastic. . . 91 6.30 Temporal history of one node heated by the laser beam: (a) stresses; (b) strains. 91
xxiv List of Figures
7.4 Dierent slice shapes created changing: (a) number of slice divisions; (b) parameters of the ellipsoid dening their geometry . . . 96 7.5 Cross section of 2D clad beads generated with an overlapping of: (a) 40%; (b) 55%. 96 7.6 (a) Model with four overlapped clad beads; (b) Model with four superposed clad
beads. . . 97 7.7 2D laser cladding models: (a) geometry; (b) mesh. . . 99 7.8 Bending of the plate during the cladding process: (a) during the metal deposition
(concave); (b) after cooling down (concave). . . 100 7.9 Parametrical study of the laser cladding with the 2D model . . . 101 7.10 Simulation with several overlapped clad tracks: (a) temperatures; (b) Von Mises
stress . . . 102 7.11 Von Mises stress of the cross section of the model with several overlapped clad
tracks: (a) one track; (b) two tracks; (c) three tracks; (d) four tracks (external surfaces) . . . 103 7.12 Simulation with several superposed clad tracks: (a) temperatures; (b) Von Mises
stress . . . 104 7.13 Von Mises stress of the cross section of the model with several superposed clad
tracks: (a) one track; (b) two tracks; (c) three tracks; (d) four tracks (external surfaces) . . . 104 7.14 Phase volume fractions calculated with the model with overlapped clad tracks
(after nal cooling): (a) martensite; (b) tempered martensite. . . 105 7.15 (a) Final hardness map calculated with the model with overlapped clad tracks;
(b) Von Mises equivalent stress. . . 105 7.16 Von Mises stress and temperature histories calculated for two elements from the
model with overlapped clad tracks. . . 106 7.17 Stress and temperature histories calculated for one element of the rst clad track
from the model with overlapped clad tracks. . . 106
8.1 Residual stress types and their characteristic length scales in which they self-equilibrate (from [25]) . . . 110
9.1 Material properties of Inconel 718 and steel ST-52 used in the thermal simulations: (a) Thermal conductivity; (b) Enthalpy; (c) Density . . . 114 9.2 Geometry of the samples and location of the thermocouples: (a) Inconel 718 (b)
Steel ST-52 . . . 115 9.3 Geometry of the samples used in the FEM models . . . 116 9.4 One of the models having a plate underneath the sample . . . 116 9.5 Temperature histories, measured and simulated, from the experimental tests with
Inconel 718 plates: (a) Test 1; (b) Test 2 . . . 117 9.6 Temperature histories, measured and simulated, from the experimental tests with
steel ST-52 plates: Test 3 . . . 118 9.7 Material properties of AISI 304 and DC01 used in the thermal simulations: (a)
Thermal conductivity; (b) Enthalpy; (c) Density . . . 119 9.8 Material properties of AISI 304 and DC01 used in the mechanical simulations:
List of Figures xxv
9.11 Deformations and stresses of the AISI 304 bending samples: (a) during the rst laser passing; (b) during the nal cooling down. . . 122
10.1 Properties of the carbon steel AISI 1045 used in the simulations. . . 124 10.2 FEM mesh for the LSM tests with AISI 1045. . . 125 10.3 Dierent microstructures of AISI 1045 steel: (a) ferritic-pearlitic; (b) martensite;
(c) tempered martensite; (d) interphase between ferrite-pearlite and HAZ. . . 125 10.4 Cross section of one laser melted track, showing microindentation marks. . . 126 10.5 Results of Test 1. First track at left. . . 126 10.6 Results of Test 2. First track at right. . . 127 10.7 Results of Test 3. First track at right. . . 127 10.8 Several microstructures present in the samples. . . 128 10.9 (a) Microstructure of the experimental sample; data predicted by the model: (b)
hardness prole; (c) melted zones; (d) martensite volume fraction; (e) retained austenite volume fraction; (f) tempered martensite volume fraction. . . 128 10.10Hardness map calculated for Test 3. . . 129 10.11Experimental setup for the laser cladding of Ti6Al4V on pure Ti. . . 130 10.12Thermal properties of Ti6Al4V and pure Ti. . . 130 10.13Mesh used in the simulations of laser cladding of Ti6Al4V on pure Ti. . . 131 10.14Comparison between measured and simulated temperature histories. . . 132 10.15Microstructure of the dierent samples of Ti6Al4V on pure Ti. . . 132 10.16(a) SEM image of the Ti6Al4V deposited; (b) EDX semiquantitative measurements.132 10.17Model with single clad tracks of Ti6Al4V on pure Ti, load step at the end
of deposition process: (a) temperatures; (b) beta phase; (c) alpha phase; (d) martensite. . . 133 10.18(a) Comparative between the microstructure of the experimental sample and the
calculated one; (b) curves indicating phase evolution in the model. . . 133 10.19FEM model of seven overlapped clad tracks. . . 134 10.20Metallography of the cross section of the test with seven overlapped clad tracks. . 134 10.21Several images from the simulation with seven overlapped clad tracks: (a)
temperature eld; volume fractions: (b) beta; (c) martensite; (d) alpha. . . 135 10.22Elements selected for the history charts in the model of seven overlapped clad tracks.136 10.23History charts from the simulation with seven overlapped clad tracks: (a)
temperature eld; volume fractions: (b) beta; (c) martensite; (d) alpha. . . 136 10.24FEM model with ten superposed clad tracks. . . 137 10.25Cross section of the sample wit ten superposed clad tracks. . . 137 10.26Several images from the simulation with seven overlapped clad tracks: (a)
temperature eld; volume fractions: (b) beta; (c) martensite; (d) alpha. . . 138 10.27Phase and temperature history of one element of the rst track from the model of
ten superposed clad tracks. . . 139
11.1 Sample cut by means of EDM . . . 143 11.2 Load vs penetration curve for a typical nanoindentation measurement . . . 144 11.3 Indentation depths and contact area during a nanoindentation test. . . 145 11.4 Three Berkovich indentation marks. Their averaged properties constitute one
xxvi List of Figures
11.6 Geometry and mesh of the nanoindentation FEM model. . . 147 11.7 (a) Geometry of the samples including the coordinate system used for the stresses;
(b) Cross section of one of the samples. . . 149 11.8 (a) Load vs penetration curves, for areas with dierent levels of residual stresses,
obtained from the experimental measurements; (b) Load vs penetration curves measured and simulated, for an area with tensile stresses. . . 150 11.9 (a) Apparent hardness map from the sample with one clad bead; (b) Comparison
between the Z direction stresses from the FEM model (left) and the apparent
hardness map from the measurements (right). . . 150 11.10(a) Apparent hardness map from the sample 300◦C of preheating, one clad bead;
(b) Apparent hardness map from the sample with several clad beads. . . 151
12.1 (a) Geometry of the samples including the coordinate system used for the stresses; (b) Cross section of one of the samples. . . 155 12.2 Scheme of the experiment . . . 156 12.3 Setup of the experiment inside the experimental hutch of the beamline ID15A at
ESRF. . . 157 12.4 Mesh used in the simulations with one clad track . . . 157 12.5 (a) Residual stresses in the Z direction measured by EDXRD, for the sample
without preheating (b) Predicted by the 3D model . . . 159 12.6 (a) Residual stress prole over the height of the sample near its center, starting at
the bottom of the plate, for the sample without preheating, measured by EDXRD, (b) predicted by the 3D model. . . 159 12.7 (a) Residual stresses in theZ direction measured by EDXRD, for the sample with
preheating (b) Predicted by the 3D model . . . 160 12.8 (a) Residual stresses in theZ direction measured by EDXRD, for the sample with
several overlapped clad tracks; (b) Predicted by the 3D model, (positions of the clad tracks indicated through arrows) . . . 161 12.9 Residual stress prole over the height of the sample, near its center, starting at the
List of Tables
4.1 Error percentage (%) of the dierent tests with respect to the converged solution. Negative values represent results below the solution value. . . 50
6.1 Parameters for the JMA equation during the transformations: β →α andα0 →α 81
9.1 Chemical composition of carbon steel ST-52 and nickel base superalloy Inconel 718 114 9.2 Parameters used in the experimental tests for the measurement of temperatures . 115 9.3 Chemical composition of very low carbon steel DC01 and stainless steel AISI 304. 119 9.4 Parameters used in the experimental tests for the measurement of temperatures . 121 9.5 Results from the bending tests. . . 122
10.1 Parameters of the experimental LSM tests with AISI 1045. . . 124 10.2 Parameters of the experimental tests carried out with titanium. . . 131
11.1 Maximum values measured from the experimental curves and calculated in the simulations, in three dierent cases of residual stress. . . 149 11.2 Composition and thermomechanical properties of AISI 304 and Stellite 6.
Extrapolated values are in italics. . . 152
Part I
Introduction
Chapter 1
Introduction
In the beginning the Universe was created. This has made a lot of people very angry and been widely regarded as a bad move. Douglas Adams (The Hitch Hiker's Guide to the Galaxy).
Abstract: The objectives and scope of the present thesis along with the motivations of the research in this particular eld are exposed in this chapter. A brief description of the structure of the thesis is included at the end of it.
1.1 Motivation
The laser is one of the most relevant inventions of the 20th century, with thousands of applications in numerous elds. In material processing it serves as a focalized power source, outperforming conventional processes and allowing special applications, like rapid prototyping.
The development of high stresses and distortions is one of the main concerns in laser surface heat treatments, and it has special relevance in the laser cladding technique. Residual stresses are detrimental to the integrity of the workpiece. During the process the stresses can reach values high enough to produce cracks in the material. But even if cracks do not appear, the residual stresses can enhance the susceptibility to fatigue, stress-corrosion cracking and lower the failure criterion. Additionally it is of great importance to keep distortions to a minimum, because the development of large deformations could render the workpiece unusable.
Metallurgy has to be taken into account when the working material shows phase transformations, as in the case of carbon and low alloy steels. Stresses and strains change completely when the phase transformation occurs, leading to completely wrong values if metallurgy is neglected. However this increases the complexity of the models, because metallurgy is deeply interrelated with the thermal and mechanical elds generated during the treatments, making dicult the accurate simulation of these processes.
Empirical methods to measure residual stresses are usually complex, expensive or time consuming. In contrast computer simulations can supply a great amount of information, allowing
4 Chapter 1. Introduction
also the calculation of relevant variables during the ongoing process with great exibility, helping to get an insightful understanding of the underlying thermomechanical aspects.
1.2 Objectives and Scope
The objective of the present thesis is to contribute to the better understanding of the thermomechanical behavior of laser transformation hardening and laser cladding techniques, including the development of a exible tool with customizable models for the numerical calculation of the thermomechanical variables of these processes and the microstructure evolution through phase transformation models.
Such a tool will be useful for the estimation of the residual strains and stresses after the processes as well as the phase changes, helping with its optimization too, thus reducing the number of test trials necessary to achieve the desired results. Something that has paramount importance when unique or expensive workpieces have to be treated.
Research within this area has been focused on the modelling of welding, especially the uid dynamics of the process, and also to the prediction of the microstructural evolution during laser transformation hardening. Less eorts have been made to model the laser cladding yet, or the mechanical aspects of laser transformation hardening.
The scope of the present work is to primarily establish methodologies for the numerical prediction of the relevant variables during laser transformation hardening and laser cladding techniques. Emphasis is made in the detailed prediction of the qualitative and quantitative response of small size structures. The computational eciency and the overcoming of convergence problems are studied for the improvement of the numerical solution.
Experimental tests performed in the laboratory using methods for the measurement of temperatures, residual stresses and strains were used to validate the predictions of the model.
1.3 Structure of the Thesis
The contents of the thesis are presented in three parts composed as follows.
Part I consists of the presentation of the objectives and motivation of the present work, followed by some introductory chapters which aim is to establish the knowledge foundations for the laser material processing techniques that will be modeled in the next part of the thesis: laser transformation hardening and laser cladding, including a comprehensive review of the numerical modelling of both techniques, and some basics of light matter interaction of special relevance.
The aim of Part II is to present the nite element theory and the metallurgical phase transformation models used in the numerical simulations. After these introductory chapters, the numerical analysis of laser hardening and laser cladding is treated in detail, with special emphasis in the key aspects.
Chapter 2
Light In Materials Processing
For the rest of my life I will reect on what light is. Albert Einstein (in S. Perkowitz, Empire of Light).
Abstract: This chapter gives a brief introduction to the evolution in the eld of laser materials processing over the last decades. Afterwards the basic principles of the absorption of laser light are treated at the end of the chapter.
2.1 Laser Materials Processing
2.1.1 Introduction
The laser is becoming an important tool for many engineering applications. Laser material processing has proved to be able to achieve higher qualities than other conventional processes that are commonly used in the industry. The key for this success is an intense light beam which can be focused to achieve high power densities, making possible some of its most successful industrial applications: laser cutting and laser welding, and also originating more recent applications with great potential, like laser cladding and rapid prototyping. Lower power densities are sucient for processes like laser hardening and laser forming, and the extremely high power densities achieved by pulsed lasers have made possible the micromachining of materials by direct ablation of its surface. In Fig. 2.1 are represented the dierent eects and window processes for several applications, depending on the laser irradiance and interaction time.
2.1.2 Development of the Laser
The rst laser was created in 1960 by Theodore Maiman [26]. It consisted of a pink ruby cylinder 1 cm in diameter and 2 cm long, which had both ends polished at and parallel, and coated with silver. One hole of 1 mm in diameter at one end allowed the light to scape. The ruby was mounted on the axis of a helical xenon ashlamp, contained in a polished aluminium cylinder. It was a pulsed laser that produced red light.
6 Chapter 2. Light In Materials Processing
Figure 2.1: Eects and applications of lasers under various operating conditions (from [1])
It is remarkable that most of the laser types used today were invented in the decade of the 1960s. However most of them were not ready for the industrial use until next decades. By December 1960 Ali Javan and coworkers [27] created a gas laser: a continuous wave (CW) He-Ne. Kumar Patel developed in 1964 [28] another gas laser, a CW CO2 laser. By September 1962 Gunther Fenner [29] created the rst semiconductor laser, made from gallium arsenide (GaAs). The rst neodymium yttrium aluminium garnet (Nd:YAG) laser was developed in 1964 by Geusic and coworkers [30], being a pulsed laser. Metal vapours were investigated leading to the creation of the copper vapour laser in 1965 by William Walter and coworkers [31]. Liquid lasers or dye lasers, which allow the production of tunable laser radiation, were rst demonstrated on February 1966 by Peter Sorokin and John Lankard [32].
The rst techniques to modulate the laser output were also demonstrated during that period. The principles of Q-switching, which allow pulses of nanoseconds (10−9 s), were presented in 1962 by McClung and Hellwarth [33]. Two years later, in 1964, the mode-locking was presented by Hargrove and coworkers [34], allowing pulses in the order of picoseconds (10−12s) or femtoseconds (10−15 s).
2.1.3 History of Laser Materials Processing
The rst laser industrial applications date from the the same decade in which lasers were created, the 1960s. It took little time to realize the potential applications of laser in the eld of materials processing. Laser welds in conduction mode in 0.25 mm stainless steel foils were made around 1963 [35]. Wires and circuit boards were joined afterwards [36]. Diamond wire-drawing dies were drilled in 1965 [37]. All of these initial applications employed ruby lasers. Carbon dioxide lasers were rst used to perform cutting in 1967 [38]. Heat treating was studied in the early 60s [39]. Surface melting and alloying were investigated in 1963 [40]. At the end of the decade laser shock hardening was demonstrated [41].
2.2. Absorption of Laser Light 7
[43]. The blown powder laser cladding process was patented on 1981 by Rolls-Royce [44], for producing hardfaced surfaces on aeroengine turbine blades. Rapid prototyping techniques were pioneered by C.R. Deckard who patented a method of selective laser sintering in 1987 [45].
Improvements in laser systems result in new generations of multikilowatt CW lasers, mainly CO2, Nd:YAG and diode lasers. Computer numerically controlled axis and afterwards robotic arms helped with the industrial establishment of lasers. Research was spread also to other areas, like the monitoring of signals emitted during laser processing, allowing real time control of some process parameters in order to maintain constant certain process variables, like temperature, by means of closed-loop feedback control systems.
2.2 Absorption of Laser Light
The absorption of laser light in the surface of a material is governed by Fresnel absorption, which depends on the polarization and angle of incidence of the laser light [46]. In metals the absorptivity consists of the contribution of a series of terms [47] which can be dependent on the intrinsic properties of the metal or the external surface. The intrinsic term includes the eect of the normal (Drude) absorption, anomalous skin eect and interband transitions. The external term contains the eect of the surface roughness, oxides and impurities.
When the laser irradiates the surface of a metal the photons interact predominantly with the free electrons in the conduction band. A fraction of these photons are reected, the rest are absorbed accelerating the electrons of the conduction band, transforming the kinetic energy into heat through successive collisions between electrons and lattice phonons [48], and transmitting the energy through the structure by normal diusion processes before reaching an equilibrium state through relaxation process, which in metals is of the order of 10−13s [49]. The resultant absorptivity is dependent on the wavelength of the light, increasing with the decreasing wavelength of the laser radiation.
The surface of the materials usually has a characteristic roughness, resulting in multiple reections that involve multiple absorption events. Besides it is covered with oxides which can absorb the radiation, create multiple reections or wave guide it [50, 51]. Therefore the absorption process is very dicult to simulate and the best way to establish the absorptivity of a material is by direct measurement. The absorptivity is the key parameter for modelling the laser absorption in the thermal simulation of laser surface treatments.
The absorption coecient shows an increase with the temperature (Fig. 2.2a), however for wavelengths of 1 µm the change is usually small until the onset of the melting of the material.
In that point the absorption coecient increases abruptly. In case of the use of a coating to increase the absorptivity of the surface, the absorption coecient usually diminishes with the temperature due to the vaporization of the coating product, dropping at the melting temperature of the alloy to the value without coating.
The wavelength of the laser light also has an important eect on the absorption coecient. Shorter wavelengths like the emitted by Nd:YAG lasers (1064 nm) or diode lasers (810 nm) are less reected by metals (Fig. 2.2b) than the CO2 wavelength (10.6µm). On the other hand, the
CO2 wavelength is optimum for the laser processing of organic materials.
8 Chapter 2. Light In Materials Processing
(a) (b)
Figure 2.2: (a) Eect of temperature on laser light absorptivity (from [2]). (b) Reectivity as a function of wavelength for various materials (from [3]).
and the absorption takes place in a layer of the order of tens of nanometers. Therefore the laser can be considered as a plane source in most of the numerical models. However, in deep penetration (keyhole) welding, and blown powder laser cladding it is usually modelled as a volumetric source because, in the rst case, the laser penetrates inside the material by creating a vapour cavity, and in the second case the laser interacts with the blown powder melting it.
Chapter 3
State Of The Art
If I have seen further than others, it is by standing upon the shoulders of giants. Sir Isaac Newton.
Abstract: This chapter gives an overview of three techniques that share many similarities in their way to be modelled during a thermomechanical analysis: laser transformation hardening, laser welding and laser cladding, as well as a bibilographical review of the published material regarding the numerical modelling of these techniques. The time frame of the review spans to the year 2010.
3.1 Laser Transformation Hardening
3.1.1 Introduction to Laser Transformation Hardening
Laser Transformation Hardening (LTH) is an advanced heat treatment process used to obtain hard wear resistant surfaces without aecting the bulk material. Compared with conventional hardening methods as ame, induction and especially case hardening, LTH has several advantages: low thermal distortion, adaptability to the component geometry, good controllability of the laser power, easy automation, etc. [55]. For these reasons it is becoming the optimal technological solution for the surface treatment of small or complex components.
The process does not involve melting, the transformations occur in the solid state. The hardness of the martensite formed when steel is heat treated enhances the wear resistance of the surface. Examples of components that are hardened by LTH include wear tracks for power steering housing, camshafts, automobile valve guides and seats, gear teeth, diesel cylinder liner bores, surface hardening of cylinder head units in aluminum car engines, hard-facing of car distribution shafts and surface hardening of mill rollers [56].
In some cases costly post-hardening operations like honing, can be avoided with LTH [57]. Furthermore, the compressive stresses in the hardened zone due to the martensitic transformation enhance fatigue strength; De la Cruz et al. [58] measured an increase in the fatigue limit of smooth and notched B-Mn steel specimens of 18% and 56% respectively. D. Pantelis et al. [59]
10 Chapter 3. State Of The Art
Figure 3.1: LTH of a cylindrical workpiece at high rotational speeds (from [4])
studied laser treated samples of a structural steel CK60, showing higher corrosion resistance. Additionally, Lo et al. [60] improve the cavitation-erosion resistance of a martensitic stainless steel AISI 440C by means of LTH.
The basis of the technique is to induce a thermal cycle on the surface of the workpiece, reaching a maximum temperature high enough to transform the initial microstructure, usually composed of ferrite and pearlite, into austenite. The next part of the cycle is a fast cooling to transform the newly formed austenite into hard and resistant martensite. The main cooling mechanism is simply conduction heat transfer to the rest of the material of the workpiece, which acts as an ecient heat sink, in a process called "self-quenching". Only the surface of the workpiece is aected by the procedure whereas the core maintains its mechanical properties.
Hardness values up to 1000 HV and hardened depths of about 1.5 mm can be achieved using alloys with high hardenability. However, due to the limited spot size, when several passings are necessary to cover the surface of the workpiece, the heating eect from the last track produces a region of back-tempering in the previous one, hence reducing the hardness and constituting the major drawback of the technique. With cylindrical workpieces it is possible to distribute the energy homogeneously along an annular circumference on the surface of the treated workpiece using high rotational speeds [4], instead of the low speeds typical of LTH, generating a heating ring and overcoming the backtempering eect (Fig. 3.1). A uniformly distributed beam on non-rotating surfaces can also be achieved by rastering or scanning a nely focused beam to cover a wide area (Fig. 3.2). The process involves two vibrating mirrors to get the beam to move back and forth at a high frequency to create the required pattern [5].
3.1. Laser Transformation Hardening 11
Figure 3.2: LTH with a rastering beam (from [5])
Numerous investigations were done in an attempt to improve the process by creating analytical and numerical models to predict the temperature evolution, hardness depth, phase evolution and 3D hardness proles. Later on, stress generation was the subject of several studies.
3.1.2 Principles of Laser Transformation Hardening
The principles of LTH are similar to those of conventional hardening, though the heating and cooling cycles are much faster. Typically the austenitizing time is very short, between 0.01-1.0 s, whereas cooling rates can be as high as 107 K/s (compared with cooling rates of about 300 K/s for arc welding) [56].
The laser beam can be shaped into dierent patterns, obtaining dierent hardness proles (Fig. 3.3). The temperature must be raised above the austenitizing temperature at the desired hardened depth, but without melting the surface of the workpiece. Usually the initial microstructure is composed of ferritic-pearlitic grains. During the austenitizing stage the carbon diuses from the dissolved pearlite colonies homogenizing the carbon distribution if the temperature and time are sucient. The cooling stage is very fast producing hard martensitic structures. However, homogeneous austenite is formed only on the surface, resulting in homogeneous martensitic structures with retained austenite. In zones situated beneath, the nal microstructure is composed of inhomogeneous martensite, retained carbides, untransformed ferrite and retained austenite.
The temperatures of the phase transformation can be estimated with an equilibrium Fe-C diagram (Fig. 3.4), however the high heating rates typical of laser processes, which are in excess of 1000 K/s, shift the austenitizing temperatures above the equilibrium values. The high cooling rates also shift the martensite start temperatures below the equilibrium values.
12 Chapter 3. State Of The Art
Figure 3.3: Commom beam shapes used in LTH and their corresponding hardened proles. (a) Gaussian beam. (b) Rectangular beam. (c) Rectangular-Gaussian beam. (from [6])
oxidation, which apart from spoiling the nish of the surface, can increase the absorptivity which may result in melting. Also protects the optics from smokes and vapors during the process.
Usually the set of parameters for the treatment is xed, but with complex geometries a control system for stabilizing the temperature of the surface is required, in order to adaptively vary the parameters to prevent melting. The temperature measured by a pyrometer or simply the signal of a photodiode can be measured and input to a control loop which adjusts the power of the laser beam.
3.1.3 Thermal Models
Several researchers proposed theoretical models with the aim of establishing a relationship between laser processing parameters and temperature, which is the main variable related with the phase transformations and hardness.
3.1. Laser Transformation Hardening 13
Figure 3.4: Iron-Carbon equilibrium phase diagram
beam, reducing the problem to a 1D steady-state. Based on this work Sandven [67], and later on Gregson [68], developed 1D transient models for the fast prediction of the temperature distribution in the vicinity of a moving laser spot. Chen and Lee [69] investigated transient temperature proles during laser heating, particularly of semiconductor materials, using a circular laser beam with a Gaussian prole. They showed that when the input power is varied linearly with the scan velocity, the input energy density is maintained constant. Maier et al. [70] proposed a method for calculating temperature proles based on the integration of a superposition of Green's functions. Later on, Zubair and Chaudhry [71] developed an analytical model for the computation of temperature and heat ux distributions in a semi-innite solid when subjected to a spatially decaying, time dependent laser source. As in the analytical models only one value of thermal conductivity can be used, the problem of its variation with temperature was addressed by Isenberg and Malking [72] and Kou et al. [73].
For a detailed analysis 2D and 3D heat input models are required. 2D heat ow models with temperature dependent surface absorptivity were developed for cylindrical geometries by Kou et al. [73], Koai et al. [74] and for semi-innite bodies by Festa et al. [75, 76] using a uniform strip moving heat source, applicable also to electron beam hardening. Cline and Anthony [77] and Sanders [78] developed the rst 3D thermal models for semiinnite plates under Gaussian laser beams. Sanders based on the solutions developed by Lax [66] to create a model for a moving circular disc with a Gaussian distribution. Kou et al. [79] also presented a 3D heat ow model using the nite dierence method and compared the predictions with the experiments conducted on AISI 1018 steel with a 15 kW CO2 laser, using a square laser prole at dierent beam powers and scanning speeds. Wang et al. [80] simulated temperature elds in LTH using the commercial FEM software MSC.Marc, and analyze the eect of the energy density. Sowdari and Majumdar [81] using a 3D enthalpy based FEM model in the commercial FEM software ANSYS studied the temperature distribution of laser irradiated metals during heating and melting processes.
14 Chapter 3. State Of The Art
(a) (b)
Figure 3.5: Experimentally determined and calculated volume fraction of martensite for TAmax=850 and 1150oC and dierent heating rates at cooling rate of: (a) 1000 K/s and (b)
3000 K/s (from [7])
and Hou [82] developed a general analytical thermal model (transient as well as quasi-steady state) using a disk heat source with a pseudo-Gaussian heat intensity distribution, and applied it for the hardening of gears, taking into account the special geometrical boundary conditions. Yáñez et al. [83] developed a 3D transient thermal model based on the commercial FEM software ANSYS and applied it to a ring of AISI 420 martensitic stainless steel. They pointed out the necessity of decreasing the laser power during the following passes of the helical laser trajectory, in order to maintain the maximum temperature and obtain a homogenous treatment.
Pulsed laser heating was studied by Yilbas [84], who developed an analytical formulation for the unsteady analysis of this problem, showing that the conditions for thermal integration to occur require a minimum pulse rate of 100 KHz.
3.1.4 Phase Transformations and Hardness
Ashby and Easterling [22] and Li et al. [85] developed phase transformation models for steels in normalized condition and examined the eect of several process variables in the hardened depth. They used the thermal analysis to obtain the temperature proles and apply the kinetic equations describing the microstructural changes. Later on, this model was extended by Shercli and Ashby [86] using dimensional relationships between various process variables to create processing diagrams in order to determine the case depth for Gaussian and rectangular laser sources. Both models constitute the basis for numerous subsequent investigations from many researchers.
3.1. Laser Transformation Hardening 15
(a) (b)
Figure 3.6: Comparison of predicted case depth from thermal-kinetic modelling with experimental measures, with respect to energy density variation under: (a) constant speed; (b) constant power (from [8])
16 Chapter 3. State Of The Art
Figure 3.7: Commom shapes of hardened zone after LTH with pulsed beam (from [9])
Other eects and possibilities were also explored in laser hardening. The inuence of the initial microstructure prior to the LTH was addressed by Shiue and Chen [98], who studied the microstructural evolution of a tempered AISI 430 steel at dierent temperatures, using a simple mathematical model based on the work of Ashby and Easterling [22]. The eects of using non-uniform beam energy distributions were studied by Galantucci and Tricario [99] in the laser hardening of carbon steels, using a transient numerical model based on the nite element method. Also Leung et al. [100] derived an exact solution for modelling the moving-interface heat transfer of LTH with a beam customized to a at-top rectangular shape, taking into account the latent heat and using IT and CCT diagrams for phase evolution. Pulsed laser hardening was analyzed by Wu et al. [9] who presented a numerical investigation by means of a 3D FEM model which includes multiphase transformations. They studied the inuence of temporal pulse shape on the maximum surface temperatures and connectivity of hardened zone (Fig. 3.7).
Laser surface melt hardening was investigated by Grum and Sturm [101] who developed a thermal analytical model based on the work of Ashby and Easterling [22] and Gregson [68], and applied it to gray and nodular irons, comparing the results with experimental measurements. Roy and Manna [102] study the localized melting around graphite nodules during LTH of austempered ductile iron. They applied the equations given by Ashby and Easterling [22] for the calculation of the temperature prole, and subsequently use a carbon diusion equation, obtaining a hardness depth linearly proportional to the laser power.
3.1.5 Back-Tempering
Many studies have been carried out to model the LTH process and improve the understanding of the underlying physics. Coupled thermo-kinetic models for the carbon diusion during austenization and the subsequent simulation of the martensitic transformation, allow the prediction of hardness proles after the treatment. However the eect of back tempering in multitrack LTH is not included in these models.
3.1. Laser Transformation Hardening 17
(a)
(b)
Figure 3.8: Cross section plots in laser hardened tracks including the eect of back-tempering: (a) phases; (b) hardness (from [10])
like the ε-carbide, cementite and alloy carbides, leading to a nal microstructure composed of
ferrite and ne globular carbides dispersed. Additionally, if retained austenite is present it is also transformed during the process.
Back-tempering is produced by the temperature increase in the previous tracks due to the heat deposited during the last track, causing non-uniform hardness proles. Lakhar et al. [10] modied a tempering model developed by Zhang et al. [103] which describes tempering as a solid phase transformation governed by the Johnson-Mehl-Avrami diusion kinetic law. They combined this model with existing models of thermal behaviour and phase change kinetics, developed earlier by its group, to predict phase transformations (Fig. 3.8a) and three-dimensional hardness proles after multi-track LTH (Fig. 3.8b), validating the model with hardness measurements (Fig. 3.9).
18 Chapter 3. State Of The Art
Figure 3.9: Predicted and measured hardness prole along the width of the sample for a two pass LTH process including the eect of back-tempering (from [10])
3.1.6 Mechanical Models
Thermal stresses are caused by the uneven thermal distribution on the workpiece. Phase transformations have an important eect on the stresses developed, so the stress eld can be completely dierent between materials that present phase transformations and materials without them. The austenization process reduces the specic volume, therefore lowering the compression stresses arising during the heating, whereas the martensitic transformation increases the specic volume, creating compression stresses that counteract the tensile stresses developed during the cooling stage.
Li and Easterling [11] developed a simple analytical model for the calculation of the residual stresses. They analysed the magnitude of the stresses as a function of the carbon content of the steel and the laser input energy applied (Fig. 3.10). Bokota and Iskierta [107, 108] proposed a mathematical model for the thermal eld calculation and phase transformations based on the diusion-convection equation solved by a suitable superposition of Green's functions, originally proposed by Maier et al. [70]. The phase transformations were described using TTT diagrams. The stresses were calculated by means of a numerical model which includes isotropic hardening for the plastic ow. However the model allows the calculation of the longitudinal stresses only, which limits its use to slender elements. Grevey et al. [109] proposed a simple analytical method for the estimation of the residual stresses on low alloy and medium alloy steels. The authors based on the known expected residual stress prole and divided the depth in three zones. Zones I and II have compressive stresses and zone III have tensile stresses, proposing equations for the calculation of the transition between zones.
3.1. Laser Transformation Hardening 19
(a)
(b)
Figure 3.10: Predicted longitudinal residual stresses (in the laser moving direction) below surface as a function of depth below surface for: (a) dierent carbon contents; (b) dierent laser input energy for a 0.44% C steel (from [11])
20 Chapter 3. State Of The Art
(a)
(b)
Figure 3.11: Predicted longitudinal residual stresses (in the laser moving direction) below surface as a function of depth below surface for: (a) dierent carbon contents; (b) dierent laser input energy for a 0.44% C steel (from [11])
3.2. Laser Welding 21
Figure 3.12: Predicted and measured hardness prole along the width of the sample for a two pass LTH process including the eect of back-tempering (from [12])
to tensile in the hardened zone if they are not considered, although the stress prole in the rest of the depth is the same. They also found that including TRIP has a minor eect on the stresses (Fig. 3.12).
3.2 Laser Welding
Laser welding is a high energy density welding process, capable of deep penetration and small heat aected zones. As a result, it has been increasingly used in several industrial sectors such as marine, automotive, aerospace. . . for the welding of special components, materials and geometries, with the aim of reducing distortions, increase quality or produce lightweight structures [115].
A great number of process parameters, along with the material properties of the alloy been welded, inuence the characteristics and quality of the seams obtained. Numerous investigations were carried out aiming for improve the understanding of the underlying physics of the process and try to simulate the eect of some input parameters on the weld pool as well as the residual stresses and distortions arising.
In recent years hybrid laser/arc welding has received signicant attention due to its attractive advantages such as large penetration depth, high welding speed, less deformation than conventional welding processes and good bridging ability for relatively large gaps [116]. Therefore numerical models have been developed to study laser welding process, taking into account some of the main considerations in laser keyhole welding (Fig. 3.13).
3.2.1 Numerical Modelling of Welding
22 Chapter 3. State Of The Art
Figure 3.13: Overview of the main considerations in laser keyhole welding (from [13])
be estimated in excess of a thousand. Only some important features developed for conventional welding, and applicable to laser welding and even laser cladding, will be briey discussed in this chapter. The rest of the review is focused exclusively on laser welding models.
Analytical equations based on the Rosenthal's solution [117, 48] may give suciently accurate calculations far from the welding point, but numerical simulations are needed for an accurate description of the process. The temperature eld can be calculated prescribing a certain temperature at the boundary of the weld pool, and then removing this load and computing the resulting temperature eld, as done by Goldak et al. [118]. Jones et al. [119, 120] dened the temperature of the weld pool as the liquidus temperature of the alloy. Roelens et al. [121, 122] and Lindgren et al. [123] prescribed the temperature in case of multipass welds. Other approach is the calculation of the temperature eld using a heat ux as surface or volumetric thermal load. Goldak et al. [124] proposed the so-called double ellipsoid heat source, which is a more accurate representation of the heat ux. The double ellipsoid is used in many papers.
3.2. Laser Welding 23
Figure 3.14: Plastic zones during welding. The dashed lines correspond to the line of maximum temperatures (from [14])
The modelling of the plastic behaviour of the materials is fundamental due to the high temperatures of the process which create signicant plastic strains. The choice of a certain material model inuences the nal residual stresses. Due to the relatively short time the material spends at high temperatures, rate dependent plasticity is usually neglected [132]. The material suers stress reversal between the heating and cooling stages (Fig. 3.14), thus the choice of isotropic or kinematic hardening could have some eect on the nal stress state. However Devaux et al. [133] studied weld repairs with up to 6 beads and found only small dierences. Most of the models use isotropic hardening, some kinematic hardening and a few used combined isotropic-kinematic hardening. However the most important problem is the lack of material property data at high temperatures.
3.2.2 Thermal Models
During 30 years mathematical and numerical CFD models of growing complexity were developed for the detailed study of keyhole dynamics in deep penetration welding. Steady state models were rst considered due to computer limitations, although their satisfactory results in predicting temperatures and keyhole shapes make them still useful today. However 3D transient models allow a detailed simulation of the complete process and dynamic eects such as humping, pore formation and also the keyhole formation.
24 Chapter 3. State Of The Art
studied the keyhole wall dynamics during laser welding, assuming that only the frontal keyhole wall is exposed to the laser beam. Later on Semak et al. [139] improved the model for a transient simulation of the process. They emphasized the importance of recoil-pressure-induced melt ejection in weld pool energy balance, and calculated the keyhole wall velocity for various processing parameters obtaining variations with them. When the keyhole velocity is greater than the beam translation velocity, their model predicted that the frontal keyhole wall has a steplike prole, leading to the formation of humps. Solana and Ocaña [140] presented a 3D nite dierence model to determine the weld pool geometry, including ablation losses and evaporation eects in the energy and pressure balances but neglecting uid ow. Their model predicts the temperature eld, electronic density, degree of ionization and absorption coecient within the plasma, as well as maximum penetration depth. Sudnik et al. [141, 142] presented models with similar capabilities, including a semiempirical approach to model uid ow in a simplied way. Models which include a keyhole with parallel walls in the geometry were presented by Brüggemann et al. [143], who used a 2D model but without including some factors as Marangoni and natural convection, and Mahrle and Schmidt [144] who used a 3D model to investigate the inuence of dierent uid dynamic conditions in the weld pool shape and temperature distribution in deep penetration welding.
Thermocapillary ow or Marangoni convection has a fundamental role in the melted uid ow and heat transport, therefore it is included in all the following CFD models. Ye and Chen [145] developed 2D and 3D steady state models based on nite volumes, and studied the eect of welding velocity, Marangoni convection and natural convection, pointing out the unsatisfactory results obtained with 2D models. Du et al. [146] presented a 3D model based on nite dierences to study the full penetration laser welding for titanium alloys. They discussed the eect of Marangoni convection in the molten metal uid ow, and the typical hourglass shape of the weld pool. Wang et al. [147] developed a 3D steady state model using the control volume method with a rotary Gaussian volumetric heat source plus a double ellipsoid heat source. Abderrazak et al. [148] presented a 3D transient nite volume model for FLUENT. They use a double ellipsoid heat source to study the eect of several parameters on the weld pool formation in keyhole laser welding of AZ91 magnesium alloy sheets. Tobar et al. [149] developed a 3D steady state model, to study conduction welding of aluminium alloys using CFX. They determined that the ow is primarily driven by Marangoni convection instead of buoyancy.
3.2. Laser Welding 25
(a)
(b)
Figure 3.15: Fluid dynamics of the melt pool during laser beam deep penetration welding of stainless steel: (a) vertical view; (b) horizontal view. Laser power: 3 kW; wavelength: 10.6 µm;
beam radius: 200 µm; prole: Gaussian; feed rate: 6 m/min (from [13])
to reduce computation time. Latent heats, vaporization, recoil pressure and droplet ejection are included in the model. They calculated the beam propagation with COMSOL Multiphysics as a stationary diusion problem until the rst reection, and then coupled it with raytracing procedures. Koch et al. [153] also studied the eect of wavelength dependent Fresnel absorption with this model, simulating CO2 and Yb:YAG lasers.
Other researches in laser welding carried out with CFD models focus on dierent topics apart from keyhole welding. Loredo et al. [154] developed a 3D nite volume model for the optimization of the lap pulsed laser welding of zinc-coated sheets, due to the zinc low boiling point (1180 K), which is lower than the steel melting point (1800 K) and produces a violent boiling during the process. They optimized the parameters for ablate the zinc in one spot and generate the keyhole in the next. Medale et al. [155] developed a model for studying a single laser pulse in laser spot welding. They considered uid ow, thermo-capillary, evaporation-recoil pressure and multiple reections in the keyhole by raytracing. Gatzen and Tang [156] presented a 3D steady state model to study laser welding of aluminium under the inuence of a coaxial magnetic eld, using CFX. They created the geometry with a predened keyhole shape, and obtained signicant eects due to the magnetic eld in the upper part of the melt pool. Chakraborty [157] developed a 3D model for laser welding in conduction mode of two dissimilar metals: copper and nickel. Their model included a turbulent k-εmodel, which showed a better correlation with experimental tests
26 Chapter 3. State Of The Art
(a)
(b)
Figure 3.16: Pore formation during laser beam deep penetration welding of stainless steel at high feed rates. Laser power: 6 kW; wavelength: 10.6µm; beam radius: 200 µm; prole: Gaussian;
feed rate: 12 m/min (from [13])
3.2. Laser Welding 27
to perform simulations of pulsed welding in ANSYS. Bag et al. [165] developed an axisymmetric FEM model for laser spot welding, neglecting uid ow and using an adaptive volumetric heat source, which is dened adaptively as the size of the weld pool grows.
3.2.3 Mechanical Models
The mechanical models are based on the nite element method, most of them use commercial codes as platforms for their simulations. Plasticity is included in all the models using kinematic or isotropic hardening laws in most of cases. Carmignani et al. [166] used ABAQUS to model deep penetration welding of thick steel plates. They employed a volumetric heat source and included an elastoviscoplastic material model into a user routine. Moraitis and Labeas [167] developed a 3D FEM transient model in ANSYS. They rst predicted the keyhole shape by considering a Gaussian surface heat source but deactivating the vaporized elements and applying the laser power to the surface of the elements below, forming the keyhole. They used this information to apply a conical volumetric heat source in the thermomechanical analysis of the lap-joint of 6061-T6 aluminium plates, using a kinematic strain hardening law. 3D Models for the laser welding of aluminium alloys, using ABAQUS and a conical Gaussian heat source, were developed by Spina et al. [168] and Zain-ul-abdein et al. [169], assuming an isotropic hardening behavior. For the laser welding of the titanium alloy Ti6Al4V Chuan et al. [170] presented a 3D model using a uniform conical heat source, and discussed the eect of the mesh size and boundary conditions. Montalvo-Urquizo et al. [14] developed a 3D transient model based on the Adaptive-FEM toolbox ALBERTA. They used dierent error estimators for the thermal and mechanical uncoupled problems, to control mesh adaption and maintain low computation times. The thermal model is based on the energy balance, assuming the keyhole shape and taking the temperature inside the keyhole as the evaporation temperature of the material. Deng and Kiyoshima [171] studied the eect of residual stresses present in stainless steel pipes prior to the laser welding process. They used an empirical based volumetric heat source and assumed isotropic hardening law. They found a signicant contribution of the initial residual stresses to the nal stress state, however they pointed out that this cannot be directly extrapolated to other welding geometries apart from pipes.
The eect of phase transformations is included in some studies but is neglected in the rest or simply not necessary due to the use of materials that do not present phase changes during the process. Grignon et al. [172] studied the laser welding process of steels using SYSWELD, calculating temperatures, phase proportions, strains and stresses and compared them with some experimental investigations. Tsirkas et al. [173] developed a 3D model for SYSWELD to simulate the keyhole welding of butt-joint thick steel plates using dierent welding parameters. They modeled the heat ux distribution as a volumetric conical heat source, and include the eect of phase transformations.
28 Chapter 3. State Of The Art
Figure 3.17: Von Mises equivalent stress during hybrid laser-GTAW welding (from [15])
stresses with the hybrid method than with the GTAW or laser alone.
Several mechanical models explore laser spot welding. Kang et al. [176] and Chang and Na [177] studied the weldment distortion in laser spot welding of an electronic component using ABAQUS, in order to minimize the residual distortions after the process. Kemal Apalak et al. [178] developed a model to study stresses in adhesively bonded laser-spot welded single lap joints of several metals. They calculated the non-uniform temperature distributions in both metals and obtain the maximum stresses along the sheet interfaces. Martinson et al. [179] developed 3D transient models for laser spot welding of steel sheets, using ABAQUS. They tried dierent strategies for the welds: ring welds, C-welds and Brezel. Their model includes a conical Gaussian heat source, an isotropic hardening model but they ignored the phase transformations during the process.
3.3 Laser Cladding
3.3.1 Introduction to Laser Cladding
3.3. Laser Cladding 29
by this technique. New applications of laser cladding are the rapid tooling and rapid prototyping techniques [182] for the fabrication of pore free complex components and tools with excellent mechanical properties.
Several methods for laser cladding have been developed [181]. However, the blown powder method by a coaxial laser cladding nozzle has demonstrated superior exibility and quality over the rest of the methods, and therefore most of the studies and applications are focused on this method.
The stresses generated during the process are one of the fundamental concerns in this technique. They arise due to the high thermal gradients involved in the process, and the mismatch in material properties between the overlay alloy and substrate, leading to unacceptable distortions in the workpiece or even the appearance of cracks and delamination.
Because of the complexity of the process and the large number of parameters involved, numerical models have been developed to study the thermal and mechanical elds, some of them coupled with metallurgical phase transformation models. Other studies were focused on the blown powder distribution and heating after exiting the nozzle, or the prediction of the clad bead shape.
3.3.2 Thermal Models
The rst model of laser cladding is the pioneering work of Weerasinghe and Steen [183] in the early 1980's. They calculated the laser induced temperature eld by means of 3D nite dierence methods and estimated the required process parameter values using empirical relations, considering also the laser beam attenuation caused by its interaction with the metal powder. Kar and Mazumder [184, 185] and Agrawal et al. [186] solved the one-dimensional heat and mass transfer equations for binary systems in order to calculate the solid solution that is formed by fast cooling process in laser cladding. They also carried out parametric studies correlating several process variables.
30 Chapter 3. State Of The Art
Figure 3.18: Temperature distribution (in Kelvin) at t=20 s for a multistep laser pulse energy (from [16])
convection, addition of powder particles and phase changes. They used it to study the inuence of several input parameters as well as the Marangoni number, on the laser cladding process.
![Figure 3.14: Plastic zones during welding. The dashed lines correspond to the line of maximum temperatures (from [14])](https://thumb-us.123doks.com/thumbv2/123dok_es/4002123.676505/51.892.241.640.139.406/figure-plastic-zones-welding-dashed-correspond-maximum-temperatures.webp)
![Figure 3.21: Von Mises residual stresses after the cladding process of 3 overlapped clad tracks (from [19])](https://thumb-us.123doks.com/thumbv2/123dok_es/4002123.676505/61.892.251.646.133.432/figure-mises-residual-stresses-cladding-process-overlapped-tracks.webp)


![Figure 5.10: Calculation of anisothermal growth kinetics by using Scheil's additivity principle and JMA equation (from [23]).](https://thumb-us.123doks.com/thumbv2/123dok_es/4002123.676505/91.892.126.764.149.441/figure-calculation-anisothermal-kinetics-scheil-additivity-principle-equation.webp)