UNIVERSIDAD DE VALLADOLID
ESCUELA DE INGENIERIAS INDUSTRIALES
GRADO EN INGENIERÍA QUÍMICA
Pressurized liquid extraction of
anthocyanins from grape skin
Autor:
de la Cruz Alzaga, Sandra
Responsable de Intercambio en la Uva:
Cocero, María José
BUDAPEST UNIVERSITY OF TECHNOLOGY AND ECONOMICS
FACULTY OF CHEMICAL TECHNOLOGY AND BIOTECHNOLOGY
TFG REALIZADO EN PROGRAMA DE INTERCAMBIO
TÍTULO:
Pressurized liquid extraction of anthocyanins from grape skin
ALUMNO:
Sandra de la Cruz Alzaga
FECHA:
21 de Junio de 2018
CENTRO:
Budapest University of Technology and Economics. Faculty of Chemical
Technology and Biotechnology
RESUMEN
La extracción a alta presión ha demostrado ser un buen método para extraer
compuestos de la piel de la uva. La tasa de extracción depende de la temperatura,
obteniendo valores más altos a mayores temperaturas. Los máximos extraidos varían
también en función del disolvente empleado. Agua y agua-etanol se usan como
disolventes. La concentración de antocianinas monoméricas en el extracto se calcula
midiendo la absorbancia de las muestras a distintos valores de pH y longitudes de
onda. La temperatura es un factor determinante en la cantidad de antocianinas
obtenidas. Se estudia la relación entre la temperatura y la tasa de extracción, la
concentración de antocianinas y los índices de degradación.
ABSTRACT
The pressurized liquid extraction has proved to be a useful method for extracting compounds from grape skin. The extraction yield is influenced by the temperature, higher rates obtained at a higher temperature. The maximum extraction yield could also variate depending on the composition of the solvent. Water and water-ethanol (50%, v/v) are used as solvents. The concentration of monomeric anthocyanins in the extract has been calculated using absorbance measurements of samples with different pH at different wavelengths. The temperature proves to be a determining factor in the amount of them obtained. The relation between the temperature and the extraction yield, anthocynin concentraction and degradation indexes is studied.
PALABRAS CLAVE
Antocianinas, uva, extracción líquido presión
KEYWORDS
INDEX
1. INTRODUCTION ... 1
2. THEORETICAL BACKGROUND ... 3
2.1. Grape and grapeskin ... 3
2.2. Anthocyanins ... 5
2.3. Anthocyanins in grapeskin ... 5
2.4. Monomeric anthocyanins ... 5
2.5. Extraction methods ... 6
2.5.1. Solvent extraction ... 6
2.5.2. Microwave-assisted extraction ... 6
2.5.3. Ultrasound-assisted extraction ... 6
2.5.4. Supercritical fluid extraction ... 7
2.5.5. Ionic liquids ... 7
2.5.6. Enzyme-assisted extraction ... 7
2.6. Pressurized liquid extraction (PLE) ... 8
2.6.1. Dielectric constant ... 9
2.6.2. Effect of temperature ... 9
2.6.3. Effect of pressure ... 9
2.6.4. Instrumentation used for pressure hot water extraction ... 9
2.6.5. Extraction of bioactive compounds by pressure liquid extraction ... 11
2.7. Spectrophotometric analysis ... 11
2.7.1. Differential method ... 12
2.7.2. Subtractive method ... 12
3. INSTRUMENTATION AND METHOD ... 13
3.1. Extraction equipment ... 13
3.2. Extraction method ... 15
3.2.1. Mass Balance ... 16
3.3. Vacuum distillation ... 17
3.4. Spectrophotometer ... 17
3.5. Measurement of anthocyanines by UV-Visible spectroscopy ... 18
5.2 Extraction yield ... 22
5.3 Absorbance and monomeric anthocyanin ... 22
5.4 Colour density, pigment degradation, polymeric colour and browning ... 24
5.5 Percentage of extract and raffinate ... 25
6 RESULTS AND DISCUSSION ... 26
6.1 Dry content ... 26
6.2 Extraction yield ... 26
6.2.1 Pre-experiment for determination of solvent consumption ... 27
6.2.2 Extraction at 90°C with water ... 28
6.2.3 Extraction at 110°C with water ... 29
6.2.4 Extraction at 130°C with water ... 31
6.2.5 Extraction with water-ethanol mixture ... 32
6.2.6 Comparison of the results of PLE with water ... 37
6.3 Percentage of extract and raffinate ... 38
6.4 Anthocyanins content ... 39
6.4.1 Extraction at 90°C with water ... 40
6.4.2 Extraction at 110°C with water ... 41
6.4.3 Extraction with water-ethanol as solvent ... 43
6.4.4 Comparison of the results ... 45
6.5 Colour density, polymeric colour, percent polymeric colour, degradation, and browning ... 47
6.5.1 Extractions at 90°C ... 47
6.5.2 Extraction at 130°C ... 48
7 CONCLUSION ... 52
8 LITERATURE ... 53
9 APPENDIX ... 55
9.1 Extractions ... 55
1
1.
INTRODUCTION
The winemaking industry is one of the most important food industries. This industry produces large quantities of heterogeneous solid by-products and residues. The following figure (figure 1.1) is from a wine production study in Hungary. This statistic shows the total volume of wine produced in Hungary from 2010 to 2016. We find the higher volume produced in 2015, approximately three million hectolitres.
Figure 1.1: Wine production in Hungary
The main by-product of the wine industry is the pomace, this is what remains after pressing of the grapes. Pomace consists of skins, seeds and stems. This part represents about 20% of the weight of the processed grapes. Also, pomace contains high levels of polyphenols, substances with antioxidant properties. Polyphenols are not desired for the use as animal feed or for composting. On the other side, pomace is interesting for using it in production of functional foods, dietary supplements, cosmetic industry, and the pharmaceuticals.
Grape skin has component that can be useful, like anthocyanins. Anthocyanins can be found in the cells of all vegetative organs. They are responsible for the colour of many fruits and vegetables. Among them we find the grape, and therefore wine. Anthocyanins extracted from grape skin are the principal compounds involved in the colour of red wines and their interactions with other phenolic compounds (called copigments), normally colourless, allow improving the colour stabilization of aged wines by copigmentation reactions. [1] Anthocyanins are being considered as replacements for the banned synthetic dyes. For this purpose, anthocyanins have the following advantages: [2]
• They have been consumed as part of the human diet many years without suffering any adverse effects to health.
• They are brightly coloured, especially in the red region of the spectrum.
2
Moreover, recent studies show anthocyanins have health benefits: • Reduction of coronary heart disease. [3]
• Improved visual acuity. [4] • Antioxidant activities. [5] • Anticancer activities. [6] But they also have disadvantages:
• Their tinctorial power and stability in foods are generally low by comparison with coal tar dyes.
• The colour instability is a limitation in the use of anthocyanins as natural food colorants.
• The temperature, the presence of oxygen and light, co-pigmentation, metal ions, the pH value are the major degradation factors of the anthocyanins.
Acylation, glycosylation and condensation with different flavonoids improves the stability of the anthocyanins. [7]
The main goal of this project is to obtain biological compounds, mainly anthocyanins, from grape skin and find out the best extraction method. Among the obtention methods that can be used, the extraction is done in a high-pressure column using different solvents and operating conditions. The operation pressure is set in 50 bars and the temperature varies between 90oC and 130oC. The solvents used are water and a mixture of water an ethanol 50:50 (v/v).
Once the extract is collected from the column it is analysed using a spectrophotometer. By using different wavelengths and buffers, it is possible to measure:
• Monomeric anthocyanins. • Colour density.
3
2.
THEORETICAL BACKGROUND
2.1. Grape and grapeskin
One of the most common sources of natural colourants for food use is anthocyanin extracts from grape skins, a by-product of the wine industry. As a result, grape residues have been extensively studied in an attempt to provide an alternative supply of natural colourants. The difference between this and other colorants is that grape is a natural product that doesn´t harm the human body, while other colorants are not so beneficial. [8]
Grapes has not only anthocyanins but many components. We can divide the grape in skin, pulp and seeds. Each part is rich in some kind of components, for example, the skin is rich in pigments, tannins, aromatic substances and minerals (like potassium).
We can find in grapes: [9]
Sugars are a large amount of the soluble solids, especially glucose and fructose. In the juice of grape there is a sugar concentration between 150 to 250 g/L. The riper the grape is, the more it exceeds the concentration of fructose to the glucose. Glucose and fructose are fermentable sugars.
• Aromatic substances
Grapes contain numerous volatile odorous compounds, especially in the skin and the cells beneath it. Their concentration is higher if the grape is ripe.
• Organic acids
4 • Phenolic compounds
These compounds are also abundant in grape, following sugars and acids. They are structurally diverse and have a great importance in determining the wine's colour and flavour. They are involved in browning reactions in grapes and wines. The two main substances included in this group of compounds are anthocyanins and tannins.
o Anthocyanins: pigments responsible for the red and purple colour of grapes and wines.
o Tannins: complex compounds with a molecular weight over 500 that are also astringent and bitter. They are biomolecules that can precipitate proteins and other organic compounds. [10]
• Nitrogenous compounds
Grapes contains ammonium cations and organic nitrogenous compounds: such as amino acids, peptides, and proteins.
• Minerals
The important mineral compounds include: potassium, sodium, iron, phosphates, sulphate, and chloride. Of these mineral compounds potassium is the most important mineral. During ripening, the potassium content of the grape increases.
• Pectic substances
Pectic substances are complex polysaccharides made of polymerised galacturonic acid molecules. When the grapes ripe, pectin is hydrolysed by pectolytic enzymes.
• Antioxidants
Antioxidants are molecules that inhibits the oxidation of others. The oxidation is a chemical reaction, it produces free radicals and causes damage to the cells. According to their solubility in water, we can difference two kinds of antioxidants: [11]
o Lipophilic antioxidants: vitamin A, vitamin D, vitamin E and vitamin K. o Hydrophilic antioxidants: vitamin B complex and vitamin C.
5 2.2. Anthocyanins
Anthocyanins are to be found in the vacuoles of almost every cell type in all vegetative organs. Plants also show tremendous diversity in anthocyanin expression. In leaves, for example, anthocyanins may colour the entire blade, but they can also be only in the margins, stripes, patches, or seemingly random spots on the upper, lower or both lamina surfaces. Given this enormous variation in location, timing, and inducibility of anthocyanins in vegetative tissues, it is not surprising that there is not a unified explanation for the presence of these pigments. Anthocyanins are responsible for some of the most spectacular natural colours. The term anthocyanin, derived from the Greek words for flower and blue, was used first by Marquart in 1835 to designate the blue pigments of flowers. It was later realized that not only the blue colour, but also the purple, violet, magenta, (in fact many of the colours appearing on flowers, fruits, leaves, stems, and roots) are attributable to pigments chemically similar to the original blue pigment. [12] [13]
2.3. Anthocyanins in grapeskin
The anthocyanin types present in grapes have been reported in numerous papers, with the dominant pigment being peonidin 3-O-glucoside. Other pigments present are cyanidin-, petunidin-, malvidin- and delphinidin-3-O-glucosides. Other studies determined that the principal anthocyanins found corresponded to cyanidin-3-O-glucopyranoside and peonidin-3-O-glucopyranoside. These pigments are also present in the intact plant. These differences show that the anthocyanin type produced from grape can be influenced by environmental conditions and that it is possible to change the anthocyanin composition of grape through careful selection and purification of species. [14]
2.4. Monomeric anthocyanins
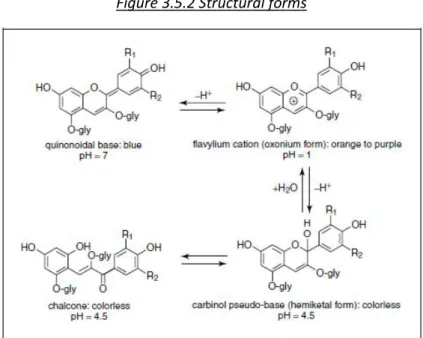
Among the anthocyanins we can find monomeric forms. These pigments undergo structural transformations when pH changes.
The two different forms we find are:
6 2.5. Extraction methods [15]
Plants have bioactive metabolites, these components have therapeutic properties but they appear in a very low concentration. This means it is really important to develop an extraction method that obtains elevated yields of extraction and does not damage the component. The damage may be caused by the heat because of the thermolability of the active molecules. [12] In an extraction, the target compound is removed from the substance due to a diffusion towards the extraction phase to be finally collected. Although the method used was pressurized liquid extraction, there are many other ways to extract the target compounds, the following ones are the most important.
2.5.1. Solvent extraction
There are a large number of inorganic, organic, polar and non-polar solvents that can be used to perform a suitable extraction. They can also be combined to obtain better results. We use polar or apolar solvents depending on the substance of our interest:
• Lipophilic: nonpolar organic solvents, like hexane and n-pentane. They are used, for example, to extract alkaloids, coumarins, fatty acids (FAs), flavonoids and terpenoids. • Hydrophilic: polar solventswhich may be non-protic such as acetone, or protic such as
ethanol, methanol or even water. They are used, for example, to extract flavonols, lectins, alkaloids, flavones, polyphenols, tannins and saponins.
The main advantage of this type of extraction is that it is done with simple equipment and it is not expensive.
2.5.2. Microwave-assisted extraction
Microwave-assisted extraction (MAE) is an extractive method based on the utilization of microwave energy that is produced when the perpendicular oscillation between the electric and the magnetic fields generates electromagnetic radiations with a frequency ranging from 0.3 to 300 GHz. If the microwave goes through and interacts with a substance there is a production of heat whose intensity depends on the absorption of the energy by the material and the dissipation of the resulting heat.
The main advantage of this kind of extraction are the high yields. It takes short time, but it is also less eco friendly and not suitable for thermolabile compounds.
2.5.3. Ultrasound-assisted extraction
7
It is interesting because of the great yields that are obtained. It is less expensive than the traditional extractive techniques, it can give high quantities of products in fewer time and with not much solvent.
2.5.4. Supercritical fluid extraction
Supercritical fluid extraction (SFE) is a quite new technique especially used for the recovery of essential oil from plants. SFE is based on the use of carbon dioxide in supercritical phase because CO2 in this state has a polarity similar to pentane and hexane so is good for lipophilic compounds extraction.
The main advantages of supercritical CO2 are that it is non-toxic, non-flammable, not expensive, and easy to remove in the end of the process (eco-friendly). It is a good choice with thermolabile compounds because it is possible to obtain a high yield operating at low temperatures.
If the components to extract are polar, a cosolvent like water or ethanol in a little percentage (5-10%) is needed to increase the extraction quantity. When in the plant matrix there are bioactive compounds of different solubility, a method to improve the recovery of all the phytotherapeutics without any loss is the fractionation of the extract. Two strategies could be applied: the multi-step fractionation and the on-line fractionation.
2.5.5. Ionic liquids
The ionic liquid (IL) has many advantages in terms of quality and efficacy of extraction. An IL is a liquid organic that selectively interacts with specific polar and non-polar compounds thanks to ion-exchanges, π-stacking interactions, hydrophobic interactions or hydrogen bonds, improving the selectivity of the extractive method. Ionic liquids enhance the extraction efficiency of other solvents, so they can be used in microwaved-assisted extraction (MAE) and ultrasound-assisted extraction (UAE)
2.5.6. Enzyme-assisted extraction
8 2.6. Pressurized liquid extraction (PLE)
Pressurized liquid extraction (PLE or PFE in case of a general fluid) is a novel and eco-friendly technique for the recovery of bioactives from plants. This method often requires water as the solvent and so it can keep away from the environmental and health risks due to the use of organic solvents. It operates at high temperature (until 200°C) and pressure (from 35 to 200 bar). At elevated temperatures there is a reduction of the viscosity of the solvent that can better penetrate the matrix extracting the analytes of interest. The disadvantage is that PLE cannot be used for the thermally unstable compounds and it could lead to a co-extraction of other compounds because of the decreased selectivity of extraction at higher temperatures. PLE is a technique that involves extraction using liquid solvents at elevated temperature and pressure, which enhance the extraction performance as compared to those techniques done at ambient temperature and atmospheric pressure. The merits of enabling the use of solvents at temperatures above their atmospheric boiling point is the enhanced solubility and mass transfer properties. Dionex Corporation first introduced PLE in 1995 at the Pittcon Conference, where it was introduced as Accelerated Solvent Extraction Technology (ASE). [16]
This technique, which involves extraction with solvents at a high pressure and temperature without their critical point being reached, has received different names, such as: [17]
• Accelerated solvent extraction (ASE). • Pressurized fluid extraction (PFE). • Pressurized liquid extraction (PLE). • Pressurized hot solvent extraction (PHSE). • High-pressure solvent extraction (HPSE).
• High-pressure, high temperature solvent extraction (HPHTSE). • Subcritical solvent extraction (SSE).
The use of these different terms may lead to confusion and here we use the term PLE, which is the most widely accepted designation, even though since 1996 the EPA has adopted the term PFE to refer to this technique. When water is employed as the extraction solvent, the authors tend to use a different name to highlight the use of this environmentally friendly solvent. Thus, terms such as:
• Subcritical water extraction (SWE). • Hot water extraction (HWE).
• Pressurized hot water extraction (PHWE). • High-temperature water extraction (HTWE). • Superheated water extraction.
• Hot liquid water extraction.
All these names can be found in literature. Nevertheless, it is important to note that although referring to the same technique, in this case water is employed instead of another organic solvent. The dramatic changes in the physical–chemical properties of water, especially in its
9
2.6.1. Dielectric constant
The dielectric constant (as a measure of the polarity of the solvent) is a key parameter in determining solute-solvent interactions, and (in the case of water) increasing the temperature under moderate pressure can significantly decrease this constant. At ambient pressure and
temperature, water is a polar solvent with a high dielectric constant (ε = 78) but at 300 °C and P = 23MPa this value decreases to 21, which is similar to the value for ethanol (ε=24 at 25°C) or acetone (ε = 20.7 at 25 °C). This means that at elevated temperatures and moderate pressures the polarity of water can be reduced considerably, and the solvent can act as if ethanol or acetone were being used. The main effect of this drop in the dielectric constant when working at elevated temperatures and pressures is that water can be used instead of another organic solvent to extract medium (or low) polarity compounds.
2.6.2. Effect of temperature
Temperature during the extraction is one of the critical factors that affect the efficiency and selectivity in PLE. The use of high temperatures improves the efficiency of the extraction as it helps the disruption interactions caused by van der Waals forces, hydrogen bonding and dipole attraction. The use of thermal energy helps to break molecule–molecule interactions and adhesive interactions between the analyte and the sample matrix, so it is a way to decrease the activation energy required for the desorption process. When increasing the temperature, the diffusivity also increases while the viscosity decreases. Furthermore, elevated temperature decreases the surface tension of the solvent, solutes and matrix and therefore enhances the solvent wetting of the sample. [16]
2.6.3. Effect of pressure
The main advantage of applying pressure during the extraction is that a temperature above the boiling point (at atmospheric pressure) can be used while the solvent maintains its liquid state. The use of elevated pressure at high temperature and reduced solvent surface tension helps to force the solvent within the matrix pore to contact the analyte and extract them. Using pressure during extraction could exert pressure on the matrix resulting in disruption, which could enhance the mass transfer of the analyte from the sample to the solvent. High pressure during the extraction controls problems related to air bubbles found within the matrix that prevent the solvent from reaching the analyte. These conditions boost the analyte solubility and desorption kinetics from the sample matrix.
2.6.4. Instrumentation used for pressure hot water extraction [18]
10
• Dynamic mode: the solvent flows through the sample in a continuous manner.
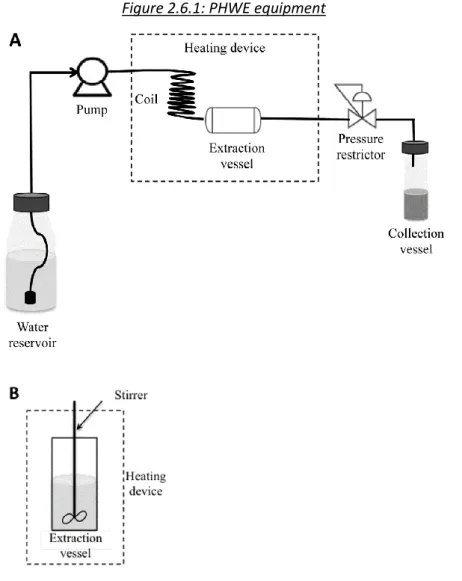
Dynamic PHWE basically needs a pump, an extraction vessel, a heating device, a pressure restrictor and a collection vial. As it is shown in the following figure (Figure 2.6.1 A) the pump delivers water to the extraction vessel, and via the pressure restrictor to the collection vial. The pump should be able to achieve the pressure necessary to keep the water in liquid state during the extraction process (normally 3.5–20 MPa). Heating of the water is by either an oven or a heat exchanger, heating tape or heating jacket. The extraction vessel is usually made of stainless steel, and should have frits at both ends in order to avoid sample losses and clogging the tubing. Pressure restriction is needed to control the pressure inside the extraction vessel and to prevent boiling-off effects of water at the exit of the extraction vessel. The pressure restrictor could be a needle valve, a backpressure regulator, a thin capillary or simply short tubing with a squeezed end providing an exit small enough to maintain an adequate pressure upstream.
Figure 2.6.1: PHWE equipment
• Static mode: sample and solvent are maintained for a user-specified time at constant pressure and temperature.
11
saturation pressure of the system. In static PHWE, convection is accomplished using a stirrer in order to speed up mass transfer. For heating, an oven, a heating jacket or heating tape is appropriate. A pressure restrictor is not needed, unless the speed of removal the extract from the vessel is to be controlled.
2.6.5. Extraction of bioactive compounds by pressure liquid extraction
There is increasing interest in ingredients of bioactive compounds from natural sources to be used in food and pharmaceutical products and in the search for native plants containing interesting bioactive compounds (for example antioxidants and anti-inflammatory compounds). PHWE (pressurized hot water extraction) is one of the most interesting techniques to obtain bioactives from plants and other complex samples, whether for analytical purposes or industry processes. The typical extraction conditions for the extraction of bioactive compounds is 100–200°C and 50–100 bar.
Optimal extraction conditions greatly vary, depending on the kind of phenolic compound to be extracted. For example, extremely labile polyphenols like anthocyanins, whose stability depends on pH and temperature, generally require a lower extraction temperature. For example, static PHWE was optimized for anthocyanins in red cabbage and red onion at 99°C, 50 bar and 7 minutes extraction time. [18]
According to other studies, the higher monomeric anthocyanin yields were achieved at the conditions in which ethanol +water or pure ethanol were used as solvents, at 60 and 80 °C in the extraction from fresh blackberries. The increase of temperature generally decreased the anthocyanin content of the extracts, a negative synergism between high temperatures and acid solvent must have contributed on the degradation of anthocyanins. This is confirmed by the ANOVA analysis, which showed a significant effect of the interaction temperature and solvent on the anthocyanin concentration. Acids at high temperatures possibly resulted in the hydrolysis of acylated components and sugar residues, inactivating the chemical structure of anthocyanins. Temperature itself is well known as a factor affecting the stability of anthocyanins, whose degradation can happen by two mechanisms:
• hydrolysis of the 3-glucoside to form the unstable aglycone.
• hydrolytic opening of the heterocyclic ring, forming chalcone, which is a colourless anthocyanin structure that, at high temperatures, is degraded into an insoluble brown-coloured phenolic compound.
In fact, the extracts obtained in this work at 80 and 100 °C had colour varying from red to brown, indicating some anthocyanin degradation. [19]
2.7. Spectrophotometric analysis
12
band. This band is far from the absorption bands of other phenolics (spectral maxima in the UV range).
However, this simple method is inappropriate because of interference from anthocyanin degradation products or melanoidins from browning reactions. In those cases, differential and subtractive methods are used to quantify anthocyanins and their degradation products.
2.7.1. Differential method
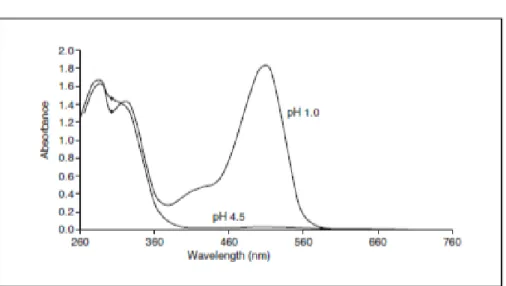
The differential method measures the absorbance at two different pH values and relies on the structural transformations of the anthocyanin chromophore as a function of pH. Many pH values have been proposed for this method. Researchers used pH 1.0 and 4.5 buffers to measure anthocyanin content in cranberries, and modifications of this technique have been applied to a wide range of commodities. The pH differential method has been described as fast and easy for the quantitation of monomeric anthocyanins. [2]
2.7.2. Subtractive method
Subtractive methods are based on the use of bleaching agents that will decolour anthocyanins but not affect interfering materials. Polymerized coloured anthocyanin-tannin complexes are resistant to bleaching by bisulfite, whereas the bleaching reaction of monomeric anthocyanins will rapidly go to competition monomeric anthocyanin pigments form a colourless sulfonic acid adduct by react with bisulfite. A measurement of the absorbance at the visible maximum is obtained, followed by bleaching and remeasuring to give a blank reading. The two most used bleaching agents are sodium bisulphite and hydrogen peroxide. [2]
13
3.
INSTRUMENTATION AND METHOD
3.1. Extraction equipment
The extraction column is placed in an oven. We can control the temperature on the oven and there are two temperature sensors in it to measure the temperature of the oven and the extract. The following figure (3.1.1) shows the extraction column inside the oven.
Figure 3.1.1. Extraction column
The components of the extraction equipment are: • Outside the oven
o Solvent: in this case is a liquid. It may be deionized water or a mixture of deionized water and ethanol (50 v/v).
o Pump (JASCO PU-980): instrument that provides a constant flow of 2ml/minute.
o Valve: controls the liquid inlet in the oven.
o Pressure sensor: it is connected to the pump as a safety measure, if the pressure exceeds the maximum value allowed by the pump, the pump turns off.
• Inside the oven
o Preheater: a spiral where the liquid increases its temperature before feeding the column.
o Column: cylinder with the grape skin inside. The water can go through the column but the solids like grape skin cannot. This is because of the filters installed at the top and the bottom of the column.
14 • Outside the oven:
o Cooler (Figure 3.1.2): spiral located into a vessel where there is water flowing to reduce the temperature of the liquid leaving the oven.
o Valve: controls the extraction pressure.
o Pressure sensor: it shows the pressure inside the column and makes it possible to control it using the valve.
o Extract collector: the extract is collected in dark flasks (to prevent degradation because of the light). The samples are more or less 20ml.
Figure 3.1.2 Cooler
15
Figure 3.1.3: Block diagram of the applied extraction arrangement
3.2. Extraction method
The extraction takes place in the oven at different temperatures. Before every extraction the column must be carefully sealed to prevent leaking. A leakage test must be done to be sure the pressure does not drop. During the leakage test the extract leaves the column, but the leakage test is performed at room temperature so the loses should not be high in this case.
16 The procedure consists of the following steps:
1. About 2g of grapeskin were measured and put into the column. 2. The empty flasks for collecting the samples were weighed.
3. The column had to be connected with the feed and the flasks to gather the extract. 4. A wrench was used to seal the circuit.
5. A leakage test was performed.
6. The oven was turned on and the temperature was set.
7. When the temperature in the second sensor showed the desired temperature, the extract was collected.
8. The flasks were changed every few minutes to obtain different samples. 9. The flasks with the extract were weighed.
10. The raffinate from the column was collected.
11. Three samples of 2ml were taken from every flask to dilute and analyse as is indicated. 12. The remaining solvent was evaporated to obtain the dry extract.
13. The dry extract was weighed and the amount of solid had to be corrected with the part of the sample taken to analyse.
14. The dry solid of every sample was stored separately.
15. The raffinate was placed in a weighted plate and left into the oven at 105°C. 16. The dry raffinate was weighed.
The first extractions are performed using deionized water as solvent, changing only the temperature. But on the last ones the solvent is deionizes water at the beginning but a mixture of water and ethanol later.
When the solvent is changed during an extraction, the procedure is: 1. The pump was turned off.
2. The outlet valve was closed. 3. The feed was changed.
4. The pump was turned on again.
5. The outlet valve was opened as much as it was needed to keep the pressure of the process.
3.2.1. Mass Balance
Weighting the raffinate has nothing to do with the anthocyanin content, but it is desired to compare the percentages of extract and raffinate obtained in each extraction.
All the dry grapeskin introduced in the column should end up being either extract or raffinate but due to some mass loses in the process the addition of extract and raffinate is less than the initial grape skin. The reasons why the raffinate and extract does not have the same mass as the initial dry material are:
• Some extract leaves the column during the leakage text and the heating. • Some extract remains in the pipes after the extraction.
17 3.3. Vacuum distillation [20]
After the extraction the liquid obtained must be evaporated to get the dry content. A vacuum distillatory was used for that.
Vacuum evaporation is a technique used in the treatment of liquids. Evaporation is a unit operation that consists of concentrating a solution by eliminating the solvent by boiling. In this case, it is performed at a pressure lower than atmospheric pressure. This way, the boiling temperature is much lower than that at atmospheric pressure, thereby resulting in notable energy savings.
After taking some extract for the anthocyanins measure method, the solvent was evaporated with vacuum, so the operating temperature was lower, and the anthocyanins got no damage. The evaporation temperature was controlled with a water bath. The water was at 50°C.
3.4. Spectrophotometer [21]
The spectrophotometer is the instrument used to measure the absorptivity of a sample when the light goes through it.
According to the wavelength, there are two kinds of spectrophotometer:
• Spectrophotometer UV-Vis: uses the UV range (185-400 nm) and the visible range (400-700nm). For the anthocyanin measurement the wavelength needed is the UV-Vis. • Spectrophotometer of infra-red: uses the range of infra-red (700-15000 nm).
A spectrophotometer has these parts:
• Light source: the light must fulfill the following conditions: stability, directionality, distribution of continuous spectral energy and long life. The light sources used can be xenon arc lamp, tungsten lamp, LED lamp and deuterium lamp.
• Monochromator: it gets the desired wavelength. It consists of: entrance and exit slits, collimator and dispersion element.
• Sample: the subject of the study. The dilution of the sample must be adequate to be on the linear range of the spectrometer.
• Detector: captures the radiation leaving the sample and transform it in information. • Quartz cell: Cell contains the liquid samples. The material of which they are made
varies according to the region of the spectra; glass or plastic if the work is with the visible region, quartz if the work is in the ultraviolet (this case) and NaCl if the work is in the infrared region.
The spectrophotometer used in the analysis was the model JENWAY M6305.
18
Figure 3.4.1: Spectrophotometer block diagram
3.5. Measurement of anthocyanines by UV-Visible spectroscopy
Measuring the absorbance of the sample at different pH, at different wavelengths and with or without bisulfide gives information about the anthocyanins concentration, polymeric colour, browning index, colour density, degradation index and percent polymeric colour. To obtain the information there are some steps that must be carefully followed. The analysis method is explained below.
• Total monomeric anthocyanin by the pH-differential method [2]
Anthocyanin pigments undergo reversible structural transformations with a change in pH manifested by strikingly different absorbance spectra (Figure 3.5.1). The coloured oxonium form predominates at pH 1.0 and the colourless hemiketal form at pH 4.5 (Figure 3.5.2). The pH-differential method is based on this reaction and permits accurate and rapid measurement of the total monomeric anthocyanins, even in the presence of polymerized, degraded pigments and other interfering compounds.
19
Figure 3.5.2 Structural forms
The steps that were followed to measure the monomeric anthocyanin content are these: 1. The appropriate dilution factor (DF = dilution factor) for the sample had to be determined so the sample at the λvis-max (for Cyanidin-3-Glucoside, λvis-max is 520nm) is within the linear range (less than 1.2) of the spectrophotometer. The dilution factor for these samples was generally 5, but in some cases it was 10.
2. Two dilutions of the sample were prepared, one with potassium chloride buffer (pH 1.0), and the other with sodium acetate buffer (pH 4.5), diluting each by the dilution factor. The dilutions needed to equilibrate for 15 minutes.
3. The absorbance of each dilution was measured at the λvis-max (520nm) and at 700 nm (to correct for haze). The zero point of the spectrophotometer was calibrated before each measurement with distilled water.
• Indices for pigment degradation, polymeric colour, and browning [2]
Indices for anthocyanin degradation of an aqueous extract, juice, or wine can be derived from a few absorbance readings of a sample that has been treated with sodium bisulfite. Anthocyanin pigments are combined with bisulfite to form a colourless sulfonic acid adduct. Polymerized coloured anthocyanin-tannin complexes are resistant to bleaching by bisulfite, whereas the bleaching reaction of monomeric anthocyanins will rapidly go to completion. The steps that had to be followed are below:
20
2. The absorbance of both samples was measured at 420 nm, λvis-max (520nm), and 700 nm. The zero point of the spectrophotometer was calibrated before each measurement with distilled water.
21
4
MATERIALS
4.1 Grape skin
The milled grape skin was obtained from Gere Winery (Villány) after fermentation and drying. The grape used is a red variety.
4.2 Solvents
Water: deionized water.
Water + ethanol (50 v/v): when this solvent mixture was used the extraction begins using only deionized water, by the time there are 8 samples of extract the solvent is changed for the mixture of water and ethanol.
4.3 Buffers [2]
• Potassium chloride buffer, 0.025 M, pH 1.0
1.86 g KCl was dissolved in 980 ml of distilled water in a beaker. The pH of the solution was adjusted to 1.0 with concentrated HCl. The solution was transferred to a 1 litre volumetric flask and it was filled to 1 litre with distilled water.
• Sodium acetate buffer, 0.4 M, pH 4.5
54.43 g CH3CO2Na⋅3 H2O was dissolved in 960 ml distilled water in a beaker. The pH of the solution was measured and adjusted to 4.5 with concentrated HCl. The solution was transferred to a 1 litre volumetric flask and it was filled to 1 litre with distilled water.
The solutions should be stable at around 20oC for a few months, but the pH should be checked and adjusted prior to use.
• Bisulfite solution
22
5
CALCULATIONS
5.1 Dry content
The grape skin is not dry at ambient conditions. To know the material humidity of a sample must be weighed before and after being in the oven at 105oC for 72 hours. The humidity was measured with three different samples and the humidity used in the calculations is the average of them. The procedure is:
1. Around 10 g of grape skin were weighted in laboratory conditions. 2. The sample was placed in the oven at 105°C for three days. 3. The grape skin was weighted again when it was cool enough. 4. The dry content (in percentage) is:
Dry content [%] = (final weight (g)/initial weight (g)) x 100
Once the humidity is known, the grape skin mass measured and filled into the column is corrected with this number to obtain the dry grape skin mass.
5.2 Extraction yield
The yield of the extract is the percentage of the extract obtained from the dry material. It measures the solvent efficiency in an extraction. The yield can be measured individually for each sample or as an accumulated yield.
• Extraction yield
• Accumulated extraction yield
5.3 Absorbance and monomeric anthocyanin
The dilution factor chosen is 5 for most samples (with that dilution the spectrophotometer works in the linear range, generally), but with some samples is necessary to use another dilution factor. The dilution factor 10 was applied for those that exceed the linear range. The absorbance of the sample is calculated with the data obtained of the sample at pH 1 and pH 4.5 at both wavelengths, vis-max (520nm) and 700nm. Once the absorbance is known it is possible to calculate the monomeric anthocyanins concentration in:
YE
i(g
solid/100g
drygrapeskin) = Solid obtained (g) / dry grape skin (g) *100
23 • mg anthocyanin in litre of the sample. • mg anthocyanin in g of dry extract.
• mg anthocyanin in g of dry material (before extraction).
In these calculations is necessary to know the molecular weight, molar absorptivity, dilution factor and pathlength. According to other studies, if the ε (molar absorptivity) of the major
pigment is not available, or if the sample composition is unknown, the calculations are done supposing the pigment is cyanidin-3-glucoside (figure 5.3.1), where: [2]
• MW = 449.2 • ε = 26,900
Cyanidin-3-Glucoside [22]
Cyanidin-3-Glucoside is considered the main anthocyanin. It has the following characteristics (table 5.3.1):
Tabla 5.3.1: Characteristics
Cyanidin-3-Glucoside
Molecular Formula C21H21O11
Molecular Weight 449.388 g/mol
The absorbance of the diluted sample (A) is calculated as follows, being (Awavelengh)pH the absorbance at a determined wavelength and pH:
The monomeric anthocyanin pigment concentration in the original sample is calculated using
the following formula. The anthocyanin taken as reference in these calculations is cyanidin-3-glucoside.
Where:
• MW is the molecular weight of cyanidin-3-glucoside • DF is the dilution factor
• ε is the molar absorptivity of cyanidin-3-glucoside • l is the pathlength (in this case is 1)
A = (A
λ vis-max–
A
700)
pH 1.0–
(A
λ vis-max–
A
700)
pH 4.524
The monomeric anthocyanin concentration (MAC) in mg/g extract can also be calculated by dividing the number 50 because of the volume of the samples, they are 20ml each, more or less. The amount in mg we have in the sample (in this case in 20ml of extract) is divided by the amount of dry extract we obtain.
[MAC x 20ml x (1l/1000ml) = MAC/50 = mg anthocyanins in the sample]
The monomeric anthocyanin concentration in mg/g dry material is calculated according to the following formula:
5.4 Colour density, pigment degradation, polymeric colour and browning
From the absorbance measurements we can get some more information about the samples. The absorbance at 420 nm of the bisulfite-treated sample serves as an index for browning.
Colour density is defined as the sum of absorbances at the λvis-max (520) and at 420 nm. The ratio between polymerized colour and colour density is used to determine the percentage of the colour that is contributed by polymerized material. The ratio between monomeric and total anthocyanin can be used to determine a degradation index.
Colour density, pigment degradation, polymeric colour and browning are calculated as is indicated below, being DF the dilution factor.
The colour density of the control sample (treated with water) is calculated as follows:
The polymeric colour of the bisulfite bleached sample is calculated as follows:
The ratio between polymerized colour and colour density can be used to determine the percentage of the colour that is contributed by polymerized material. The percent polymeric colour is calculated using the formula:
The degradation index (DI) is calculated using the formula (treated with water): [7]
MAC (mg/g dry material) = MAC (mg/g extract) x YE /100
Colour density = [(A
420 nm–
A
700nm) + (A
λ vis-max–
A
700 nm)] × DF
Polymeric colour = [(A
420 nm–
A
700 nm) + (A
λ vis-max–
A
700 nm)] × DF
Percent polymeric colour (%) = (polymeric colour/colour density) × 100
25
The browning index is calculated using the absorbances of the bisulfite treated samples:
5.5 Percentage of extract and raffinate
• % extract = dry extract accumulate (g) / dry grapeskin (g) x 100 • % raffinate = dry raffinate (g) / dry grapeskin (g) x 100
26
6
RESULTS AND DISCUSSION
6.1 Dry content
Table 6.1.1 summarizes the results of the determination of the dry content of the milled grape skin. The average dry content in grape skin is 94.19%. It means this percentage of the grapeskin at laboratory conditions is dry material. The grape skin weighted and put into the column must be corrected with this percentage.
Table 6.1.1: Dry content of the milled grape skin
HUMIDITY Sample Initial weight (g) Final weight (g)
The yield of extraction is a relation between the dry grape skin used and the amount of extract obtained. Typically extraction yield as a function of solvent consumption follows a saturation curve.
The data obtained experimentally should fit a determined extraction curve suggested by Brunner [23].
YE = YEmax * (1 – exp(-k * SC))
Where:
• YE is the yield of extraction (dependent variable) (g extract/100g dry grape skin) • SC is the solvent consumption / dry material (independent variable) (g solvent/g dry
grape skin)
• YEmax is the maximum yield of extraction (g extract/100g dry solvent) • k is the kinetic parameter (g dry grape skin/g solvent)
27
6.2.1 Pre-experiment for determination of solvent consumption
• EXTRACTION 1
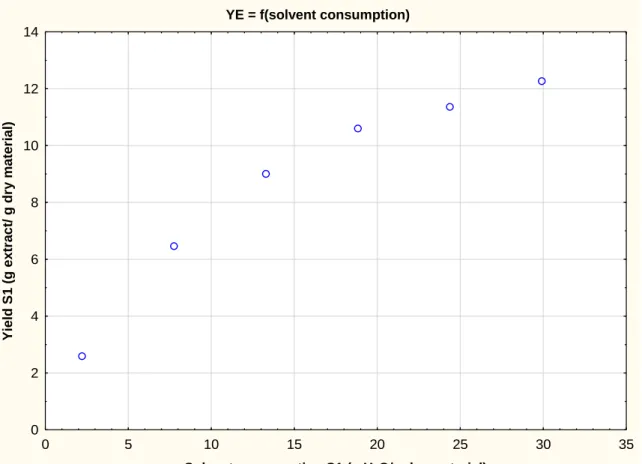
This extraction was intended to determine the parameters of the following ones. It was used to have a general idea of the extraction time, the volume of the samples and the solvent consumption. It was performed at 110oC and 50 bar. The following table (table 6.2.1) shows the solvent consumption and yield of the extracts obtained for each sample
Table 6.2.1: Extraction yield and solvent consumption of the extraction 1
Sample
Solvent consumption
Figure 6.2.1 represents the extraction yield as a function of solvent consumption. It is observed that the maximum yield is not reached because the yield is increasing continuously.
Figure 6.2.1: time course of the extraction 1 yield
YE = f(solvent consumption)
0 5 10 15 20 25 30 35
Solvent consumption S1 (g H2O/g dry material)
28
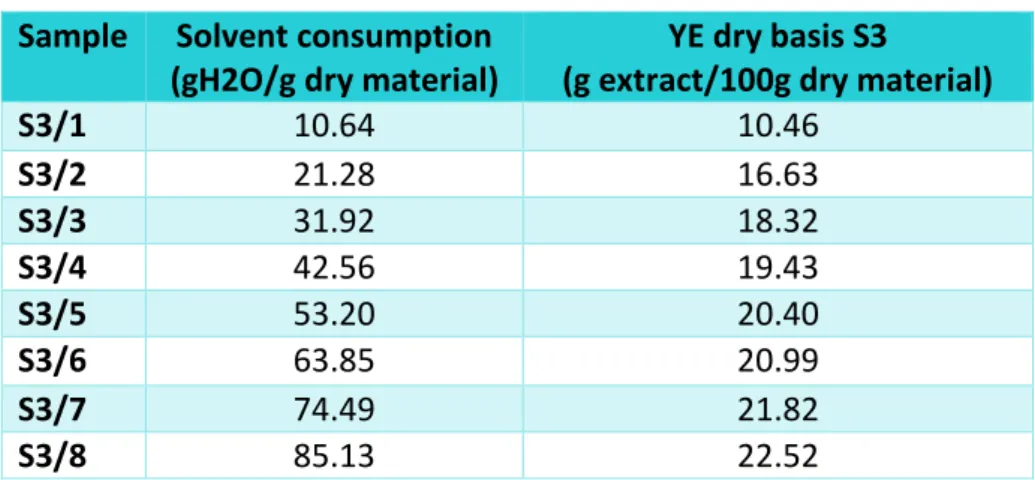
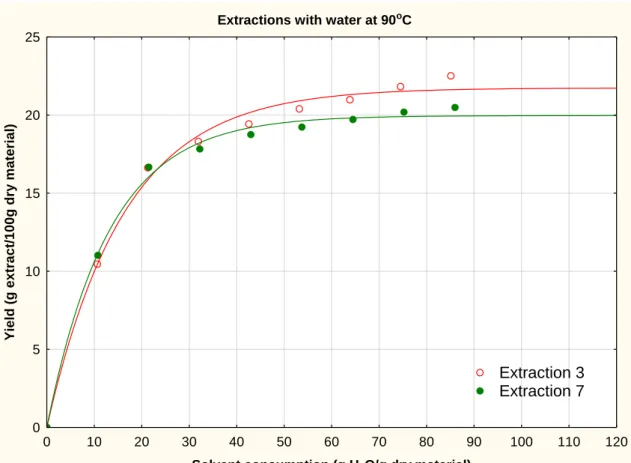
6.2.2 Extraction at 90°C with water
These are the results for the extractions performed at 90oC and 50 bar with deionized water as solvent. These were the extraction number 3 (table 6.2.2) and 7 (table 6.2.3)
•
EXTRACTION 3Table 6.2.2: Extraction yield and solvent consumption of the extraction 3
Sample
Solvent consumption
Table 6.2.3: Extraction yield and solvent consumption of the extraction 7
Sample
Solvent consumption
(gH2O/g dry material)
YE dry basis S7 (g extract/100g
dry material)
If we fit these data with the extraction curve formula [YE = YEmax*(1-exp(-k*SC))] we obtain a value of maximum yield of the extraction and kinetic parameter for each extraction. They are represented in the following table (table 6.2.4).
Table: 6.2.4: Extraction parameters at 90oC with water
Extraction
Temperature
29 Figure 6.2.2: Extraction curves at 90oC with water
Extractions with water at 90oC
0 10 20 30 40 50 60 70 80 90 100 110 120
Solvent consumption (g H2O/g dry material)
0
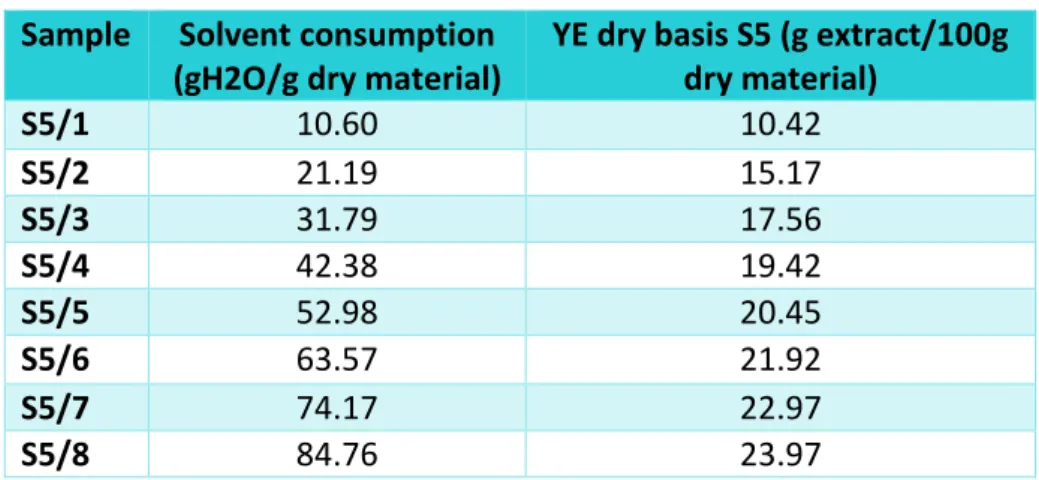
6.2.3 Extraction at 110°C with water
The following tables summarizes the results of the extractions performed at 110oC and 50 bar with deionized water as solvent. These were the extraction number 2 (table 6.2.5), 5 (table 6.2.6) and 6 (table 6.2.7).
•
EXTRACTION 2Table 6.2.5: Extraction yield and solvent consumption of the extraction 2
30 • EXTRACTION 5
Table 6.2.6: Extraction yield and solvent consumption of the extraction 5
Sample
Solvent consumption
(gH2O/g dry material)
YE dry basis S5 (g extract/100g
dry material)
Table 6.2.7: Extraction yield and solvent consumption of the extraction 6
Sample
Solvent consumption
When we fit these data with the extraction curve formula used before, we obtain a value of maximum yield extraction and kinetic parameter for each extraction. They are represented in the following table (table 6.2.8):
Table: 6.2.8: Extraction parameters at 110oC with water
Extraction
Temperature
31
sample 6 to the 8. This anomaly means that the function does not describe the time course of the extraction yield precisely.
Figure 6.2.3: Extraction curves at 110oC with water
Extractions with water at 110oC
0 20 40 60 80 100 120
Solvent consumption (g H2O/g dry material)
0
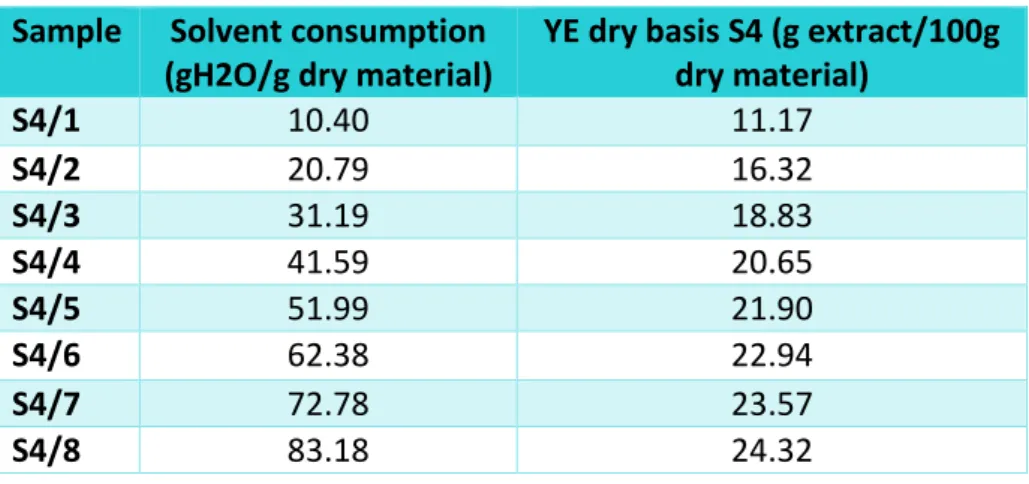
6.2.4 Extraction at 130°C with water
These are the results for the extraction performed at 130oC and 50 bar with deionized water as solvent. That was the extraction number 4 (table 6.2.9).
• EXTRACTION 4
Table 6.2.9: Extraction yield and solvent consumption of the extraction 4
Sample
Solvent consumption
(gH2O/g dry material)
32
The fitted extraction curve can be seen in figure 6.2.4. The maximum yield of extraction and the kinetic parameter are given in the following table (table 6.2.10).
Table: 6.2.10: Extraction parameters at 130oC with water
Extraction
Temperature
temperature. Nevertheless, it is observed that the maximum extraction yiled is slightly higher than at lower temperatures while the kinetic parameter is below the average value for other temperatures.Figure 6.2.4: Extraction curve at 130oC with water
Extraction with water at 130oC
0 20 40 60 80 100 120
Solvent consumption (g H2O/g dry material) 0
6.2.5 Extraction with water-ethanol mixture
33
keeping the temperature and the pressure constant, the solvent used was changed. First it was only water, later it is a mixture of water and ethanol at a 50% in volume.
The water – ethanol solvent mixture was already pumped in the 9th sample, but as the column is already filled with water the extract collected is still dissolved in deionized water. In the calculation it is considered that the 10th sample is the first one with the mixture of water and ethanol as solvent. The average density for the mixture of water and ethanol is 0.91g/ml. In these cases, there are two extraction curves:
• Curve 1: when the solvent is deionized water
• Curve 2: when the solvent is the mixture of water and ethanol
Therefore, there are two YEmax and two kinetic parameters for each extraction.
o WATER-ETHANOL MIXTURE AT 90oC
These are the results for the extractions performed at 90oC and 50 bar with deionized water and a mixture of deionized water and ethanol as solvent. That was the extraction number 10 (table 6.2.11).
• EXTRACTION 10
Table 6.2.11: Extraction yield and solvent consumption of the extraction 10
Sample
Solvent consumption
(g solvent/g dry material)
YE dry basis S10 (g extract/100g dry material)
34
value stabilizes around the value of YEmax‘. The table below (table 6.2.12) shows the parameters.
Table: 6.2.12: Extraction parameters at 90oC and 50 bar with water-ethanol
Extraction
YE
max following figure (figure 6.2.5). The fitting in that case was not good enough, so the parameters does not describe the extraction precisely.Figure 6.2.5: Extraction curve at 90oC with water-ethanol
Extraction with water-ethanol at 90oC
0 20 40 60 80 100 120 140 160 180
Solvent consumption (g solvent/g dry material) 0
o COMPARISON OF THE EXTRACTIONS AT 90oC
35
extraction yield was lower than the maximum yield was obtained with water (extraction 3 and 7). It might be because of the high mass loses in this extraction or the inhomogeneity of the raw material. Further experiments are necessary to ascertain this discrepancy.
Figure 6.2.6: Extraction curve comparative at 90oC
Extractions at 90oC
0 20 40 60 80 100 120 140 160 180
Solvent consumption (g solvent/g dry material) 0
o WATER-ETHANOL MIXTURE AT 130oC
36 • EXTRACTION 8
Table 6.2.13: Extraction yield and solvent consumption of the extraction 8
Sample
Solvent consumption
(g solvent/g dry material)
YE dry basis S8 (g extract/100g dry material)
Table 6.2.14: Extraction yield and solvent consumption of the extraction 9
Sample
Solvent consumption
(g solvent/g dry material)
37
When we fit these data with the extraction curve formula used before, we obtain values for the maximum yield extraction and kinetic parameter. They are represented in the following table (table 6.2.15):
Table: 6.2.15: Extraction parameters at 130oC and 50 bar with water-ethanol
Extraction
YE
maxStudying the obtained values, we can see that the extraction yields differs, in the extraction 8 it reaches higher values. However, the kinetic parameters of the extractions 8 and 9 are very similar. In the following graph (figure 6.2.6) we can compare the extraction curves.
Figure 6.2.6: Extraction curves at 130oC with water-ethanol
Extractions with water-ethanol at 130oC
0 20 40 60 80 100 120 140 160 180
Solvent consumption (g solvent/g dry material) 0
6.2.6 Comparison of the results of PLE with water
It is important to compare the information of all the extraction according to the operation temperature. The first extraction is not useful for the calculations because the extraction time was not enough. So, we have:
38 • 3 extractions at 130°C
The results using water as solvent are compared in the following table (table 6.2.16). Table 6.2.16: Extraction parameters comparative
Temperature Extraction YE max (g/100g)
It can be noticed that the dispersion of the data is remarkable, but it might be due to the mass loses in the process because of the method. The higher the loses are, the lower the YE max value is. Mass balance error of the extractions is explained in subchapter 6.3.
Despite that fact, it is clear that the highest YE values are obtained at 130°C, so there is a direct relation between the temperature and the extraction yield. On the other side, while the temperature increases, the kinetic parameter decreases, so the relation between the temperature and the kinetic parameter is indirect.
6.3 Percentage of extract and raffinate
When the mass balance is calculated, we can appreciate the mass balance error and confirm that this values are related to the extraction yield.
When the loses are lower than 10% (S3, 1.17%; S6, 9.5% or S7, 0.6%) we can observe that the YEmax is bigger than the average YE.
• S3: Loses = 1.17% → YEmax > average YEmax → 21.74 > 18.69 • S6: Loses = 9.55% → YEmax > average YEmax → 20.25 > 20.64 • S7: Loses = 0.60% → YEmax > average YEmax → 19.97 > 18.69 When the loses are higher than 10%, the opposite thing happens.
• S4: Loses = 10.48% → YEmax < average YEmax → 23.78 < 24.95 • S8: Loses = 15.68% → YEmax < average YEmax → 28.16 < 24.95 • S9: Loses = 21.95% → YEmax < average YEmax → 21.74 < 24.95 • S10: Loses = 16.89% → YEmax < average YEmax → 14.35 < 18.69
39
Table 6.3.1 Mass balance at 90oC
EXTRACTION 3 (90 oC)
% extract 21.21 % raffinate 77.62 % loses 1.17
Table 6.3.2: Mass balance at 110oC
EXTRACTION 6 (110oC)
% extract 19.71 % raffinate 70.75 % loses 9.54
Table 6.3.3: Mass balance at 130oC
EXTRACTION 8 (130 oC)
% extract 26.23 % raffinate 58.10 % loses 15.67
EXTRACTION 9 (130 oC)
% extract 20.08 % raffinate 57.97 % loses 21.95
6.4 Anthocyanins content
It is known that the extract obtained from grape skin contains anthocyanins, but we have to determine the concentration of them. As they are colour pigments, a qualitative method to determine the concentration of them is comparing the colour of the samples.
In the following figure (6.4.1) it can be appreciated how the colour of the samples changes. At the beginning it is similar to wine, but on the 8th sample it is just like water with light colour. The more coloured the sample is, the higher anthocyanins concentration it has.
EXTRACTION 7 (90 oC )
% extract 19.30 % rafinate 80.10 % loses 0.60
EXTRACTION 10 (90 oC )
% extract 14.11 % raffinate 69.00 % loses 16.89
EXTRACTION 4 (130 oC )
40 Figure 6.4.1: Colour variation of the extracts
When a red brown colour appears in the samples, it can be assumed that it is due to the monomeric anthocyanin degradation. Degradation may occur at higher temperature.
The qualitative analysis gives a general idea, but concrete data is required. It is obtained using the UV-VIS spectrophotometric method explained in chapter 3.5. The results obtained were calculated from the absorbance measurements (can be found in the appendix 9.2) and are explained below.
6.4.1 Extraction at 90°C with water
41 • EXTRACTION 7
Table 6.4.1: Anthocyanin concentrations for extraction 7
Sample A Anthocyanin (mg/l)
The figure (figure 6.4.2) shows the mass of anthocyanin obtained. Figure 6.4.2: Anthocyanin accumulate content in extraction 7
6.4.2 Extraction at 110°C with water
When we use the same equations with the extraction at 110oC, we obtain the following anthocyanin concentration values (table 6.4.2 and table 6.4.3).
42 • EXTRACTION 5
Table 6.4.2: Anthocyanin concentrations for extraction 5
Sample A Anthocyanin
Table 6.4.3: Anthocyanin concentrations for extraction 6
Sample A Anthocyanin
43
Figure 6.4.3: Anthocyanin accumulate content in extractions at 110oC
6.4.3 Extraction with water-ethanol as solvent
For the extractions with water-ethanol as solvent the results are showed below (table 6.4.4). The extraction 10 was performed at 90oC while the extractions 8 and 9 were performed at 130oC.
• EXTRACTION 10
Table 6.4.4: Anthocyanin concentrations for extraction 10
44
The concentration of anthocyanins at 90oC is two times higher than at 110oC. It is noticeable that with water, the monomeric anthocyanin content of the grape skin was not extracted completely. The addition of ethanol meant that more monomeric anthocyanins were extracted from the sample. The mg of anthocyanins extracted are represented in the following graph (figure 6.4.4). An unexpected increasing can be seen in the anthocyanin content of the sample 6, moreover, in case of the extraction yield this increasing can also be observed.
Figure 6.4.4: Anthocyanin accumulate content in extraction 10
• EXTRACTION 8 AND 9
In these extractions, the degradation of the anthocyanins was significant because of the temperature (130°C), therefore, this temperature should not be used to obtain anthocyanin despite the higher extraction yields obtained at this temperature.
45
6.4.4 Comparison of the results
Table 6.4.5 summarizes the anthocyanin yields at the studied extraction conditions. Because there were two different kinds of extraction we can see the amount extracted with only water, so the first 8 samples, but also the amount extracted after the use of water and the mixture of water and ethanol. It is noticeable that the higher anthocyanin concentration is obtained for the lower extraction temperatures (especially extraction 7), in this case 90oC.
Table 6.4.5: Comparative of the results
Temperature
(ºC) Extraction
Anthocyanins (mg/g dry
material) YEmax
Water (80 minutes)
Water + ethanol
Water (80 minutes)
Water + ethanol
90 7 13.2 19.97
10 9.3 12.3 14.35 23.08
110 5 5.7 23.26
6 6.4 20.25
47
6.5 Colour density, polymeric colour, percent polymeric colour, degradation, and browning polymerized colour and colour density. It is used to determine the percentage of the colour which is contributed by polymerized material.
• Degradation index: it gives the accumulation of the browning products. The ratio between monomeric and total anthocyanin can be used for determination of the degradation index.
• Browning
With these values we can get a general idea of the amount of monomeric and total anthocyanins, the ratio between them and the degradation of the sample.
6.5.1 Extractions at 90°C
In these cases, the obtained values (table 6.5.1 and 6.5.2) are similar except in certain values that may have been caused by absorbance reading mistakes or contamination of the samples. As we can see, the sample 2 presents a higher colour density, polymeric colour and browning index than the average of the other samples, while the degradation index is slightly lower than the average.
• EXTRACTION 7
Table 6.5.1: Extraction 7 values
Sample Colour
48 Table 6.5.2: Extraction 10 values
Sample Colour parameters but degradation index. The results are the average of each value with the solvent used.
Table 6.5.3: Comparison of the extraction results at 90oC
Extraction Solvent Colour density
6.5.2 Extraction at 130°C
• EXTRACTION 9
49
mixture used as extraction solvent the polymerized colour content of the extract increased. The accumulation of the brownish degradation products is also determinative.
Table 6.5.4: Extraction 9 at 130oC
Solvent Colour density
Degradation index
Polymeric colour
Browning index
Percent polymeric colour
Water 1.62 9.28 0.89 0.61 49.5
Water + ethanol
3.52 11.3 3.22 2.14 89.9
The following figures give a comparison between the different averages indicate the polymeric colour content and the degradation (figure 6.5.1, 6.5.2, 6.5.3, 6.5.4 and 6.5.5). The red colour means the extraction is performed at 90oC and the blue at 130oC.
50
Figure 6.5.2: Comparison of the polymeric colour
51
Figure 6.5.2: Comparison of the degradation index
Figure 6.5.4: Comparison of the browning index
In all cases the results with water and ethanol are higher than with only water as solvent. The biggest differences are found in colour density, polymeric colour and browning index.