Local Piezoelectric Behavior of Potassium Sodium
Niobate Prepared by a Facile Synthesis
via
Water
Soluble Precursors
Nina Senes
*, Antonio Iacomini, Neus Domingo,
Stefano Enzo, Gabriele Mulas,
Santiago Cuesta-Lopez, Sebastiano Garroni*
Nina Senes, Antonio Iacomini
Department of Chemistry and Pharmacy, University di Sassari, Via Vienna 2, I-07100 Sassari, Italy E-mail: nsenes@uniss.it; sgarroni@ubu.es;
Prof. Neus Domingo
Catalan Institute of Nanoscience and Nanotechnology (ICN2), CSIC and The Barcelona Institute of Science and Technology, Campus Universitat Autònoma de Barcelona, Bellaterra, Cerdanyola del Vallès, 08193 Barcelona, Spain.
Prof. Stefano Enzo, Prof. Gabriele Mulas
Department of Chemistry and Pharmacy, University di Sassari, Via Vienna 2, I-07100 Sassari, Italy Dr. Santiago Cuesta-Lopez, Dr. Sebastiano Garroni
International Research Centre in Critical Raw Materials-ICCRAM, University of Burgos, Plaza Misael Banuelos s/n, 09001 Burgos, Spain
Advanced Materials, Nuclear Technology and Applied Bio/Nanotechnology. Consolidated Research Unit UIC-154. Castilla y Leon. Spain. University of Burgos. Hospital del Rey s/n, 09001 Burgos, Spain
Complete Manuscript
Keywords
:
Piezoceramics, Potassium Sodium Niobate, Modified-Pechini method, Piezoresponse Force microscopy, X-ray diffractionAbstract
Due to the ever-increasing restrictions connected to the use of toxic lead-based materials, the developing of lead-free piezoceramics has become one of the most urgent tasks. In this context, potassium sodium niobate materials, KNN, have attracted a lot of interest as promising candidates due to their excellent piezo properties. For this reason, many efforts have been addressed to optimize the synthesis process now suffering by several drawbacks including the high volatilization of potassium and sodium at the conventional high temperature treatments and the use of expensive metal precursors. To overcome these issues, a new modified Pechini method to synthesize single phase K0.5Na0.5NbO3
powders, from water soluble metal precursors, is presented. Microstructural and structural parameters have been characterized by X-ray diffraction (XRD). Depending on the amount of citric acid added to the starting reagents, two pure single-phase K0.5Na0.5NbO3 (2g citric acid) and K0.3Na0.7NbO3 (0.2 g
citric acid), respectively, were obtained with a good crystallinity at a moderate temperature of 500 °C. The piezo responses of the as calcined systems have been tested by piezoresponse force microscopy (PFM). K0.5Na0.5NbO3 exhibits a much higher response with respect to the other phase, which relates
to the larger crystallinity and to the chemical composition. 1
1. Introduction
Piezoelectricity is the property of many materials to generate an electrical charge, if subjected to mechanical forces (direct piezoelectric effect) or, conversely, to display a mechanical deformation when exposed to an electric field, (reverse piezoelectric effect).[1, 2] Since the first real application of piezoceramic in the sonar during the First World War, a large number of piezo-devices, including ultrasonic medical imaging, ultrasonic non-destructive testing, speakers, resonators, gas igniters, gyroscope, pressure sensors, etc that had a considerably impact on own life.[3,4] Many of these
technological applications are mainly composed by lead-based ceramic (PZT), today considered not suitable for their toxicity.[5] For these reasons, in the last years, the attention of the scientific community and industries has been directed to alternative lead-free systems.[6] To this regard, un-doped and un-doped KxNa1-xNbO3 (KNN) systems attracted growing interest as promising candidates due
to their excellent piezoelectric (390-490 pC/N) good electromechanical constants (K33 83%) and high
Curie temperature (TC ~ 217-304 °C).[7-9] From a crystallographic point of view, KNN presents
orthorhombic crystal structure at room temperature and two phase transitions at higher temperatures, orthorhombic to tetragonal at TC = 200°C and tetragonal to cubic at TC = 420°C, respectively. Above
this temperature, the sample loses its piezoelectric propriety. [10] Although the solid-state reaction route is normally used to synthesize KNN materials, several drawbacks emerged and are discussed in the current literature.[11-13] Even below the temperatures required for sintering the powders (> 1100 °C), volatilization of alkaline ions is taking place, producing undesired secondary phases and hampering a good densification of the powders.[14-16] For these reasons, soft chemical routes have been recently explored with the aim to overcome the above-mentioned barriers in the production of KNN-based systems.[17-19] In particular, these routes are expected to reduce the loss of highly volatile potassium
content in the KNN systems giving good chemical stoichiometry and compositional homogeneity.[20,21] Typically, the starting materials are nitrates, carbonates and acetates, as well as niobium alkoxides as Na, K and Nb sources, respectively. However, the high cost and easiness to hydrolysis of niobium alkoxides are limiting factors of these processes for scaling up applications.
[22-24] Niobium (V) oxide is considered a good alternative as Nb precursor for its low cost and for the
possibility to obtain metal complexes with chelating species in water.[25-28] The principle of this method is that hydroxycarboxylic acids, amino acids or some other natural organic compounds are used to protect and stabilize high valence metal ions, activating them to enhance solubility and reactivity in water. On the other hand, the many steps involved in the preparation process with niobium oxide reagent, are time consuming and imply drawbacks for the use of hydrofluoric acid (HF) in order to prepare niobic acid or at high temperature.[29-31] Recently, ammonium niobate (V) oxalate hydrate has been efficiently used as Nb-source in different complex forms through the chemical chelation in water for enhancing its gel formation capability.[32,33] The most promising candidate as chelating agent is represented by the citric acid. It is a polydentate ligand with a hydroxylic functional and three carboxylic groups and, among its several benefits, it allows to easily form soluble and stable chelating complexes with metal cations in an acidic or alkalescent solution. Generally, citric acid is widely used in the modified Pechini method and in the sol-gel combustion method.[34-40]
In this work, we report on a simple and direct method to synthesize highly pure crystalline KNN powders. KNN was prepared by sol-gel method using, for the first time to the best of our knowledge, ammonium niobate (V) oxalate hydrate and acetate of sodium and potassium as metal sources. The synthesis was conducted varying the amount of citric acid, used as chelating agent. The structure of the final product was characterized by X-ray diffraction. Moreover, the piezoelectric activity of the two as-prepared samples was also evaluated and correlated with the structural properties.
2. Experimental
Commercially available reactants, i.e. potassium acetate (C2H3O2K, ≥ 99.0%, Aldrich Chemicals),
sodium acetate (C2H3O2Na ≥ 99.0%, Aldrich Chemicals), ammonium niobate oxalate monohydrate
(C4H4NNbO9H2O, 99.99%, Aldrich Chemicals), citric acid monohydrate (C6H8O7H2O, 99.5%,
Aldrich Chemicals), acetone (C3H6O, 99.9 %, Aldrich Chemicals) and distilled water (milli-Q), were
used as raw materials without further purification.
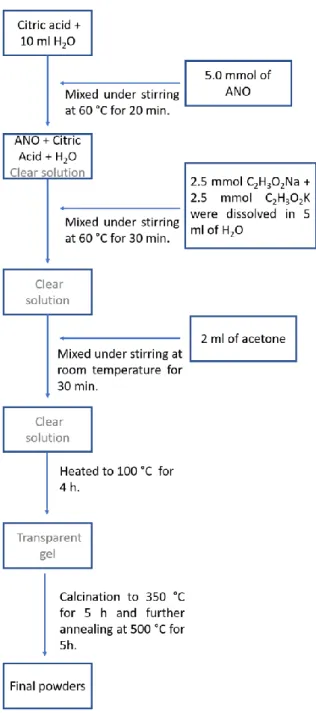
A modified Pechini method was used for the synthesis of the K0.5Na0.5NO3 (KNN) powders which
is illustrated schematically in the flow-chart depicted in Figure 1.[41] 1
Citric acid monohydrate (2 g) was dissolved under stirring in 10 ml of distilled water. 5 mmol of ammonium niobium oxalate monohydrate (ANO) were then added to the as-prepared citric acid solution, and mixed, under continuous stirring, at 60 °C for 20 min. The alkali acetates with a molar ratio 1:1, were dissolved in 5 ml of water and subsequently added drop-by-drop to the solution of ANO and citric acid previously prepared. 2 ml of acetone were then added, at room temperature, to the clear solution and mixed for 30 minutes under stirring. After that, the solution was heated to 100 °C and maintained at this temperature for 4 h until obtaining a transparent gel. The final gel was calcined under air in an alumina crucible at 350 °C for 5 h. The as-calcined powders were finely ground for a few minutes in an agate mortar. Subsequently, few drops of polyvinyl alcohol (PVA) were added to the powders which were then compacted in a cylinder-shaped shape disk of 10 mm diameter and 2 mm of thickness by a uniaxial pressure of 1500 kg/cm2 for 15 minutes using a hydraulic press. The disks were further annealed at 500 °C, with a heating ramp of 5 C°/min, for 5h. A second pellet was prepared using the same protocol by varying the initial amount of citric acid (0.2 g).
The crystalline phases of the KNN pellets were measured by X-ray diffraction (XRD) using a PANalytical X’Pert PRO diffractometer, with a CuKα tube (λ = 0.15418 nm) equipped with a graphite monochromator in the diffracted beam and a X’Celerator linear detector. Further XRD investigations were conducted using a SMARTLAB diffractometer with a rotating anode of Copper working at a power of 40 kV and 100 mA, with a graphite monochromator and a scintillation tube.
Quantitative analysis of the crystalline phases, structure and microstructure parameter determinations were performed with the MAUD program (Multiple Analysis Using Diffraction), a diffraction/reflectivity analysis program mainly based on the Rietveld method.[42] Visualization of crystals morphologies were realized by the VESTA software.[43]
Surface morphology of the powders and disks, were investigated by scanning electron microscopy (SEM) by means of a FEI Q250 microscope.
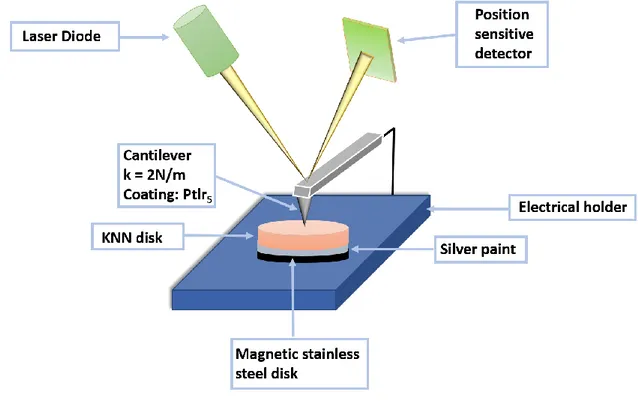
The local properties of the samples were characterized from the calcined pellets using an atomic force microscope (AFM) MFP-3D (Asylum Research, an Oxford Instruments company, USA). Conductive tips from Nanosensors model EFM (k = 2N/m, Ptlr5 coating) were used for the 1
characterization of the electronic state in Kelvin Probe Force Microscopy (KPFM) mode and the piezoelectric properties by Piezoresponse Force Microscopy (PFM). The experimental setup is shown in Figure 2. In PFM, an ac voltage is applied to a conductive tip used as a top electrode in contact with the surface in a strong indentation regime: while the topography image is recorded in the so-called contact mode, in piezoelectric samples a mechanical excitation produced by the inverse piezoelectric effect is detected as a dynamic oscillation of the tip giving rise to the PFM signal. In ferroelectric materials, the amplitude of PFM signal is proportional to the magnitude of the polarization vector (directly related to the piezoelectric tensor), and the phase of the PFM gives information about the polarization direction. For the PFM imaging, the dual amplitude resonance tracking (DART) mode
was employed. In DART mode, the sample is excited by an ac voltage at the contact resonance frequency of the tip, and in this way, the inverse piezoresponse signal of the sample, which produces a displacement oscillation of the surface of only a few pm, is naturally enhanced by the quality factor Q of the contact resonance frequency. In this case, the effective measured PFM amplitude of the oscillation can thus be approached by the equation A=Q·d33·Vac. Asylum AFM software for DART
mode calculates the Q value for every point by fitting the PFM resonance signal to a single harmonic oscillator, from which it extracts an effective value for the absolute sample surface displacement.
3. Results and Discussion
3.1Synthesis and structural characterization of the KNN system
As it emerged from the most relevant literature, aluminium niobate oxalate reagents were extensively used as niobium precursor for synthesizing niobium-based oxides. The peroxo ligands significantly enhance their solubility in water and their air stability.[44] The addition of chelating agents, such as citric acid, allows to stabilize the niobium reagent forming a peroxo-citrato-niobium precursor, as it was proposed by Narendar and Messing.[45] Although this stable complex is observed under excess of H2O2 medium, its occurrence can not be rejected in the direct reaction of niobium oxalate with the citric acid in water.
In this investigation, in order to minimize the number of reagents, the citric acid was used as chelating and to trigger the polymerization during the formation of the transparent gel. In this manner, 1
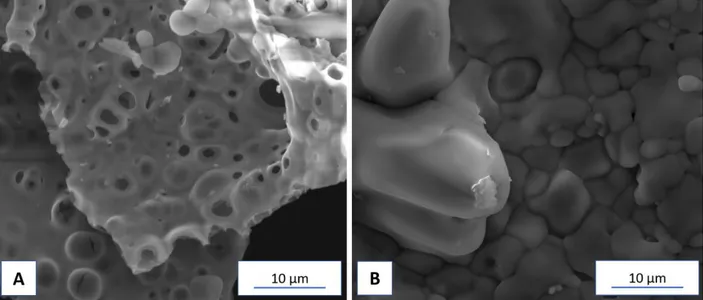
use of H2O2 and ethylene glycol, the latter typically used in Pechini method, were suppressed. For this study, two critical temperatures, 350 °C and 500 °C, have been selected. In Figure 3, the SEM images of the KNN synthesized with 2 g of citric acid at the two different temperatures (350 and 500 °C), are shown.
In the left side micrograph (Figure 3 A), the surface of the post-heated gel shows the clear presence of pores ascribable to the release of CO2 gas during the annealing process. The CO2 evolution is a consequence of the thermal decomposition of the complex oxalates formed through the gelation, as it was already observed by Yao et al. and further confirmed by Rani and coauthors.[46, 25] Upon compaction and subsequent annealing at 500 °C, the surface morphology of the final pellet changes with respect to the un-treated powders. As a consequence of the annealing treatment and uniaxial pressure, evidenced in Figure 3 B, the pores definitely disappeared together with a significant crystal growth and the presence of small particles, in agreement with other synthetic procedures.[47]
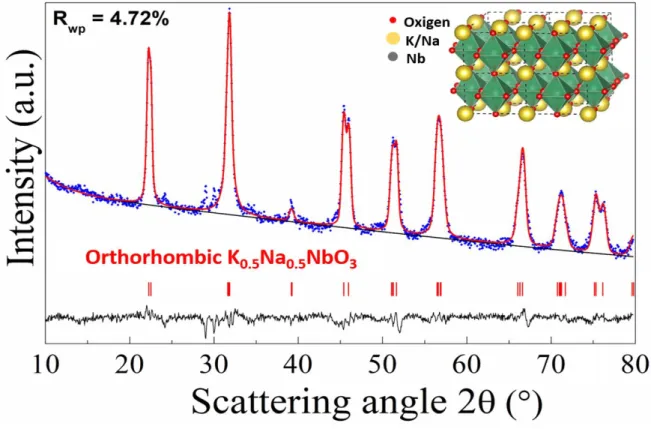
The corresponding XRD pattern is reported in Figure 4. Conversely to the amorphous pattern observed for the system treated at 350 °C (not reported here), the XRD pattern of the pellet annealed at 500 °C shows diffraction peaks consistent with occurrence of the K0.5Na0.5NbO3 phase (JPCDS # 71-0946) of space group Amm2 also referred in literature as KNN05.
The Rietveld analysis applied to the experimental profile allows to estimate, with a discrete confidence (Rwp = 4.72 %), the cell parameters of the orthorhombic cell, the average crystallite size and microstrain. Microstructure and crystal structure parameters are reported in Table 1.
As confirmed by X-ray diffraction analysis, a “good” crystalline K0.5Na0.5NbO3 (<D> = 590 Å) can be obtained by the as-reported sol-gel route after annealing at 500 °C or above. A similar result, in terms of low calcination temperature, was obtained by Stavber and co-authors, which produced pure KNN (K:Na =1) starting from ammonium niobium oxo-tris(oxalate) monohydrate and potassium and sodium nitrate.[31] Recently, also Rani et al. synthesized K0.5Na0.5NbO3 powders by sol-method but, at the same temperature of calcination of 500 °C, the final product showed a lower crystallinity (average size domain extension ≈ 240 Å) accompanied by the presence of an undesired secondary phase (K3Nb6O17).[25]
In order to better clarify the effect of the citric acid and to optimize its use in the synthesis of the KNN systems, a second pellet was prepared decreasing the amount of the chelating agent (0.2 g). SEM images of this KNN system heated at 350 °C and 500 °C, are shown if Figure 5 (A) and (B), respectively.
Similarly to the previous sample, the largest pores (~ 2 μm) observed in the powder heated to 350 °C (Figure 5 A), completely vanished when the powder was compacted and calcined at 500 °C (Figure 5 B). For this sample, the surface morphology of the pellet appears covered by big particles with a reduced number of pores. The X-ray diffraction analysis conducted on the ceramic disk and depicted in Figure 6, reveals a sequence of reflections similar to that already observed for the first sample (Figure 4). However, just the tetragonal structure with space group P4/mm associated to the K0.3Na0.7NbO3 phase (JPCDS Card # 74-2459), according to literature also referred to as KNN03,
yields the best fit with a satisfactory Rwp of 3.73 %.
The values of cell parameters, determined after the fit to be a = 3.9742 Å and c = 3.9806 Å, respectively, are slightly different from those given by Baker et al. [38], to the point that the cell can be regarded as nearly cubic phase. However, the worst fit obtained with the Pm-3m space group (Rwp cub
= 6.2%) should exclude the main occurrence of this structural habit.[48,49] An average crystallite size of 200 Å was obtained, roughly three times smaller than that estimated in the as-synthesized K0.5Na0.5NbO3 system. The refined lattice parameters, average crystallite size extension and average microstrain are reported in Table 2.
The different phase stoichiometry obtained from the solution prepared with 0.2 g of citric acid, despite the initial K-Na ratio of 1, suggests that a significant amount of K ions was not involved in the first steps of the reaction. It is well known that the K ions tend to easily evaporate, as K2O, during the calcination treatment, leading to a non-stoichiometric synthesis.[11,40,50] In fact, in the solid-state route, for compensating the K-volatilization process, extra source of potassium is typically added to the starting materials. Considering that the same final temperature of 500 C° was used for the calcination of the pellets, the low amount of citric acid may not adequately stabilize the metal ions in the initial solution and then favouring their partial precipitation. This observation can be supported by different 1
studies which demonstrated that a different ratio of the chelating agents, significantly influenced the stability of the metal ions in the solution.[24,28] A study conducted by Shafer at al., devoted to the synthesis of PZT by sol-gel combusted process, underlined that there is a critical content of citric acid
below which the precipitation could not be avoided.[51] 3.2 Piezoelectric characterization
In Figure 7 A, a representative topography image (7x7 μm) of the K0.5Na0.5NbO3 sample calcinated
at 500°C is shown. The surface morphology appears quite homogeneous in agreement with the SEM micrograph reported in Figure 3 B. The surface potential (Figure 7 B) as measured by KPFM visualized on the same zone, evidenced a considerable degree of homogeneity within two main distinct
domains (violet and yellow/orange) with a difference on the respective work functions of only a few
tens of mV.
Figure 8 shows the topography, amplitude and phase obtained by the Vertical PFM (VPFM) inspection of the K0.5Na0.5NbO3sample measured in DART mode. The top of the K0.5Na0.5NbO3grains
can be associated to the bright areas in topography picture (Figure 8 A) corresponding to regions with the highest piezo response (PR). Furthermore, the local electromechanical response is considerably suppressed in the proximity of the grain boundaries (GB), evidenced in Figure 8 B as the dark perimeters around the domains. The PFM phase map (Figure 8 C) presents different domains with a phase distribution centered mainly around two values (yellow and purple), with a phase contrast of up to 180º. The combination of the amplitude and phase images is coherent with the presence of ferroelectric grains with a distribution of polarization vectors on different directions. Since we are only sensitive to the out of plane signal, grains with a higher degree of polarization tilting with respect to the surface normal will give a weaker VPFM signal. If we concentrate on the grains with a higher PFM amplitude (blue areas), it is possible to assign a polarization predominantly out of plane pointing up for the ones with yellow PFM phase contrast and a polarization pointing down for the ones with purple PFM phase contrast. The maximum of the PFM amplitude corresponds to a sample surface displacement of 160 pm, as measured with an applied ac voltage of 2V, which gives an effective piezoelectric coefficient value of d33eff = 80 pm/V. This value is in agreement with the results obtained, 1
for example, in the pressureless sintered un-doped KNN ceramics (70 – 15 pm/V).[52,53,50] However, such values are clearly below the d33 coefficient values resulted from spark plasma sintered (148 pm/V) and hot pressed (160 pm/V) KNN materials,[54,12] and quite far from the giant d33 achieved in KNN doped systems (360 - 452 pm/V).[55,56]
PFM hysteresis measurements were conducted on different points at different grain positions. It was not possible to switch the polarization direction by applying ac voltages up to 10 V as also confirmed by the absence of hysteresis in the loops, placing possible ferroelectric coercive fields above this value.
Surface analysis on the surface of the K0.3Na0.7NbO3 calcinated at 500°C disk is provided by KPFM
measurements reported in Figure 9. From the topography map (Figure 9 A) it emerges the presence of grains with different dimension and shape that are about one order of magnitude bigger than the ones for K0.5Na0.5NbO3. The surface potential map (Figure 9 B) clearly shows two zones with significant
difference in work function (~100 mV), that can be related to either a local charging effect or different crystalline planes of the grains. These two easy distinct regions have been characterized by VPFM and two distinct behaviours have been detected as shown in Figure 10. The bright area of the KPFM image shows worm-like features in the VPFM signal (Figure 10 A-B-C) that can be attributed to topography cross-talk as shown by the strong correlation observed in Figure 10 B and C), while in areas with dark KPFM, it is possible to observe different stripe shaped configurations (Figure 10 C-D-E). The presence of two different crystalline phases was excluded by the X-ray diffraction analysis performed on the calcined disk (Figure 6). However, it appears evident that the microstructure of the bright area is still porous while the structure of the dark kelvin area is already solid. This may correspond to grains that have not been completely growth upon the thermal annealing at 500 °C.
Comparison between the amplitude PFM images of the different areas still give a coherent homogeneous value for all of them, with an average around 1.4 pm of surface effective displacement under an applied ac field of 2V, an effective piezoelectric coefficient value of d33eff = 0.7 pm/V, and
almost no phase contrast among the stripe domains. This result is coherent with the absence of ferroelectric polarization out of plane, but still, it is obvious that there is a parallel stripe nanodomains 1
structure in the plane, maybe correlated with in-plane polarization or with the presence of ferroelastic domains. Finally, PFM hysteresis loops show no hysteresis and it is not possible to switch the polarization out of plain for voltages up to 10 V. It is important to note that for the K0.3Na0.7NbO3
sample, the surfaces of the grains where almost flat on the 1 m scale as compared with the K0.5Na0.5NbO3 sample, for which the average diameter of the grains was ~200 nm. This different
characteristic sizes might strongly determine the possible ferroelectric properties of the samples and domains configuration, i.e., favoring the conformation of single domain grains for the K0.5Na0.5NbO3
sample and promoting the appearance of multidomain configuration for the microblocks of K0.3Na0.7NbO3. Although the result for K0.3Na0.7NbO3 is quite encouraging if compared with d33
reported values of also low magnitude for a KNN system prepared by sol-gel route at very high temperature of 650°C-1100 °C, it results almost about two orders of magnitude smaller than those obtained in the K0.5Na0.5NbO3 system presented in this work.[57] The reasons of such considerable
difference of the piezo response observed in the two specimens may be ascribed to the large difference of symmetry of the two structures. While both compounds are non-centrosymmetric, the P4/mm tetragonal phase is nearly cubic (of space group Pm-3m) owing to the similarities of the a and b lattice parameters with c (see Table 2). In this case the six oxygens surrounding niobium ions are making an almost regular octahedron. Conversely, in the Amm2 orthorhombic structure (Table 1), the Nb atoms are inside octahedral coordination where six the oxygen atoms at the apices are subjected to distortion due to different Nb-O distances allowed by the space group symmetry.
A structural/microstructural origin could also be a further reason for this significant difference occurred between the d33 values of the KNN system syntheses. In particular, larger crystallinity (<D>
= ~ 600 Å) and near MPB composition (0.5) play a crucial role in the enhancement of the piezoelectric response in the K0.5Na0.5NbO3 system. However, further investigations are necessary to better
understand and evaluate the impact of further parameters on the PR improving such as the domains wall pinning, defects and dislocations contributions.
4. Conclusion
In summary, a versatile, efficient and cost-effective sol-gel method for the preparation of the K0.5Na0.5NbO3 powders, has been presented. This method uses, for the first time by our knowledge,
potassium acetate, sodium acetate and ammonium niobate oxalate monohydrate as K, Na and Nb water soluble metals sources. Citric acid is introduced as chelating and polymerization agent and its amount results crucial to stabilize the niobium metal ions in the solution. The addition of a critical amount of the citric acid (2g) provides, in fact, an excellent control of the chemical composition of the final KNN piezoceramic. The calcination of the powders at 500 °C, leads to the formation of the single-phase orthorhombic K0.5Na0.5NbO3 compound with a good crystallinity (average size 590 Å) and a desired
chemical composition, which contribute positively to the large local piezo response observed by VPFM. The piezoelectric coefficient d33 of ~80 pm/V, derived by PFM spectroscopy analysis on the
local domains, results comparable with the values estimated in the most performing hot-pressed KNN materials, but with the advantage of synthesis at lower temperature. On the other hand, the powders prepared with a lower amount of citric acid (0.2 g), upon calcination at 500 °C, crystallize in the potassium-poor tetragonal phase K0.3Na0.7NbO3. PFM spectroscopy measurements performed on this
sample, reveal a local piezo response of d33 of less than 1 pm/V, which results by far lower if compared
with K0.5Na0.5NbO3, but closer to many values obtained for un-doped KNN ceramics prepared by
sol-gel route.
Acknowledgment. This work has been partially funded by the H2020-MSCA-IF-2015 grant number #707954.The activity of N. Senes is supported by a PhD program in a collaborative scheme between the University of Sassari and Cagliari of Italy, which is especially endorsed by Autonomous Regional Administration of Sardinia (RAS). The authors acknowledge the support of the “Servizi di Ateneo per la Ricerca (CeSAR)” of the Sassari University where preliminary XRD experiments, using the Rigaku Smart Lab rotating anode diffractometer, and SEM analyses, were conducted. Financial support was obtained under project from the Spanish Ministerio de Economía y Competitividad 1
(MINECO) under project FIS2015-73932-JIN. ICN2 acknowledges support from the Severo Ochoa Program (MINECO, Grant No. SEV-2013-0295). All the Authors contributed equally to this work. 1
References
[1] J. Holterman, P. Groen, An introduction to Piezoelectric Materials and Applications, Stichting Applied Piezo, P.O. Box 4176 7320 AD Apeldoorn, The Netherlands 2013.
[2] Y. Xu, Ferroelectric materials and their applications, Elsevier, Amsterdam 1991. [3] Piezo System Inc., Cambridge, MA, USA, Product literature 2002.
[4] C. H. Hong, H. P. Kim, B. Y. Choi, H. S. Han, J. S. Son, C. W. Ahn, W. Jo, J. Mater. 2016, 2, 1.
[5] EU-Directive 2002/95/EC: Restriction of the use of certain hazardous substances in electrical and electronic equipment (RoHS), Offic. J. Europ. Union. 2003, 46-L37, 19-23.
[6] J. Rodel, W. Jo, K. T. P. Seifert, E. M. Anton, T. Granzow, D. Damjanovic, J. Am. Cer. Soc.
2009, 92, 1153.
[7] J. Wu, D. Xiao, J. Xhu, Chem. Rev. 2015, 115, 2559.
[8] Y. Saito, H. Takao, T. Tani, T. Nonoyama, K. Takatori, T. Homma, T. Nagaya, M. Nakamura, Nature 2004, 432, 84.
[9] H. Tian, C. Hu, X. Meng, Z. Zhou, G.Shi, J. Mater. Chem. C 2015, 3, 9609. [10] P. Dubernet, J. Ravez, Ferroelectrics 1998, 211, 51.
[11] B. Jaffe, W. R. Cook Jr., H. Jaffe, Piezoelectric Ceramics, Academic Press, London and New York 1971.
[12] R. E. Jaeger, L. Egerton, J. Amer. Ceram. Soc. 1962, 45, 209.
[13] H. Birol, D. Damjanovic, N. Setter, J. Europ. Ceram. Soc. 2006, 26, 861.
[14] S. Priya, S. Nahm, Lead-Free Piezoelectrics, Springer, New York Dordrecht Heidelberg London 2012.
[15] T. Iamsasri, G. Tutuncu, C. Uthaisar, S. Pojprapai, J. L. Jones, J. Mater. Sci. 2013, 48, 6905. [16] Y. Ge, Y. Hou, M. Zhu, H. Wang, H. Yan, Chem. Commun. 2008, 41, 5137.
[17] Q. Yu, J. F. Li, Y. Chen, L. Q. Cheng, W. Sun, Z. Zhou, Z. Wang, J. Am. Ceram. Soc. 2014, 97, 107.
[18] Jalalian, A. M. Grishin, Applied Physics Letters 2012, 100, 012904. 1
[19] Y.D. Hou, M.K. Zhu, L. Hou, J.B. Liu, J.L. Tang, H. Wang, H. Yan, J. Cryst.Growth 2005, 273, 500.
[20] D. Bao, A.X. Kuang, H.S. Gu, Phys. Stat. Sol. (a), 1997, 163, 67.
[21] Chowdhury, J. Bould, M.G.S. Londesborough, S.J. Milne, Chem. Mater. 2010, 22, 3862. [22] L. Wang, W. Ren, K. Yao, P. C. Goh, P. Shi, X. Wu, X. Ya, J. Am. Ceram. Soc. 2010, 93,
3686.
[23] K. Kakimoto, Y. Hayakawa, I. Kagomiya, J. Am. Ceram. Soc. 2010, 93, 2423.
[24] D. Q. Zhang, Z. C. Qin, X. Y. Yang, H. B. Zhu, M. S. Cao, J. Sol-Gel Sci Technol. 2011, 57, 31.
[25] R. Rani, S. Sharma, M. Quaglio, R. Rai, S. Bianco, D. Pugliese, C. F. Pirri, Materials Scienc. Applicat. 2017, 8, 247.
[26] J. Fang, X. Wang, L. Li, Phys. Stat. Sol. 2012, 6, 132. [27] Y. Li, J. Zhao, B. Wang, Mater Res Bull. 2004, 39, 365.
[28] Y. Cao, K. Zhu, H. Zheng, J. Qiu, H. Gu, Particuology 2012, 10, 777. [29] M. Liu, D. Xue, K. Li, J. Alloys Compounds 2008, 449, 326.
[30] Chowdhury, S. O’Callaghan, T. A. Skidmore, C. James, S. J. Milne, J. Am. Ceram. Soc. 2009, 92, 758.
[31] G. Stavber, B. Malic, M. Kosec, Green Chem. 2011, 13, 1303.
[32] C. Yerlikaya, N. Ullah, A. R. Kamali, R. V. Kumar, J. Therm. Anal. Calorim. 2016, 125, 17. [33] M. N. Silva, X. Kong, R. C. Hider, BioMetals 2009, 22, 771.
[34] L.L. Yao, L. X. Ji, K. J. Zhu, J. Wang, J. S. Liu, J. H. Qiu, Ener. Harvest. and Syst. 2015, 2, 149.
[35] Y. Hou, C. Wang, J. Zhao, H. Ge, M. Zhu, H. Yan, Mater. Chem. and Phys. 2012, 134, 518. [36] C. Wang, Y. D. Hou, H. Y. Ge, M. K. Zhu, H. Yan, J. Europ. Ceram. Soc. 2010, 30, 1725. [37] K. A. Singh, L. C. Pathak, S. K. Roy, Ceramics International 2007, 33, 1463.
[38] F. Deganello, G. Marcì, G. Deganello, J. Europ. Ceram. Soc. 2009, 29, 439. [39] Y. Li, L. Xue, L. Fan, Y. Yan, J. Alloy Compounds 2009, 478, 96.
[40] H. Du, Z. Li, F. Tang, S. Qu, Z. Pei, W. Zhou, Mater. Science and Engin. B 2006, 131, 83. [41] M. P. Pechini, (US Patent), US3330697, 1967.
[42] L. Lutterotti, S. Matthies, H.-R. Wenk, A.J. Schultz, J. Richardson, J. Appl. Phys. 1997, 81, 594.
[43] K. Momma, F. Izumi, J. Appl. Crystallogr. 2011, 44, 1272.
[44] D. Bayot, M. Devillers, Coordination Chemistry Reviews 2006, 250, 2610. [45] Y. Narendar, G. L. Messing, Chem. Mater. 1997, 9, 580.
[46] L. Yao, K. Zhu, Mod. Phys. Lett. B 2016, 30, 1650157.
[47] R. López-Juárez, R. Castañeda-Guzmán, M. E. Villafuerte-Castrejón, Ceramics Intern. 2014, 40, 14757.
[48] D. W. Baker, P.A. Thomas, N. Zhang, A. M. Glazer, Acta Crystal. Section B 2009, 65, 22. [49] L. Liu, M. Knapp, H. Ehrenberg, L. Fang, L. A. Schmitt, H. Fuess, M. Hoelzel, M.
Hinterstein, J. Appl. Cryst. 2016, 49, 574.
[50] R. Zuo, J. Rödel, R. Chen, L. Li, J. Am. Ceram. Soc. 2006, 89, 2010.
[51] J. Schafer, W. Sigmund, S. Roy, F. Aldinger, J. Mater. Resear. 1997, 12, 2518. [52] H. Birol, D. Damjanovic, N. Setter, J. Eur. Ceram. Soc. 2006, 26, 861.
[53] H. Y. Park, J. Y. Choi, M. K. Choi, K. H. Cho, S. Nahm, J. Am. Ceram. Soc. 2008, 91, 2374. [54] K. Wang, B. P. Zhang, J. F. Li, L. M. Zhang, J. Electroceram. 2008, 21, 251.
[55] T. Zheng, H. Wu, Y. Yuan, X. Lv, Q. Li, T. Men, C. Zhao, D. Xiao, J. Wu, K. Wang, J. F. Li, Y. Gu, J. Zhua, S. J. Pennycook, Energy Environ. Sci. 2017, 10, 528.
[56] R. Gao, X. Chu, Y. Huan, X. Wang, L. Li, Phys. Status Solidi A 2014, 211, 2378. [57] F. Shöderlind, P.O. Kall, U. Helmersson, J. Crystal. Growth 2005, 281, 468.
Figure
Figure 1. Flowchart of the synthesis of the KNN powders. ANO: ammonium niobium oxalate monohydrate.
Figure 2. Schematization of the experimental set-up used for the SKPM and PFM measurements.
Figure 3. SEM micrographs of the K0.5Na0.5NbO3 powders prepared by 2 g of citric acid and calcinated to 350 °C (A) and disk calcinated at 500 °C (B).
Figure 4. Experimental XRD pattern (blue squares) and the Rietveld refinement profile (red line) of the KNN ceramic (K: Na = 1) prepared with 2 g of citric acid and calcinated at 500 °C. Inset: projections of the K0.5Na0.5NbO3 structure viewed along the b and c axis. Yellow spheres correspond to the alkali-earth cations, each occupied 50%, while green distorted octahedra are composed by oxygens (red spheres) surrounding Nb cations (grey spheres).
Figure 5. SEM micrographs of the K0.5Na0.5NbO3 powders prepared by 0.2 g of citric acid and calcinated to 350 °C (A) and 500 C (B).
Figure 6. Experimental XRD pattern (blue squares) and the Rietveld refinement profile (red line) of the KNN ceramic prepared with 0.2 g of citric acid and calcinated at 500ºC. Inset: projections of the K0.3Na0.7NbO3 structure viewed along the a and c axis. Yellow spheres correspond to the alkali-earth cations, each occupied 50%, while green distorted octahedra are composed by oxygens (red spheres) surrounding Nb cations (grey spheres).
Figure 7. A) Topography, and B) KPFM image corresponding the changes of the surface work function selected area of the K0.5Na0.5NbO3 disk. Topography shows a grain distribution with and average diameter size of about 200 nm. Kelvin contrast is kept below 30 mV, indicating a quite homogeneous composition of the material.
Figure 8. A) Topography of a selected area (1x1µm) of the K0.5Na0.5NbO3 disk. B) 3D image of the topography with overlaped PFM Amplitude as the color scale and C) 3D topography with the PFM Phase as the colour scale.
Figure 9. A) Topography, and B) KPFM image corresponding the changes of the surface work function selected area of the K0.3Na0.7NbO3 disk. Topography shows a grain distribution with and average diameter size of several microns, one order of magnitude bigger than the observed grain distribution of the previous sample. Strong Kelvin contrast denotes a phase segregation for different areas of this sample.
Figure 10. Topography of two different areas of the K0.3Na0.7NbO3 disk A) bright kelvin contrast and D) dark kelvin contrast. B) and E) are 3D images of the topography with overlaped PFM Amplitude as the color scale and C) and F) are 3D topographies with the PFM Phase as the colour scale.
Table
Table 1. Crystallite size, microstrain, lattice cell parameters and z fractional coordinates for the atomic species, derived by the Rietveld refinement applied to the system prepared with 2 g of citric acid and annealed at 500 °C.
Phase a (Å) b (Å) c (Å) Crystallite Size (Å)
K0.5Na0.5NbO3
(KNN05), Amm2
3.9475 5.6267 5.6633 590
z(Na, K) zNb zO1 zO2
z fractional
coordinates 0.009 0.529 0.536 0.232
Table 2. Crystallite size, microstrain, lattice cell parameters and z fractional coordinates for the atomic species, derived by the Rietveld refinement applied to the system prepared with 0.2 g of citric acid and annealed at 500 °C.
Phase a (Å) b (Å) c (Å) Crystallite Size (Å)
K0.3Na0.7NbO3
(KNN03), P4/mm
3.9742 / 3.9806 200
z(Na, K) zNb zO1 zO2
z fractional
coordinates 0.890 0.335 0.740 0.0335
Table of Contents
Potassium sodium niobate, KNN, powders have been efficiently synthesized by a versatile and
cost-effective sol-gel method exploiting water soluble metal sources and citric acid. The systems calcined at 500 °C, have been structurally characterized by X-ray diffraction and scanning electron microscopy. The KNN system with a chemical composition K0.5Na0.5NbO3 shows a good crystallinity
and a large local piezoresponse measured by Vertical Piezoresponse Force Microscopy (VPFM).
Keyword
Piezoceramics, Potassium Sodium Niobate, Modified-Pechini method, Piezoresponse Force microscopy, X-ray diffraction
Nina Senes*, Antonio Iacomini, Neus Domingo, Stefano Enzo, Gabriele Mulas, Santiago Cuesta-Lopez, Sebastiano Garroni*
Title Local piezoelectric behavior of potassium sodium niobate prepared by a facile synthesis via water soluble precursors