Predicting the decrease of engagement indicators in a
MOOC
Miguel L. Bote-Lorenzo
GSIC-EMIC Research Group Universidad de Valladolid, Spainmiguel.bote@tel.uva.es
Eduardo Gómez-Sánchez
GSIC-EMIC Research Group Universidad de Valladolid, Spainedugom@tel.uva.es
ABSTRACT
Predicting the decrease of students’ engagement in typical MOOC tasks such as watching lecture videos or submitting assignments is key to trigger timely interventions in order to try to avoid the disengagement before it takes place. This paper proposes an approach to build the necessary predictive models using students’ data that becomes available during a course. The approach was employed in an experimental study to predict the decrease of three different engagement indicators in a MOOC. The results suggest its feasibility with values of area under the curve for different predictors ranging from 0.718 to 0.914.
CCS Concepts
•Information systems Clustering analysis and classification • Applied computing E-learning.
Keywords
MOOC; engagement; supervised machine learning.
1. INTRODUCTION
Academic engagement is a concept that refers to the observable behaviors directly related to the learning process that are exhibited by students participating in course work such as, for instance, attentiveness and assignment completion [8]. The study of the academic engagement of students in Massive Open Online Courses (MOOCs) has already been tackled from different perspectives in the literature [1, 2, 6, 7, 14, 17, 18]. With this aim, various engagement indicators that describe different observable behaviors of MOOC students were employed. Examples of such engagement indicators include the number of lecture videos watched, the number of submitted assignments or the number of posts created by each student.
The analyses of the evolution of engagement indicators along the course has revealed the existence of different patterns of engagement among MOOC students [6, 7, 14, 17, 18]. For example, the learners that follow the so called “completing” or “all-rounders” pattern [2, 6, 7, 14] have high values in the assignment engagement indicators along the course, while those belonging to the “auditing” or “viewers” group [2, 14] show low values in assignment engagement indicators and high ones in video engagement indicators along the course. Interestingly, [14] discovered that the participants of these two groups reported
similarly high levels of satisfaction with their overall experience in the course, which suggests the existence of different ways in which a MOOC can fulfill learner needs.
Another important finding is that the values of engagement indicators of many MOOC students decay over time often leading to dropping out [1, 6, 7, 14, 17, 18]. As a consequence, the educational impact that the MOOC has in these disengaging learners is reduced, even if they do not eventually drop out. This is the reason why it is important to maintain and cultivate student engagement in MOOCs [17].
The identification of students with engagement indicators that are expected to decrease in the near future would allow making interventions aimed at preventing it. For example, the suggestion of an interesting lecture video or a hint to solve an assignment could be provided to a learner if a decrease in her video or assignment engagement indicator has been predicted, respectively. These interventions would thus help to maintain the engagement of students.
This paper proposes an approach to predict the decrease of engagement indicators in MOOCs using the students’ data about their activity in the course that is available at the moment in which the prediction must be made. It also presents the results of an empirical study in which the proposed approach was employed to make predictions of three different engagement indicators within the context of a MOOC delivered in the edX platform.
The rest of this papers is organized as follows. Section 2 discusses the related work that can be found in the literature. Next, section 3 provides a more detailed description of the problem of predicting the decrease of engagement indicators and proposes an approach to tackle it. Section 4 presents the experimental study that was carried out to verify the feasibility of the proposed approach. The proposed approach is discussed in regard to the results of the experimental study in section 5. Finally, section 6 includes the main conclusions of the paper and presents future work.
2. RELATED WORK
There are some works in the literature that have tackled the detection of disengagement in students within the context of different learning systems such as intelligent tutoring systems [3, 15] or learning management systems [5]. In these cases, the proposed solutions aim at predicting the engagement states in which the students will be in the near feature. However, this paper proposes an approach to predict the decrease of the individual indicators that can be used to define such engagement states. Other contributions such as [4, 9, 20, 21] deal with the problem of predicting whether a student will eventually drop out a MOOC in order to enable the possibility of making an early intervention to try to avoid it. There are also other works such as [11, 13, 18] that focus on detecting if a student is likely to fail the course so that, again, an intervention can be made to try to prevent this situation. The ultimate goal in both cases is thus different to that of the
problem of predicting the decrease of engagement indicators, which is maintaining the engagement of students with the different activities that can be carried out in MOOCs. This should help not only to have more students that pass the course or that do not drop out, but also to avoid the decrease of the educational impact that the course might have on students even if they participate in different ways that might fulfill their needs.
3. PREDICTING THE DECREASE OF
ENGAGEMENT INDICATORS
3.1
Problem formulation
MOOCs are typically structured as a sequence of chapters. In many cases the learning materials corresponding to each chapter are released along the course on a regular basis. The date in which such release takes place can be considered the chapter start. Chapters usually include assignments that must be submitted before a deadline that determines the chapter end.
Students are normally expected to perform different types of tasks such as video watching or submitting assignments using the learning materials of every MOOC chapters. It is possible to define an indicator that quantifies the engagement of a student with a given type of task from the beginning of the course until the moment in which the indicator is computed. For example, an assignment engagement indicator could be obtained by averaging the percentage of assignments submitted in each chapter that has already ended. Clearly, the value of an engagement indicator defined in this way can increase or decrease at the end of every new chapter depending on work performed by the student in the tasks of the previous one.
Considering a course with c chapters, and given the learner activity in the MOOC until the end of chapter i, the prediction of the decrease of an engagement indicator tries to determine whether its value at the end of chapter i+1 will be lower or not than its value at the end of chapter i. Making this prediction in real time within the context of a MOOC gives a great opportunity to make interventions aimed at avoiding student disengagement in the type of task used to define the indicator.
3.2
Proposed approach
A model to predict the decrease of a given engagement indicator at the end of chapter i+1 can be built using data available in the MOOC platform at the end of chapter i provided that i≥2. More specifically, the predictive model can be generated using a training set consisting of input vectors that describe the learners’ activity until the end of chapter i-1 and output labels stating whether the value of the engagement indicator decreased at the end of chapter i with respect to the end of chapter i-1 or not (i.e. labels with true and false values, respectively). This model can then be used to predict the decrease of the engagement indicator at the end of chapter i+1 with data also available at the end of chapter i. In this case, the predictions would be obtained by using vectors describing the learners’ activity until the end of chapter i
as inputs for the predictive model.
The proposed approach thus assumes that the same set of features that describe the students’ activity can be computed for both chapters i-1 and i while the value, and that the target engagement indicator can be also calculated for these chapters. Furthermore, it requires each feature to be in the same range in both chapters i-1
and i so that features are comparable across chapters. For example, the variable percentage of submitted assignments can be compared in different chapters, but not the number of submitted assignments since the total number of requested assignments may vary from one chapter to another.
4. EXPERIMENTAL STUDY
4.1
Course description
The data employed in the experimental study was obtained from the MOOC “6.002x Circuits and Electronics” that was offered on edX in the spring of 2013 [19]. The course was structured in 14 chapters and included a midterm and a final exam.
The main contents of every chapter are explained in two sequences of lecture videos interspersed with short and simple comprehension questions called finger exercises. Chapters 1 to 12 also comprised two types of assignments: homework problems that included numerical and formula responses, and lab exercises based on an interactive circuit simulator. In addition, most chapters provided optional tutorial videos that helped reinforcing concepts by showing how to solve circuit problems or illustrating interesting principles. The chapter learning materials were supplemented by on-line sections of the course textbook, a forum where students and staff could engage in discussions, a staff-student editable wiki, and ungraded access to the interactive circuit simulator.
The course schedule comprised 15 calendar weeks. A chapter was released every Monday except for week 1, when it was made on Wednesday, and week 8, in which the midterm exam took place and there was no chapter release. The final exam was made in the last week of the course. The deadline for the submission of the assignments included in each of the first 12 chapter was set for the second Sunday after the corresponding chapter release, except in the case of chapter 7, in which it was the third Sunday also due to the occurrence of the midterm exam. This implies that the deadline for the assignments of a given chapter always took place nearly one week after the release date of the next chapter.
Final course grades were based on homework sets (15%), online laboratories (15%), a midterm (30%) and a final exam (40%). Each chapter had a homework grade and a lab grade. The homework and laboratories grades used in the final course grades were obtained by adding the highest 10 out of 12 chapter grades. Students with a final grade of 50% or greater received a certificate of accomplishment.
There were 26,947 students enrolled in the course by the deadline established for the submission of the final exam. Out of these, only 6,752 watched at least a lecture video or answered at least a finger exercise or submitted at least an assignment in one of the first 12 chapters before the corresponding deadline. A certificate of accomplishment was granted to 1,099 students.
4.2
Datasets
A different engagement indicator was defined for each of the three main tasks that students were expected to carry out in the course: watching lecture videos, answering finger exercises and submitting assignments. The video engagement indicator was obtained by averaging the percentages of lecture videos that were totally or partially watched by a student in every chapter before reaching its end. The exercise engagement indicator was computed by averaging the percentages of finger exercises answered by a student in every chapter before its end. The assignment engagement indicator was calculated by averaging the percentages of assignments submitted in each chapter that has already ended.
for every student whether the value of each of her engagement indicators decreased at the end of chapters 2 to 12 with respect to the end of the previous chapter.
Table 1 summarizes the 16 features that were computed for every student at the end of each of the first 11 chapters. It can be noticed that every feature was defined so that its range of values is the same across chapters. It is also worth mentioning that the existence of features related to chapter i+1 calculated at the end of chapter i is possible since, as explained in the previous subsection, the end of every chapters 1 to 12 took place nearly one week after the start of the next chapter. Interestingly, a value of 0 or a negative value in f14, f15, or f16 implies that the corresponding engagement indicator will not decrease by the end of chapter i+1
since the learner has already done enough work by the end chapter
i as to assure it.
Table 1. Features derived at the end of each chapter i.
f1 Percentage of lecture videos totally or partially watched in chapter i
f2 Percentage offinger exercises answered in chapter i f3 Percentage of assignments submitted in chapter i f4 Normalized grade of finger exercises in chapter i f5 Normalized grade of assignments in chapter i f6 Value of video engagement indicator
f7 Value of exercise engagement indicator
f8 Value of assignment engagement indicator
f9 Normalized total grade of finger exercises in chapters 1 to i
f10Normalized total grade of assignments in chapters 1 to i
f11Percentage of lecture videos totally or partially watched in chapter i+1
f12Percentage offinger exercises answered in chapter i+1 f13Percentage of assignments submitted in chapter i+1 f14Difference between value of video engagement indicator
and percentage of lecture videos totally or partially watched in chapter i+1 (f6-f11)
f15Difference between value of exercise engagement indicator and percentage of finger exercises answered in chapter i+1
(f7-f12)
f16Difference between value of assignment engagement indicator and percentage of assignments answered in chapter i+1 (f8-f13)
A dataset was created for each engagement indicator and chapters 1 to 11. Each dataset contains the students’ feature vectors computed at the end of a given chapter along with the corresponding label stating whether the engagement indicator decreased or not at the end of the next chapter after filtering out two types of samples. First, samples in which it is already known at the end of a given chapter that the target engagement will not decrease at the end of the next chapter, since there is no need to make any prediction. Second, samples from students who have not watched any lecture video, answered any finger exercise of submitted any assignment in the last three chapters since it is assumed that they have dropped out. Table 2 shows the number of samples included in each dataset.
It must be noticed that the fact that chapters 13 and 14 did not include any assignment implies not only that the assignment engagement indicator cannot be computed, but also that a chapter end cannot be defined according to our problem formulation. This also entails that the video and exercise engagement indicators can neither be computed for such chapters. As a consequence, datasets with features gathered at the end of chapters 12 and 13 and indicators computed at the end of the same chapters 13 and 14 could not be generated.
Table 2. Number of samples in each dataset. Video
The most relevant features of the datasets generated for chapters 1 to 10 were selected using a best first forward search combined with the Correlation based Feature Selection (CFS) method [10] to evaluate the quality of feature subsets. CFS was selected because, unlike other methods, it aims not only at finding subsets with features that have high individual prediction ability, but also a low degree of redundancy among them. Furthermore, CFS is not a computationally intensive method. Feature extraction was not carried out for chapter 11 since this dataset was not going to be employed to build any predictive model but just to test one. Table 3 shows the number of datasets in which each feature was selected. The values highlighted in bolds correspond to features that were selected in more than 50% of datasets of a given type of indicator. It can be seen that all features except for f11, f13, f14
and f15 were selected in most cases for the datasets of at least one engagement indicator.
Table 3. Number of datasets in which each feature was selected.
Video
datasets Exercise datasets Assignment datasets Total
f1
4.4
Performance of classification algorithms
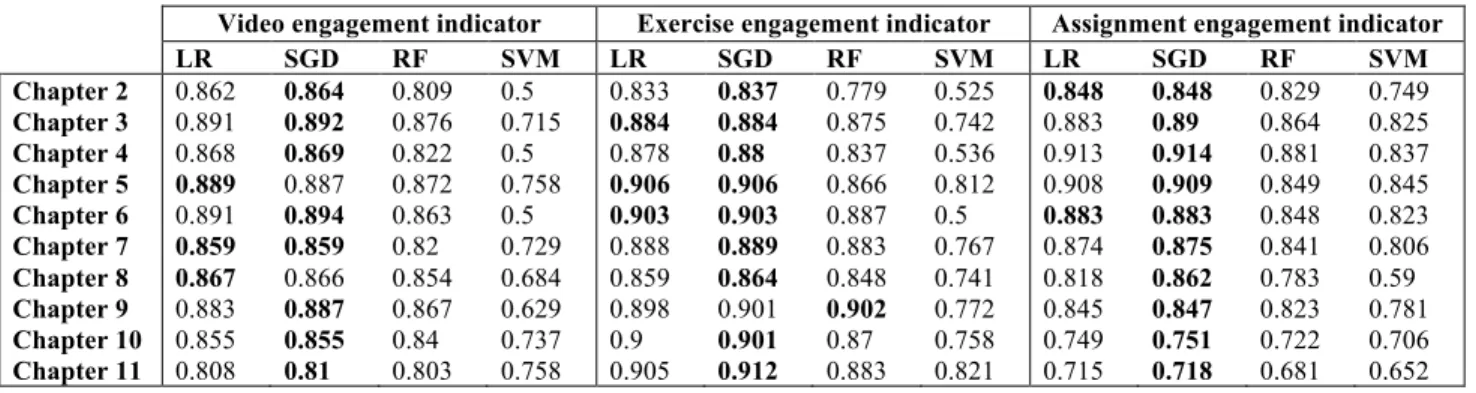
and SGD with a logistic regression loss function were used. Data were normalized for these two algorithms but not for LR and RF. In this way, predictions were made for the datasets of chapters 2 to 11 with predictive models trained with the datasets of chapters 1 to 10, respectively. The trainings were carried out using the features selected by CFS for each dataset. Obviously, the features employed in the training phase of each model were also used in the corresponding test phase. Experiments with SGD, RF and SVM were repeated 10 times using different random seeds for the algorithms and presenting the training data in random order. The results of the prediction tests are reported in Table 4 using area under the curve (AUC) as performance metric. It is important to take into account that AUC, unlike other performance metrics such as accuracy or Cohen’s kappa, is not affected by imbalanced distributions of data [12]. This is the reason why the experiments are compared using AUC, although some accuracy figures are given with an informative purpose.
The best AUC value obtained for each dataset is highlighted in bolds in Table 4. It can be observed that the best results are obtained using SGD in nearly all cases, although LR exhibits a very similar performance. SGD was able to predict the video engagement indicator with AUC values ranging from 0.81 to 0.894, exercise engagement indicator with AUC values from 0.837 to 0.906, and assignment engagement indicator with values from 0.718 to 0.914. The accuracy obtained with SGD ranged from 81.56% to 89,09% for the video engagement indicator, from 80.04% to 88.79% for the exercise engagement indicator and from 59.56% to 85.39% for the assignment engagement indicator. It is important to remember that predictions were not made for students that did not show any activity in three chapters in a row, thus avoiding the artificial improvement of the results with predictions that would have been easy to make.
It is noteworthy that the AUC values obtained in the prediction of the assignment engagement indicator for chapters 10 and 11 are engagement and had obtained high grades in all previous chapters that significantly reduced their activity in the last two chapters. It can also be mentioned that the results achieved with SGD in the prediction of the decrease of engagement indicators are comparable to the best results reported in [20] for the dropout prediction problem. However, it can be noted that the experiments described in such work, as in most contributions dealing with the dropout prediction problem [4], were made using cross validation
with data that would not have been available in the MOOC at the time in which the predictions are required. Following [4], this gives an optimistic estimation on the results that cannot be achieved with unseen data. In the experiments reported in this paper, on the contrary, the models were trained using data that would have been available at the time of making the predictions.
5.
DISCUSSION
The experimental study presented above showed that the approach proposed in this paper yielded good results in the prediction of the decrease of engagement indicators derived for the three main tasks that were carried out by students in a MOOC. As noted before, predictions were made at the end of chapters 2 to 11 using only information that was available at those moments. It is noteworthy that during the experiments, predictions were not made for obvious cases, such as students that at mid-chapter have already shown better engagement than in the previous chapter or students that can be considered to have dropped out. Adding these students would easily improve the prediction performance metrics, but would not provide any useful information in order to intervene. The proposed approach would thus have been useful to identify many students that could have benefited from an intervention aimed at preventing their disengagement.
One limitation of the proposed approach is that the first predictions cannot be made before the end of chapter 2. Predictions cannot be made at the end of chapter 1 since there are obviously no data from previous chapters that can be employed to build the predictive model. This problem would not exist in a different approach that could use data from previous editions of the course along with transfer learning techniques [16] to build predictors for chapters 1 to 11. However, such approach would have the important limitation that it could not be applied to make predictions in courses that do not have a previous edition. An alternative approach that might be worth exploring could use data from previous runs of the course, if available, and transfer learning techniques to build predictors at the end of chapter 1 and data from the ongoing course to build them at the end of the rest of the chapters.
Another limitation of the proposed approach that can be observed in the experimental study is that predictions regarding the decrease of the video and exercise engagement indicators could not be made for chapters 13 and 14. Tackling this limitation could require not only changing the definition of end of chapter so that it is only based on the deadlines for submissions. Possibly, it will also entail defining a method to build the predictors taking into account that the behavior of students in chapters that do not have assignments might be very different with respect to chapters in which they have them. Again, transfer learning techniques could be useful to build these predictors.
Table 4. Comparison of prediction performance based on area under the curve.
6.
CONCLUSIONS
Early detection of MOOC students with engagement indicators that are expected to decrease is necessary to make interventions aimed at preventing it. This paper has presented an approach to predict the decrease of engagement indicators at the end of MOOC chapters using information about students’ behavior that becomes available during the course. An experimental study was conducted to predict three engagement indicators derived for the main tasks that were carried out in a MOOC: watching lectures, solving finger exercises, and submitting assignments. It was shown that good results can be achieved for all the indicators using CFS method for feature selection and SGD algorithm for classification. This supports the idea that the proposed method would have been useful to detect disengaging students in that MOOC and suggests that it could be useful in other MOOCs too. The next steps in this research will be to evaluate the proposed approach in other MOOCs and to study its applicability to engagement indicators derived from other MOOC activities with a more social nature such as posting in forums or participating in peer reviews. The possibility of improving predictions using features that describe aspects of student participation in MOOCs other than behavior, such as motivation, will be explored. Besides, the limitation regarding the lack of predictions at the end of the first chapter or for chapters that do not include assignments will be tackled. Future work also includes the design of intervention mechanisms that could be triggered when the decrease of an engagement indicator is predicted.
7.
ACKNOWLEDGMENTS
Access to the data employed in this paper was granted by MIT's Institutional Research Office. This work has been partially funded by research projects TIN2014-53199-C3-2-R and VA277U14.
8.
REFERENCES
[1] Alario-Hoyos, C., Pérez-Sanagustín, M., Delgado-Kloos, C., Parada G, H.A. and Muñoz-Organero, M. 2014. Delving into participants’ profiles and use of social tools in MOOCs.
IEEE Trans. Learn. Technol. 7, 3 (Jan. 2014), 260–266. [2] Anderson, A., Huttenlocher, D.P., Kleinberg, J.M. and
Leskovec, J. 2014. Engaging with massive online courses.
Proceedings of the World Wide Web Conference (Seoul, Korea, Apr. 2014), 687–698.
[3] Beck, J.E. 2005. Engagement tracing: using response times to model student disengagement. Proceedings of the 12th Conference on Artificial Intelligence in Education
(Pittsburgh, PA, USA, Jul. 2005), 88–95.
[4] Boyer, S. and Veeramachaneni, K. 2015. Transfer learning for predictive models in Massive Open Online Courses.
Proceedings of the 17th Conference on Artificial Intelligence in Education (Madrid, Spain, Jun. 2015), 54–63.
[5] Cocea, M. and Weibelzahl, S. 2011. Disengagement detection in online learning: validation studies and perspectives. IEEE Trans. Learn. Technol. 4, 2 (Jan. 2011), 114–124.
[6] Ferguson, R. and Clow, D. 2015. Examining engagement: analysing learner subpopulations in Massive Open Online Courses (MOOCs). Proceedings of the 5th International Conference on Learning Analytics and Knowledge
(Poughkeepsie, NY, USA, Mar. 2015), 51–58.
[7] Ferguson, R., Clow, D., Beale, R., Cooper, A.J., Morris, N., Bayne, S. and Woodgate, A. 2015. Moving through
MOOCS: pedagogy, learning design and patterns of engagement. Proceedings of the 10th European Conference on Technology Enhanced Learning (Toledo, Spain, Nov. 2015), 70–84.
[8] Finn, J.D. and Zimmer, K.S. 2012. Student engagement: what is it? why does it matter? Handbook of Research on Student Engagement. Springer. 97–131.
[9] Halawa, S., Greene, D. and Mitchell, J. 2014. Dropout prediction in MOOCs using learner activity features.
Proceedings of the 2nd European MOOCs Stakeholders Summit (Laussane, Switzerland, Feb. 2014), 58–65. [10] Hall, M.A. 1999. Correlation-based feature selection for
machine learning. PhD dissertation. University of Waikato. [11] He, J., Bailey, J., Rubinstein, B.I.P. and Zhang, R. 2015.
Identifying at-risk students in Massive Open Online Courses.
Proceedings of the 29th Conference on Artificial Intelligence
(Austin, TX, USA, Jan. 2015), 1749–1755.
[12] Jeni, L.A., Cohn, J.F. and De la Torre, F. 2013. Facing imbalanced data-recommendations for the use of
performance metrics. Proceedings of the 5th Conference on Affective Computing and Intelligent Interaction (Geneva, Switzerland, Sep. 2013), 245–251.
[13] Jiang, S. and Warschauer, M. 2014. Predicting MOOC performance with week 1 behavior. Proceedings of the 7th International Conference on Educational Data Mining
(London, UK, Jan. 2014), 273–275.
[14] Kizilcec, R.F., Piech, C. and Schneider, E. 2013. Deconstructing disengagement: analyzing learner
subpopulations in massive open online courses. Proceedings of the 3rd International Conference on Learning Analytics and Knowledge (Leuven, Belgium, Apr. 2013), 170–179. [15] Mills, C., Bosch, N., Graesser, A. and D’Mello, S. 2014. To
quit or not to quit: predicting future behavioral
disengagement from reading patterns. Proceedings of the 12th International Conference on Intelligent Tutoring Systems (Honolulu, HI, USA, Jun. 2014), 19–28.
[16] Pan, S.J. and Yang, Q. 2010. A survey on transfer learning.
IEEE Trans. Knowl. Data Eng. 22, 10 (Jan. 2010), 1345– 1359.
[17] Ramesh, A., Goldwasser, D. and Huang, B. 2013. Modeling learner engagement in MOOCs using probabilistic soft logic.
Proceedings of the NIPS Conference, Workshop on Data Driven Education (Lake Tahoe, NV, USA, Dec. 2013). [18] Ramesh, A., Goldwasser, D., Huang, B., Daume, H., III and
Getoor, L. 2014. Uncovering hidden engagement patterns for predicting learner performance in MOOCs. Proceedings of the 1st ACM Conference on Learning at Scale (Atlanta, GA, USA, Mar. 2014), 157–158.
[19] Seaton, D.T., Reich, J., Nesterko, S.O., Mullaney, T., Waldo, J., Ho, A.D. and Chuang, I. 2014. 6.002x Circuits and Electronics - 2013 spring. MITx Working Paper #8. [20] Taylor, C., Veeramachaneni, K. and O’Reilly, U.-M. 2014.
Likely to stop? Predicting stopout in Massive Open Online Courses. arXiv preprint, arXiv:1408.3382.