Effect of thermosonication batch treatment on enzyme inactivation kinetics and other quality parameters of cloudy apple juice
A.E. Illera, M.T. Sanz, O. Benito, S. Varona, S. Beltrán, R. Melgosa, A.G. Solaesa
PII: S1466-8564(17)31225-0
DOI: https://doi.org/10.1016/j.ifset.2018.02.001
Reference: INNFOO 1921
To appear in: Innovative Food Science and Emerging Technologies Received date: 30 October 2017
Revised date: 2 February 2018 Accepted date: 2 February 2018
Please cite this article as: A.E. Illera, M.T. Sanz, O. Benito, S. Varona, S. Beltrán, R. Melgosa, A.G. Solaesa , Effect of thermosonication batch treatment on enzyme inactivation kinetics and other quality parameters of cloudy apple juice. The address for the corresponding author was captured as affiliation for all authors. Please check if appropriate. Innfoo(2017),https://doi.org/10.1016/j.ifset.2018.02.001
ACCEPTED MANUSCRIPT
Effect of thermosonication batch treatment on enzyme inactivation kinetics and
other quality parameters of cloudy apple juice.
A.E. Illera, M. T. Sanz, O. Benito, S. Varona, S. Beltrán, R. Melgosa. A. G. Solaesa
Department of Biotechnology and Food Science (Chemical Engineering Section),
University of Burgos, 09001 Burgos. Spain
Abstract
Cloudy apple juice has been treated by thermosonication in batch mode as an alternative
processing to thermal treatment. Thermosonication was found to be effective to inactivate
polyphenol oxidase; however, pectinmethylesterase was found to be more resistant. An increase
of the working ultrasound amplitude and the amount of energy supplied to the juice led to lower
enzyme residual activities.
Enzyme inactivation kinetics were determined at different temperatures (from 44 to 67 ºC).
Inactivation data were described by the first order kinetic model and the Weibull model, both
models yielding good fitting. Thermosonication treatment caused a homogenization effect
reflected in the shifting of the particle size distribution towards smaller diameters. The effect of
the nature of dissolved gases in the juice on enzyme inactivation was studied by displacing the
air dissolved in the juice by bubbling nitrogen or carbon dioxide, previous to the
thermosonication experiments. Higher inactivation rates were obtained by displacing the air with
nitrogen.
ACCEPTED MANUSCRIPT
Industrial relevance: Consumers demand of natural and fresh-like products has driven the food industry to investigate alternative technologies to replace conventional food heat treatments that
may affect food quality. Among these technologies, thermosonication treatment is an attractive
technology that can inactivate microorganisms and enzymes. This work shows that some
enzymes that cause deleterious effect on cloudy apple juice can be more effectively inactivated
by thermosonication than by thermal treatment, in the same temperature range, reducing the
damages caused by heating
Keywords: Cloudy apple juice, thermosonication, enzyme inactivation, dissolved gasses.
1. Introduction
Cloudy apple juice is a good source of bioactive compounds such as ascorbic acid, polyphenols,
and pectins. However, enzymatic browning causes serious product deterioration. One of the most
important enzymes responsible for enzymatic browning is polyphenol oxidase (PPO). PPO
catalyzes the oxidation of phenolic compounds to quinones, which will subsequently react with
other compounds to form brown pigments that reduce juice quality. Other important quality
parameter in cloudy apple juice is the cloud stability. One of the most accepted theories of cloud
loss in juices, is based on the action of pectinmethylesterase (PME). This enzyme causes pectin
demethylation that could expedite pectin precipitation with calcium ions present in the juice,
causing clarification and turbidity loss (Briongos et al., 2016)
Thermal treatments are widely used in the food industry to inactivate microorganisms and
enzymes that cause deleterious effects on foods. However, consumers demand of natural and
fresh-like products has driven the food industry to investigate alternative technologies to replace
conventional food heat treatments, wich may affect food quality in terms of nutritional and
ACCEPTED MANUSCRIPT
technology that is considered to be simple, reliable, environmentally friendly and highly
effective in achieving microbial decontamination (Dias et al., 2015). Inactivation of
microorganisms and enzymes by sonication is attributed to physical (cavitation, mechanical
effects) and chemical (formation of free radicals) effects (O’Donnell, Tiwari, Bourke, & Cullen,
2010). Inactivation of enzymes by ultrasonication has been attributed to the formation of
localized hot spots upon collapse of bubbles, shear forces created by microstreaming and shock
waves, as well as generation of free radicals through sonolysis of water (Kadkhodaee & Povey,
2008). Sonochemical activity (production of radicals) is influenced by operational parameters,
being the effect of frequency and gas addition the most significant (Gielen et al., 2016).
Furthermore, the presence of gases (air, oxygen or an inert gas) in the solution has been reported
as necessary for enzyme inactivation (Grintsevich, Adzerikho, Mrochek, & Metelitza, 2001). In
any case, enzyme inactivation mechanisms are specific to each enzyme and depend on their
amino acid composition and their conformational structure (Anaya-Esparza et al., 2017).
When ultrasound is combined with heating, the resulting technique, thermosonication (TS), is
usually more effective as preservation technique even TS temperatures being lower than those
used in thermal treatments. TS treatment has been found to be more efficient than thermal
treatment for the inactivation of different types of enzymes responsible for deterioration of fruits
and vegetable juices, among them, pectin methylesterase, PPO, lipoxygenases and peroxidases
(Baltacioglu, Bayindirli, & Severcan, 2017). Recently, Anaya Esparza et al. (Anaya-Esparza et
al., 2017) reviewed the advantages and limitations offered by the application of TS on different
fruit and vegetable juices. In this work, the effect of TS on PPO and PME inactivation in Golden Delicious cloudy apple juice has been studied. The effect of different variables, such as amount of energy transmitted to the juice, expressed as power density, PD (W/mL), ultrasoung (US)
ACCEPTED MANUSCRIPT
the effect of the nature of the dissolved gas (air, nitrogen and carbon dioxide) on enzyme
inactivation has been evaluated. No previous studies have been found in the literature regarding
the effect of this variable on fruit juices processed by TS. Finally, enzyme inactivation by TS
was compared with previous results obtained by high pressure carbon dioxide (HPCD) treatment,
as non-thermal technology (Illera et al., 2018), and with thermal treatment alone in the same
temperature range. The effect of TS on other quality parameters of cloudy apple juice, such as
particle size distribution (PSD), color and total polyphenols and hydroxymethylfurfural content
has been also determined.
2. Materials and methods
2.1 Juice preparation
Golden delicious apples were peeled, cut in cubes and submerged in a 0.3 % L-ascorbic acid solution to avoid enzymatic browning during processing. Apple cubes were wiped and
immediately squeezed with a screw juice extractor. The liqueur was filtered with 2 layers of
cheesecloth. The pH of the juice obtained was 3.89 ± 0.01 and the soluble solids content was
12.5 ± 0.1 °Brix. The juice was stored frozen at −18 °C until further use. Carbon dioxide (99.9
%) was supplied by Air Liquide S.A. (Spain). Nitrogen (98.5 %) was obtained by a Zefiro 25
LCMS nitrogen generator.
2.2 Thermosonication
A 750 W Sonics MaterialT M with a 13 mm probe was used for thermosonication. Samples were
processed at a constant ultrasound frequency of 20 kHz. Cloudy apple juice was introduced in a
thermostated vessel (Φ = 4.8 cm, V = 199 cm3) and the probe was submerged in the juice at a
constant depth of 2 cm from the bottom of the vessel. According to the manufacturer the US
amplitude is 79 m when the amplitude control is set at 100 % and the 13 mm probe can handle
ACCEPTED MANUSCRIPT
ultrasonic power density, PD, was evaluated as:
𝑃𝐷 = 𝐸
the experiments, then temperature was continuously recorded during treatment. No enzyme
inactivation was observed during the preheating time (90 s) at the initial TS temperatures
essayed in this work, from 20 to 50ºC.
The effect of the nature of the dissolved gas in the juice was also considered. Previous to the
ACCEPTED MANUSCRIPT
carbon dioxide in the sample at atmospheric pressure until oxygen concentration was below 0.4
mg/L (YSI ProODO optical dissolved oxygen meter). After that, TS experiments were
performed as previously described.
2.3 Physical-chemical analyses
2.3.1. Determination of enzyme activity
Polyphenol oxidases. PPO activity was determined by adding 100 µL of apple juice into 2.9 mL
of substrate solution consisting of a 0.05 M catechol (Sigma Aldrich) solution prepared in a 0.1
M phosphate buffer (pH 6.5). Oxidation of catechol was determined immediately by the
absorbance increase at 420 nm by using a Jasco V-750 spectrophotometer equipped with a
Peltier thermostated cell holder at 30 ºC. The PPO activity was determined by using the very first
linear part of the reaction curve (Illera et al., 2018).
Pectinmethylesterase. Samples were analyzed by using an automatic titrator system (Metrohm
Titrando). A pectin solution (1 %) (Alfa Aesar pectin citrus) was prepared in NaCl (0.3 M).
This solution was used as substrate. 50 mL of pectin solution were mixed with 1 mL of cloudy
apple juice and pH was adjusted to 7.5 with NaOH 0.005 N. During pectin hydrolysis at 30 ºC,
pH was maintained at 7.5 by adding NaOH 0.005 N. The amount of NaOH added for 15 min was
recorded. One PME activity unit (UPE) is defined as the micromoles of carboxylic groups
produced per minute and mL of juice, at pH 7.5 and 30 ºC (Briongos et al., 2016).
Relative residual activities of PPO and PME were evaluated as:
Residual activity = Enzyme specific activity after TS treatment
Enzyme specific activity before TS treatment· 100% [2]
As previously explained, during the preheating time (90s) no inactivation was observed,
therefore the enzyme activity right before TS treatment was considered to be the enzyme activity
ACCEPTED MANUSCRIPT
2.3.2. Determination of hydrogen peroxide, nitrate and nitrite formation
One of the mechanisms proposed on enzyme inactivation by US is the formation of free radicals.
In the literature, hydrogen peroxide (H2O2) formation has been determined as an estimation of
cavitation intensity (Raviyan, Zhang, & Feng, 2005). However, H2O2 generation during an
ultrasound treatment in a food system is complicated due to the presence of ions and other
colloidal components (Raviyan et al., 2005). Therefore, in this work, H2O2 generation during TS
has been determined in a citrate buffer solution at the same pH as the one of the apple juice (pH
= 3.9). Formation of nitrite and nitrate in citrate buffer solutions was also determined, since its
sonochemical formation in water has been known for a long time (Supeno & Kruus, 2000).
Different citrate buffer solutions (pH = 3.9) in the presence of dissolved air, nitrogen or carbon
dioxide, prepared as indicated in section 2.2, were thermosonicated (80 mL of solution at 60ºC)
for 20 minutes. Samples were collected at different time intervals, to determine the H2O2, nitrate
and nitrite formation during the sonication process.
H2O2 was determined spectrophotometrically by a colorimetric method based on the one
described by Mead et al. (Mead, Sutherland, & Verrall, 1976). 1 mL of solution A [1g NaOH,
33g KI, and 0.1g (NH4)6Mo7O24H2O in 500mL H2O] was mixed with 1 mL of solution B [10g
C8H5O4K in 500 mL H2O] and subsequently mixed with 2 mL of the thermosonicated buffer
solution taken at different time intervals. Absorbance at 350 nm was registered with time and it
was found that 45 min was time enough not to observe any further change in the reaction
medium color. Citrate buffer solution, not subjected to thermosonication, was used as a blank.
The concentration of H2O2 was calculated based on a standard curve at different H2O2
concentrations.
Nitrate and nitrite analysis were performed by using Dr. Lange Küvetten-Test analysis kits and a
ACCEPTED MANUSCRIPT
measurement is based on the reaction of nitrate ion with 2,6-dimethylphenol that causes the
formation of 2,6-dimethyl-4-nitrophenol. For measuring nitrites, LCK 341 kit, which is based on
the reaction of nitrite with aromatic primary amines, producing the formation of an azo dye, was
used.
2.3.3. Particle size distribution
Particle size distribution of cloudy apple juice was determined by laser diffraction at 750 nm
with a Mastersizer 2000 (Malvern® Inst., MA). Particle size distribution was calculated by the
Fraunhofer model. Size distributions (volume fractions against particle size) before and after
thermosonication treatment were calculated and the weight-average sizes expressed as:
The equivalent surface area mean diameter: D(3,2) = ∑ ncdlc3 ∑ n c
⁄ dlc2 [3]
The equivalent volume mean diameter: D(4,3) = ∑ ncdlc4 ∑ n c
⁄ dlc3 [4]
where dlc is the diameter of the particle and nc is the percentage of particles.
Other useful parameters Dv,0.9, Dv,0.1 and Dv0.5 correspond to the particle size bellow which, 90%,
10% and 50% of the particles lie respectively.
2.3.4. Color, hydroxymethyl furfural content and total polyphenol content
The cloudy apple juice color was determined by using a Beckman DU-650 spectrophotometer
with diode-array of UV–vis (Beckman Instruments). Following the CIE recommendations,
illuminant D65 (daylight source) and a 10º standard observer (perception of a human observer)
were used. L*, a* and b* values were obtained representing brightness, red to green color and
yellow to blue color. Color difference (E) and chroma (C) were evaluated as:
∆E = √(L∗before− L∗after)2+ (abefore∗ − a∗after)2+ (bbefore∗ − bafter∗ )2 [5]
ACCEPTED MANUSCRIPT
Non enzymatic browning in the juice has been measured as hydroxymethylfurfural (HMF)
content (Queiroz, da Silva, Lopes, Fialho, & Valente-Mesquita, 2011). 0.7 mL of juice were
mixed with 0.7 mL of ethanol in a 1.5 mL Eppendorf tube. The mixture was centrifuged at
12000 g for 10 min. After that, 1 mL of the supernatant was mixed with 1 mL of a trichloroacetic acid solution (734 mM) and 1 mL of a thiobarbituric acid solution (25 mM) in a closed recipient.
Samples were incubated at 40 ºC during 50 min in an agitated batch and absorbance was
measured at 443 nm. A blank was also prepared with distilled water instead of juice. A
calibration curve was prepared using different concentrations of HMF from 0.5 mg/L to 10
mg/L.
Total phenolic compounds were determined by using the Folin-Ciocalteau reagent (VWR).
100 µL of the juice were mixed with 2.8 mL of water, and subsequently with 100 µL of the
Folin-Ciocalteau reagent. After that, 2 mL of sodium carbonate 7.5% (w/v) were added and the
reaction started. Absorbance was measured after 60 minutes of reaction at 750 nm. A blank was
also prepared using water instead of juice. A calibration curve was prepared with standard
solutions of gallic acid by following the same colorimetric method.
2.4 Kinetic data analysis
The inactivation kinetic data at different TS conditions were fitted to the first-order kinetic
model and the non-linear Weibull model.
The first-order kinetic model can be written as:
ACCEPTED MANUSCRIPT
where Ao is the initial activity of the enzyme, A is the residual activity at different treatment
times, k is the inactivation rate constant at the operating conditions (min-1) and t is the treatment
time (min).
From the inactivation rate constant, the decimal reduction time (D: time needed to achieve a
90 % reduction of enzyme activity) can be evaluated. zT, defined as the temperature increase
needed for a 90% reduction of the D value, was determined as the negative reciprocal slope of
the regression line of log D as function of T:
log[𝐷1⁄𝐷2] = (𝑇2− 𝑇1) 𝑧⁄ 𝑇 [8]
Furthermore, the dependence of the inactivation constant on temperature can be expressed
through Arrhenius equation:
ln(𝑘1⁄𝑘2) = (𝐸𝑎⁄𝑅𝑇)(1 𝑇⁄ 2− 1 𝑇⁄ )1 [9]
where T2 and T1 are temperatures corresponding to the decimal reduction times D1 and D2 or
constant k1 and k2, respectively. R is the universal gas constant and Ea, the activation energy
(kJ/mol).
The non-linear Weilbull model can be written in the power-law form (Van Boekel, 2002):
log(𝐴 𝐴⁄ 𝑜)=-(1 2.303⁄ )(𝑡 𝛼⁄ )𝛽 [10]
where α is the scale parameter (a characteristic time) and is the shape parameter. The time
required to achieve a number of decimal reductions, d, can be calculated by using the shape and
scale parameters (Van Boekel, 2002):
𝑡𝑑 = 𝛼 (−𝑙𝑛(10−𝑑)
1
𝛽) [11]
2.5 Statistical analysis
Statistical analyses were conducted using the software Statgraphics X64. The results are
ACCEPTED MANUSCRIPT
differences was determined based on an analysis of the variance with the Tukey’s honestly
significant difference (HSD) method at p-value ≤ 0.05.
To estimate the kinetic parameters of the different models essayed in this work, non-linear
regression was performed by using the Marquardt algorithm (Statgraphics X64).
3. Results and discussion
3.1 Temperature profile
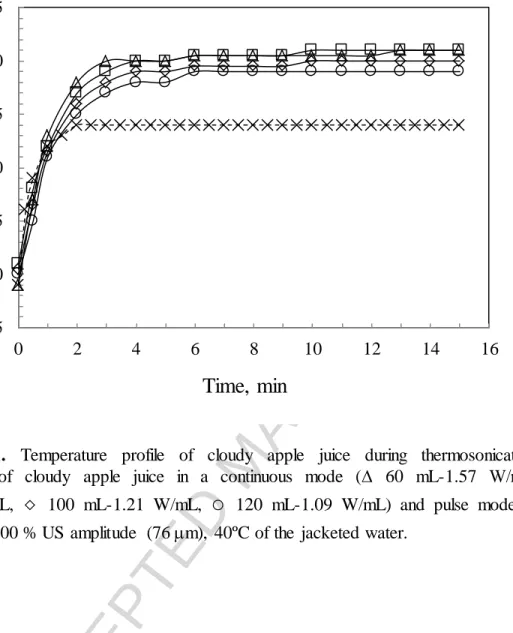
Figure 1 shows the temperature profile for a 15 min TS treatment in a continuous mode at a fixed
amplitude of 76 m (100%), for a temperature of the jacketed water of 40ºC, at different
volumes of treated apple juice (60, 80, 100 and 120 mL), which are equivalent to power densities
of 1.57, 1.36, 1.21 and 1.09 W/mL, respectively (equation 1). The temperature profile was
similar for all the treated volumes; although, the power density increased by decreasing the
treated volume. A sharp temperature increase was observed during the first three minutes of TS,
then, it reached a plateau with a mean value of 60 1 ºC. Similar temperature profiles were
obtained for the other temperatures essayed of the jacketed water, 20, 30, 45 and 50ºC, reaching
temperatures in the plateau region of 44 1, 52 1, 64 1 and 67 1ºC, respectively (data not
shown).
Figure 1 also shows the temperature profile for a pulse treatment. Total treatment time under
pulse mode, tp, was determined as:
tp = tc (1+(1/R)) [12]
where tc is the corresponding time of exposure in a continuous experiment, 15 min, and R is the
ratio on/off, in this work equal to 1. Experiments under pulse mode were carried out at the same
amplitude (76 m), temperature of the jacketed water (40ºC) and amount of treated apple juice
ACCEPTED MANUSCRIPT
density in the pulse mode was determined by considering only the effective sonication time (tc),
although total treatment time (tp) was 30 min, including the interval length. Likewise to a
continuous mode, a sharp initial increase in the temperature was observed and then, the
temperature remained constant. However, the temperature increase observed in the pulse mode
is less than in a continuous mode.
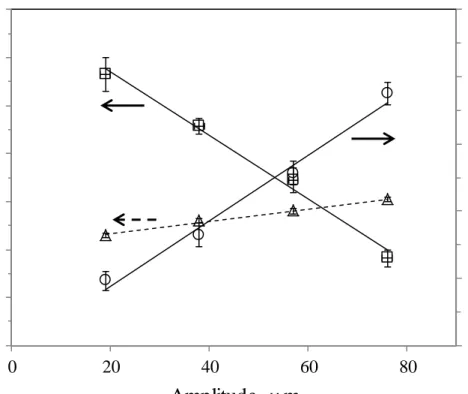
3.2 Effect of the amplitude
The effect of the TS amplitude was studied in the range of 25 to 100% (19 to 76 m) in a
continuous mode. These experiments were carried out with 80 mL of cloudy apple juice treated
for 20 min at a temperature of the jacketed water of 40º C (Figure 2). A linear increase with
amplitude was observed for both, power density and final temperature reached during TS
(PD (W/mL) = 0.020·Amplitude (m) - 0.238, R2 = 0.986; T(ºC) = 0.258·Amplitude (m) + 42,
R2 = 0.994).
PPO residual activity decreased linearly with amplitude, obtaining the lowest residual activity,
36 ± 3 %, at the maximum amplitude (PPO RA (%) = -1.326·Amplitude (m) + 140, R2=0.990).
It was observed that, at the lowest amplitude essayed in this work, PPO activity after TS
treatment was higher than in the untreated sample, as indicated by a residual activity value
higher than 100%, as determined by equation 2. This behavior has been attributed to the
homogenization of the juice, due to the acoustic energy that could cause the release of the
enzymes usually bound to cell walls (Başlar & Ertugay, 2013). The increase of the ultrasound
effects by increasing amplitude has been also related to the increase of the effective size of the
zone of liquid undergoing cavitation and the range of sizes of bubbles that undergo cavitation at
ACCEPTED MANUSCRIPT
residual enzyme activity decreased with increasing amplitude when studying the inactivation of
the mushroom PPO by ultrasonication,.
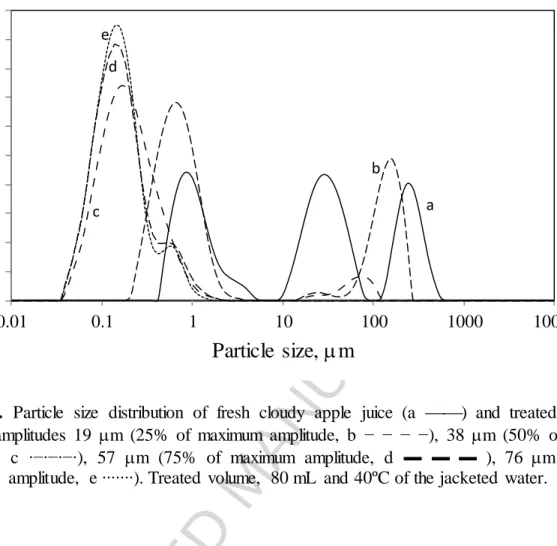
The effect of the amplitude on the particle size distribution of cloudy apple juice is shown in
Figure 3. Particle size distribution of untreated cloudy apple juice ranged from 0.5 m to 550 m
with three maxima at 0.8, 30 and 240 m (see Figure 3). After TS treatment under different
amplitudes, the particle range moved towards smaller particle sizes with two main peaks at the
lowest amplitude essayed (19 m) at 0.6 and 159 m, one main peak at 0.17 m for 50 % of
amplitude (38 m) and at 0.14 m at the two highest amplitude essayed (57 and 76 m). Based
on these results it can be concluded that TS reduces the size of juice particles leading to a better
uniformity and stability, especially at high working amplitude. Ertugay & Baslar (2014) related
cloud stability of apple juice to the size of the juice particles. These authors reported that particle
size above 0.5 - 0.65 μm in apple juice are unstable and settle down, whereas those below 0.5 μm
are held in suspension by Brownian motion and do not settle. Therefore, by working at higher
amplitude, lower residual activity was reached and also cloud stability was improved. Cheng et
al. (L. H. Cheng, Soh, Liew, & Teh, 2007) concluded in their study of sonication of guava juice
that, due to the high shearing effect that occurs during cavitation, TS can fragment colloidal
pectin molecules that would be more stable in the colloidal system.
Table 1 lists the values of D[3,2] and D[4,3] of fresh cloudy apple juice and after TS treatment at
different amplitudes. These values indicate that TS treatment promotes dissociation, since they
were significantly lower after TS than before treatment. This effect can also be observed in the
ACCEPTED MANUSCRIPT
Based on these results, further TS experiments were performed at 100% amplitude. In any case,
it must be highlighted that probe erosion, as an unavoidable side effect of sonication, is faster
when working at higher amplitudes.
3.3 Effect of power density on enzyme inactivation at different operating temperatures.
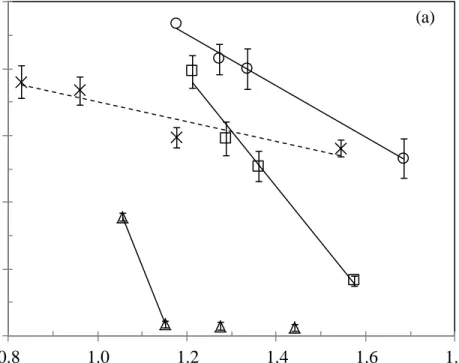
Figures 4a and 4b show PPO and PME residual activity, respectively, after 15 min of TS in the
temperature range from 52 to 67 ºC (temperature of the plateau, see Figure 1), for different
treated juice volumes (60, 80, 100 and 120 mL), which correspond to different power densities,
in continuous mode and in pulse mode.
Comparing both figures, it can be observed that PME is more resistant to TS treatment than PPO.
At 60ºC, no PME inactivation was observed at any of the treated volumes (power density ranged
from 1.21 to 1.57 W/mL), even a slight increase was found, probably due to the release of
enzyme bound to cell walls (Ertugay & Baslar, 2014). The greater stability of PME compared to
PPO has been also found in thermal treatments and other non-thermal treatments such as HPCD
(Illera et al., 2018) and it has been attributed to the more complex structure of PPO, with three or
four subunits in higher plants, that makes it more susceptible to inactivation. Additionally, PME
in fruit juices is more difficult to be effectively inactivated, since PME is bound to the plant cell
wall, which contains natural stabilizing factors (Zhou, Zhang, Leng, Liao, & Hu, 2010).
For PPO, at the highest temperature (67ºC), nearly complete inactivation (3 ± 1%) was obtained
when working at power density values greater than 1.15 W/mL. Figure 4a shows that to reach a
certain inactivation degree, lower values of power density are needed when working at higher
temperatures.
A linear relationship between enzyme residual activity and PD (W/mL) was found at the
ACCEPTED MANUSCRIPT
-166·PD +278, R = 0.987; at 67ºC: RA = -332·PD + 396 R = 1 (only two points); for PME at
67ºC RA = -43·PD + 110, R2= 0.920). The values of these slopes indicate a greater effect of the
power density in enzyme inactivation when working at higher temperatures. This suggests that
the synergic effect between temperature and ultrasound is more effective when working at high
temperatures.
Figure 4a also shows that when working in a pulse mode, the effect of power density on PPO
enzyme inactivation is lower than when working in a continuous mode (RA= -30·AED + 100,
R2= 0.867). Although pulse ultrasound can be considered as an energy saving operational mode
(Al-Juboori, Yusaf, & Bowtell, 2015), in this study, it has been found to be less effective than
continuous mode for PPO inactivation.
Other values have been found in the literature for PPO and PME inactivation in apple juice.
Values of PPO inactivation in apple juice in Golden delicious by TS treatment, with a 22 mm diameter probe (24 kHz) (200 mL of apple juice in a 250 mL vessel) in a pulse mode (50% and
100% of cycle), were reported by Baslar and Ertugay (Başlar & Ertugay, 2013). These authors
observed that the inactivation degree increased sharply with amplitude and temperature,
observing an increase in the inactivation degree from 5% to 30% when amplitude increased from
50 to 100 m at 50ºC, for 10 min of TS and pulse 1:1. At 60 ºC, these authors reported much
higher inactivation degrees, reaching values of 30% and 80% at 50 and 100 m of amplitude
respectively for 10 min of TS and pulse 1:1. Sulaimna et al. (Sulaiman et al., 2015) reported
values of PPO residual activity, around 17%, for PPO of Royal Gala apple puree when treated by
TS for 15 min at 58ºC and 210 m of amplitude in a continuous mode, with a 3 mm diameter
probe, which corresponds to 1.3 W/g (25g in apple puree in a 34.4 mL vessel). These authors
ACCEPTED MANUSCRIPT
temperatures of 72-73 ºC. Abid et al. (Abid et al., 2014) studied the TS of Fuji (Malus Domestica) variety apple juice (80 mL of apple juice in a 100 mL vessel), with a 0.5 inch probe at 20 kHz, and a value of the power density of 0.3 W/mL in a pulse mode (5s on and 5 s off). No
value of the amplitude was reported. They reported residual activities of 97, 53 and 6 % for PPO
at 20, 40 and 60ºC, respectively after 10 minutes of TS. For PME, these authors reported similar
values of residual activities 97, 52 and 7 % at 20, 40 and 60ºC, respectively after 10 minutes of
TS.
In this work, lower inactivation degree, i.e. higher residual activity, was obtained for PME of
Golden deliciuous, reaching the lowest residual activity of 50% at 67ºC after 15 min of TS at 79
m of amplitude and 1.44 W/mL. In this regard, it must be highlighted that PME from cloudy
Golden deliciuous apple juice was found to be one of the apple cultivars presenting strongest thermostability (30% of residual activity after heating 5 min at 100 ºC) (Teleszko, Nowicka, &
Wojdyło, 2016), although mechanism of TS and thermal treatment is probably different.
Regarding PPO activity, higher residual activities have been also obtained compared to the
results found in the literature. This could be attributed to the lower working amplitude, 79 m
(maximum amplitude reported by the supplier for this type of probes). The variety of data on
PPO inactivation from apple juice indicates that enzyme inactivation depends on many factors
such as source, sub-type, environmental and physicochemical conditions (pH, temperature) (X.
F. Cheng, Zhang, & Adhikari, 2013). Islam et al. (Islam, Zhang, & Adhikari, 2014) reviewed the
inactivation mechanisms and factors affecting the enzyme inactivation by ultrasound; however,
further investigation is needed to understand the specific mechanism by which the different
ACCEPTED MANUSCRIPT
TS treatment was compared with thermal treatment by heating the cloudy apple juice during
15 min in the same temperature range as for the TS process, 52 1, 60 1 and 67 1ºC. Heating
the juice at the lowest temperatures essayed in TS experiments 52ºC and 60ºC did not cause any
loss of enzyme activity but even a significant increase (p 0.05), compared to the untreated juice
(RA for PPO: 114 ± 12, 106 ± 16 , RA for PME: 135 ± 10, 157 ± 8 at 52ºC and 60ºC,
respectively). At the highest temperature essayed, 67ºC a significant decrease (p 0.05), in
enzyme activity by 24 4 % for PPO (RA = 76 4 %) and 9 2 % for PME (RA = 91 2 %)
was observed. These results prove that TS significantly improved the inactivation of PPO and
PME.
3.4 Inactivation kinetics of PPO at different operating temperatures.
The TS inactivation kinetics of PPO was determined in the temperature range from to 52 to 67ºC
final TS temperature. PPO of cloudy apple juice was inactivated faster by increasing operating
temperature (Figure 5). First order kinetic model has been successfully used in the literature to
correlate thermosonication inactivation kinetic data (Terefe, Buckow, & Versteeg, 2014). In this
work, kinetic data were fitted to the first order kinetic model and the Weibull model. The
corresponding kinetic parameters are listed in Table 2, together with the quality of the fitting.
For the first order kinetic model, the inactivation rate constant, k, increased with temperature;
therefore, D-values for PPO inactivation decreased with temperature from 130 min at 52ºC to 18
min at 67ºC. Baslar and Ertugay (Başlar & Ertugay, 2013) reported lower D values for PPO of
Golden delicious apple juice, 146, 66.4 and 12.9 min at 40, 50 and 60ºC respectively when working at 100 m of amplitude by ultrasound. D values for PPO of Malus domestica cv Roya Gala apple juice ranged from 49 to 4 min at 33 and 72ºC, respectively, at 1.3 W/g, 210 m of
ACCEPTED MANUSCRIPT
The temperature sensitive parameters, zT and Ea, were evaluated through the slopes of plotting
equations 8 and 9, respectively, yielding 17.5 ± 0.8 ºC and 123 ± 4 kJ/mol, respectively. Both
sensitivity parameters values show that the inactivation of PPO by TS is rather temperature
sensitive. Process with high activation energy values are very temperature sensitive (Levenspiel,
1999) as well as processes with low zT values.
In the literature, values of the same order were obtained for PPO inactivation of mushroom crude
extract in the temperature range from 55 to 75ºC, with zT = 13.8 ºC and Ea=183 ± 32 kJ/mol (X.
F. Cheng et al., 2013). Baslar and Ertugay (2013) reported a similar value of zT of 19 ºC for PPO
inactivation by thermosonication of Golden delicious apple juice, same variety as in this work. These authors did not report a value for Ea; however, as previously mentioned, these authors
reported D values in the temperature range from 40 to 60ºC and the activation energy could be
easily evaluated through Arrhenius equation by using the inverse of the D-values (D=1/k),
obtaining a value of 105 kJ/mol, similar to this work. On the contrary, other values reported for
PPO of Malus domestica cv. Royal Gala apple puree inactivation by TS showed lower temperature sensitivity at 1.3 W/g, with values for activation energy and zT of, 52 kJ/mol and
39ºC respectively, in the temperature range from 33 to 72ºC (Sulaiman et al., 2015).
The Weibull parameters are also listed in Table 2. Scale, α, and shape, , parameters were used
to calculate the time required to inactivate 1 log (td=1) of PPO. Similar to the D-values for the
first order kinetic model, td=1 decreased with temperature. The td=1 calculated by the Weibull
model were lower than the corresponding D values obtained by the first order kinetic model.
Therefore, in this case, the use of the first order kinetic model could lead to an overprocessing
estimation for PPO inactivation. According to van Boekel (2002), the dependence on
temperature of both parameters was analyzed. It was found that the scale parameter, α, was
ACCEPTED MANUSCRIPT
linear relationship. The shape factor, , was higher than 1 indicating a downward concavity of
the enzyme inactivation curve (Van Boekel, 2002), but it was not statistically significant
dependent on temperature, when tested at the 95% significance level for a linear relationship.
According to van Boekel (2002), the scale parameter, α, could be modelled in a similar way to
the classical D value of the first order kinetic model, suggesting a linear dependence of the log α
on temperature and considering that did not depend on temperature:
𝑙𝑜𝑔𝛼 = 𝑎1 − 𝑏1𝑇 [13]
A zT’ value can be also defined:
𝑧𝑇′ = 1 𝑏
1
⁄ [14]
The value of the zT’ is given in Table 2, together with the quality of the fitting. Although the
concept of zT and z’T is different since zT is obtained from the linear part, whereas z’T takes also
into account the nonlinear part (Van Boekel, 2002), similar values were obtained for both
parameters (zT = 17.5 ± 0.8 ºC and z’T = 20 ± 1 ºC). An Arrhenius type equation was also
considered to relate the inverse of the scale parameter, 1/α, with temperature. Although 1/α
cannot be considered a kinetic constant, the value obtained from the slope was found to be close
to the Ea obtained by applying the first order kinetic model, being 107 ± 6 kJ/mol
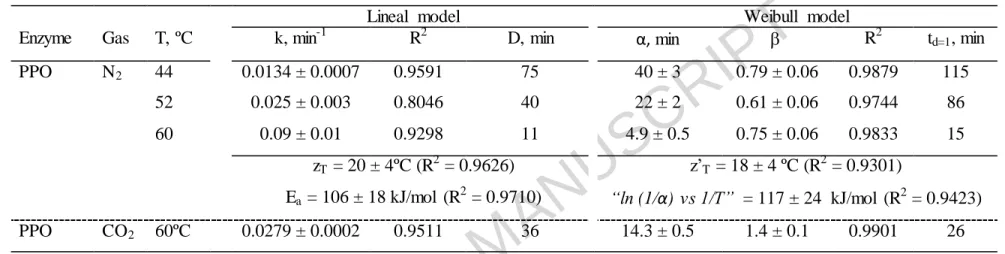
3.4. Effect of the nature of dissolved gases
The effect of the nature of dissolved gases on PPO inactivation kinetics is shown in Figure 6a at
three different thermosonication temperatures, 44, 52 and 60 ºC (temperature of the plateau, see
Figure 1) when treating 80 mL of apple juice at 100% of amplitude. Regarding the effect of
nitrogen, faster inactivation kinetics were obtained compared to the inactivation kinetics in the
presence of dissolved air in the apple juice at the same thermosonication temperature. The effect
ACCEPTED MANUSCRIPT
rates (initial slope of the curve) in the presence of CO2 was of the same order as in the presence
of air (Figure 5), however, faster reaction rates were obtained at longer TS times and therefore,
lower residual activity after 20 min of TS was reached in presence of CO2, 18 ± 2 %, than in the
presence of air, 36 ± 5 % at the same operating conditions. Nevertheless, the best results in terms
of inactivation rate and final RA were obtained when the air was displaced by nitrogen, reaching
a RA of 5 ± 2 % at 60ºC for 20 min of TS.
Figure 6b shows the PME inactivation kinetics at 60ºC (temperature of the plateau) when
dissolved air was displaced by nitrogen. After 20 min of TS, a minimal RA of 55 % was reached
while no inactivation of PME was observed at the same temperature when TS was performed in
presence of air (Figure 4b). However, at these conditions, results obtained with CO2 did not
bring any improvement in the inactivation process of PME compared with the results obtained in
the presence of air and inactivation was neither observed.
PPO and PME inactivation kinetic data obtained displacing the air by N2 or CO2 were also fitted
to the first order kinetic model and the Weibull model (Table 3). In general, a better fitting was
obtained by the Weibull model.
For the first order kinetic model, D-values were evaluated. It can be clearly observed that by
displacing the dissolved air by previously bubbling nitrogen into the apple juice, D- values were
lower than those reported in Table 2. At 60 ºC, in the presence of air, the D-value for PPO was
50 min, while it decreased down to 11 min in the presence of nitrogen and to 36 min in the
presence of carbon dioxide. The temperature sensitive parameters, zT and Ea, in the presence of
nitrogen were evaluated through the slopes of plotting equations 8 and 9, respectively, yielding
20 ± 4 ºC and 106 ± 18 kJ/mol respectively.
Regarding the Weibull model, the time required to achieve one decimal reduction, td=1, was
ACCEPTED MANUSCRIPT
to lower values of td=1, compared to the values reported in the presence of air. It was found that
the scale parameter, α, was statistically significant dependent on temperature, when tested at the
95% significance level for a linear relationship; but the shape factor, was not. According to
equations 13 and 14, zT’ for the Weibull was evaluated as 18 ± 4 ºC, being similar to zT for the
first order kinetic model. An Arrhenius type equation was also considered to relate the inverse of
the scale parameter, 1/α, with temperature. From the slope, a value close to the activation energy
obtained by applying the first order kinetic model was obtained, 117 ± 24 kJ/mol.
These results indicated that the nature of the dissolved gas in the apple juice played an important
role in enzyme inactivation. The effect of the nature of dissolved gases on enzyme inactivation
has not been frequently studied in the literature. Cheng et al. (L. H. Cheng et al., 2007) studied
the sonication process on guava juice quality with previous carbonation of the sample. These
authors proposed that dissolved carbon dioxide could reduce surface tension and could create
more nuclei cavitation. However, they found that after sonication or a combination of
carbonation + sonication, PPO showed higher activity than the untreated sample.
Gielen et al. (Gielen et al., 2016) discussed the different effect of the dissolved gases on
sonochemistry considering the solubility and thermal properties of the gases as well as the
different radical production. In this work, the H2O2 rate production was determined in a citrate
buffer solutions at the same pH as apple juice (pH = 3.9) at 60 ºC, 100 % of amplitude, 80 mL of
treated volume during 20 min. H2O2 rate formation was determined in three types of citrate
solutions with dissolved air and by displacing the air by bubbling nitrogen or carbon dioxide
previous to TS experiments. No H2O2 production was observed during the first five minutes of
TS in the presence of nitrogen or air, according to our analytical method. After that, it was found
that the H2O2 production as a function of time followed a linear relationship, with a H2O2 rate
ACCEPTED MANUSCRIPT
(R = 0.999) for nitrogen. In the presence of CO2, no H2O2 formation was observed after 15 min
of TS; subsequently, H2O2 formation rate was similar to that obtained with nitrogen and air
(3.81·10-8 mol/(Lmin), from 15 min to 20 min). In any case, these results indicated that CO2
partially inhibited the formation of H2O2 during TS. These results agreed partially with the
radical yield formation obtained by Gielen et al.(2016) in the presence of different gases in water
at 24 2 ºC. These authors also found, that CO2, although being a highly soluble gas (39.2
mmol/L versus 0.85 and 0.71 mmol/L for air and nitrogen respectively, at 293 K and 1 atm),
inhibited radical formation due to low bubble temperature attributed to its lower polytropic index
and a higher thermal conductivity compared to air and nitrogen (Gielen et al., 2016). The similar
H2O2 rate production for air and nitrogen obtained in this work, could be then attributed to their
similar thermal properties. However, Gielen et al. (Gielen et al., 2016) found that nitrogen
reduced radical yield by the production of radical scavengers and a lower bubble volume. In any
case, no relation can be established between H2O2 production rate in presence of the different
dissolved gases and enzyme inactivation, since higher inactivation rates were determined when
nitrogen displaced the dissolved air of the apple juice.
Nitrate and nitrite rate production was also determined during TS for the three buffer solutions at
the same operating conditions. The highest nitrate rate production was obtained when nitrogen
was previously dissolved in the buffer, (2.6 0.2·10-7) mol/(Lmin) (R2 = 0.982) and the same
value was obtained for CO2 and air, 1.8 0.2 10-7 mol/(Lmin), R2 = 0.910 and 0.960
respectively. Nitrite rate formation was lower than nitrate for all the gases being 3.2 0.2·10-8,
3.3 0.4·10-8 and1.5 0.2·10-8 mol/(Lmin), for nitrogen, air and CO2 (R2 = 0.993, 0.960, 0.967)
ACCEPTED MANUSCRIPT
found by displacing the air with nitrogen. However, further studies are needed to understand the
effect of the nature of the dissolved gas on enzyme inactivation by TS.
3.5. Comparison with HPCD
Among the different non-thermal technologies, the use of high pressure carbon dioxide (HPCD)
treatment is having also growing attention to inactivate certain microorganisms and enzymes.
Typically, operating pressure does not exceed 50 MPa and temperature ranges between 20 and
50 ºC (Briongos et al., 2016), being lower than the temperature employed in this work in TS.
Figure 7 compares the PPO inactivation kinetics by TS at 44 ºC, temperature of the plateau,
(V=80 mL and 100 % of amplitude) in the presence of air and by displacing the air with
nitrogen, with results obtained in a previous study on inactivation kinetic of PPO from apple
juice at 45ºC by HPCD at 20 MPa (Illera et al., 2018). At 44 ºC, in the presence of air, short
treatment times of TS led to an increase of PPO activity. As indicated in section 3.2, this increase
in enzyme activity has been attributed to the release of enzymes bond to cell walls due to the
acoustic shock waves (Başlar & Ertugay, 2013) or to the activation of PPO latent forms at low
intensities and short treatment times. In any case, at longer treatment times, PPO was inactivated.
Figure 7 shows that, at the same operating temperature, HPCD treatment at 20 MPa led to lower
PPO residual activity values. This indicates a different enzyme inactivation mechanism for these
two non-thermal technologies.
3.6. Effect of thermosonication on different quality parameters of cloudy apple juice
Some quality parameters have been determined right after TS treatment at 60 ºC (final TS
temperature), 100 % of amplitude, 15 min of treatment time and 80 mL treated volume of apple
ACCEPTED MANUSCRIPT
Color parameters. Table 4 lists the L*, a*, b* parameters of cloudy apple juice before and after
different TS treatments. As general trend, there were significant differences in all color attributes
after TS. The lightness (L*) slightly increased, while the red and yellow components decreased
compared to the untreated juice. The increase in lightness after TS has been previously reported
in the literature and it has been attributed to a homogenization effect of sonication (Tiwari,
Muthukumarappan, O’Donnell, & Cullen, 2008). A decrease in a* and b* parameters has been
also observed in different juices, such as orange juice (Tiwari et al., 2008) or soursop juice (Dias
et al., 2015).
Color difference, ΔE, (Equation 4) is also listed in Table 4. In all TS experiments, a color
difference was observed compared to the untreated juice. According to Yuk et al. (Yuk,
Sampedro, Fan, & Geveke, 2014), the color difference could be estimated to be not noticeable
(0–0.5), slightly noticeable (0.5–1.5), noticeable (1.5–3), well visible (3–6) and great (6–12).
Based on this classification, at 60ºC, the change in color was noticeable (1.5-3) while at 67ºC
was well visible (3-6). According to color parameters, the chroma value presented the lowest
value at 67ºC and the lowest treated volume, 60 mL (higher power density). Therefore, although
higher TS temperatures, led to higher inactivation rates, change in color was more visible.
Color changes during TS have been attributed to Maillard reactions that may occur at long
treatment time and high temperature, as well as to cavitation, that involves various physical,
chemical and biological reactions (Anaya-Esparza et al., 2017).
Total polyphenolic compounds. Total polyphenolic compounds (TPCs) slightly increased after
TS compared to the untreated apple juice. Significant differences of the total polyphenolic
compounds were found at 60 and 67ºC and in the apple juice treated by previously displacing the
air with nitrogen (Table 4). This TPCs increase after TS has been attributed to the enhanced
ACCEPTED MANUSCRIPT
compounds (Bhat, Kamaruddin, Min-Tze, & Karim, 2011). However, as pointed out by Bah et
al. (Bhat et al., 2011), this disruption cell wall process may cause a series of other oxidation
reactions that might involve changes in color as it has been observed by determining the color
parameters. Abid et al. (Abid et al., 2014) reported a significant increase of chlorogenic acid,
caffeic acid, epicatechin and phloridzin content in sonicated Malus domestic cv. Fuji apple juice in an ultrasound bath at 20 ºC (60 mL in a 100 mL thermostated vessel, 70% of amplitude and 25
kHz frequency).
Different results on TPC after TS of different juices have been previously reported in the literature. Some authors observed an increase of TPC after TS of pinapple and pear juices at 54
and 78ºC, respectively (Costa et al., 2013; Zafra-Rojas et al., 2013), while a reduction between
15-30% was observed after TS of cantaloupe melon (Fonteles et al., 2012).
Hydroxymethylfurfural. Table 4 also lists the HMF content after TS treatment of cloudy apple
juice. It can be observed that the HMF value remains constant around 2 mg HMF/L for all the TS
conditions used in this work, indicating that non-enzymatic browning reactions were not
significant during TS processing.
Conclusions
The present study reports the effect of different operating variables of the thermosonication
process on enzyme inactivation and other important quality parameters of cloudy apple juice.
It has been observed that working US amplitude increased enzyme inactivation and significantly
enhanced the particle size distribution of cloudy apple juice by shifting the particle size towards
lower particle diameters compared to the untreated juice.
The nature of the dissolved gas in the cloudy apple juice has been found to play an important
role on enzyme inactivation, observing faster inactivation kinetics when nitrogen displaced the
ACCEPTED MANUSCRIPT
Total phenolic compounds increased after TS, and color change was noticeable.
Hydroxymethylfurfural content did not change after different TS treatments.
Further investigations are needed to elucidate the enzyme inactivation mechanism and reach a
better understanding and optimization of the TS process
ACKNOWLEDGMENTS
To the Spanish Government (MINECO) and the European Regional Development Fund (ERDF)
for financial support of project CTQ2015-64396-R and AEI’s contract. To MINECO for RM’s
pre-doctoral contract (BES-2013-063937). To University of Burgos for AGS’s pre-doctoral
contract. To Junta de Castilla y León and ERDF for O.Benito’s Post-doctoral contract funded by
project BU055U16.
REFERENCES
Abid, M., Jabbar, S., Hu, B., Hashim, M. M., Wu, T., Lei, S., … Zeng, X. (2014).
Thermosonication as a potential quality enhancement technique of apple juice. Ultrasonics Sonochemistry, 21(3), 984–990. http://doi.org/10.1016/j.ultsonch.2013.12.003
Al-Juboori, R. A., Yusaf, T., & Bowtell, L. (2015). Energy Conversion Efficiency of Pulsed
Ultrasound. Energy Procedia, 75, 1560–1568. http://doi.org/10.1016/j.egypro.2015.07.340 Anaya-Esparza, L. M., Velázquez-Estrada, R. M., Roig, A. X., García-Galindo, H. S.,
Sayago-Ayerdi, S. G., & Montalvo-González, E. (2017). Thermosonication: An alternative
processing for fruit and vegetable juices. Trends in Food Science and Technology, 61, 26– 37. http://doi.org/10.1016/j.tifs.2016.11.020
Baltacioglu, H., Bayindirli, A., & Severcan, F. (2017). Secondary structure and conformational
change of mushroom polyphenol oxidase during thermosonication treatment by using FTIR
ACCEPTED MANUSCRIPT
Başlar, M., & Ertugay, M. F. (2013). The effect of ultrasound and photosonication treatment on
polyphenoloxidase (PPO) activity, total phenolic component and colour of apple juice.
International Journal of Food Science and Technology, 48(4), 886–892. http://doi.org/10.1111/ijfs.12015
Bhat, R., Kamaruddin, N. S. B. C., Min-Tze, L., & Karim, A. A. (2011). Sonication improves
kasturi lime (Citrus microcarpa) juice quality. Ultrasonics Sonochemistry, 18(6), 1295– 1300. http://doi.org/10.1016/j.ultsonch.2011.04.002
Briongos, H., Illera, A. E., Sanz, M. T., Melgosa, R., Beltrán, S., & Solaesa, A. G. (2016). Effect
of high pressure carbon dioxide processing on pectin methylesterase activity and other
orange juice properties. LWT - Food Science and Technology, 74, 411–419. http://doi.org/10.1016/j.lwt.2016.07.069
Cheng, L. H., Soh, C. Y., Liew, S. C., & Teh, F. F. (2007). Effects of sonication and carbonation
on guava juice quality. Food Chemistry, 104(4), 1396–1401. http://doi.org/10.1016/j.foodchem.2007.02.001
Cheng, X. F., Zhang, M., & Adhikari, B. (2013). The inactivation kinetics of polyphenol oxidase
in mushroom (Agaricus bisporus) during thermal and thermosonic treatments. Ultrasonics Sonochemistry, 20(2), 674–679. http://doi.org/10.1016/j.ultsonch.2012.09.012
Costa, M. G. M., Fonteles, T. V., de Jesus, A. L. T., Almeida, F. D. L., de Miranda, M. R. A.,
Fernandes, F. A. N., & Rodrigues, S. (2013). High-Intensity Ultrasound Processing of
Pineapple Juice. Food and Bioprocess Technology, 6(4), 997–1006. http://doi.org/10.1007/s11947-011-0746-9
Dias, D. da R. C., Barros, Z. M. P., Carvalho, C. B. O. de, Honorato, F. A., Guerra, N. B., &
ACCEPTED MANUSCRIPT
Ertugay, M. F., & Baslar, M. (2014). The effect of ultrasonic treatments on cloudy
quality-related quality parameters in apple juice. Innovative Food Science and Emerging Technologies, 26, 226–231. http://doi.org/10.1016/j.ifset.2014.06.013
Fonteles, T. V., Costa, M. G. M., de Jesus, A. L. T., de Miranda, M. R. A., Fernandes, F. A. N.,
& Rodrigues, S. (2012). Power ultrasound processing of cantaloupe melon juice: Effects on
quality parameters. Food Research International, 48(1), 41–48. http://doi.org/10.1016/j.foodres.2012.02.013
Gielen, B., Marchal, S., Jordens, J., Thomassen, L. C. J., Braeken, L., & Van Gerven, T. (2016).
Influence of dissolved gases on sonochemistry and sonoluminescence in a flow reactor.
Ultrasonics Sonochemistry, 31, 463–472. http://doi.org/10.1016/j.ultsonch.2016.02.001 Grintsevich, E. E., Adzerikho, I. E., Mrochek, A. G., & Metelitza, D. I. (2001). Polydisulfides of
substituted phenols as effective protectors of peroxidase against inactivation by ultrasonic
cavitation. Biochemistry (Moscow), 66(7), 740–746. http://doi.org/10.1023/A:1010256511200
Illera, A. E., Sanz, M. T., Beltrán, S., Melgosa, R., Solaesa, A. G., & Ruiz, M. O. (2018).
Evaluation of HPCD batch treatments on enzyme inactivation kinetics and selected quality
characteristics of cloudy juice from Golden delicious apples. Journal of Food Engineering,
221, 141–150. http://doi.org/10.1016/j.jfoodeng.2017.10.017
Islam, M. N., Zhang, M., & Adhikari, B. (2014). The Inactivation of Enzymes by Ultrasound—A
Review of Potential Mechanisms. Food Reviews International, 30(1), 1–21. http://doi.org/10.1080/87559129.2013.853772
Kadkhodaee, R., & Povey, M. J. W. (2008). Ultrasonic inactivation of Bacillus α-amylase. I.
ACCEPTED MANUSCRIPT
Levenspiel, O. (1999). Chemical reaction engineering Octave Levenspiel.Mead, E. L., Sutherland, R. G., & Verrall, R. E. (1976). The effect of ultrasound on water in the
presence of dissolved gases. Canadian Journal of Chemistry, 54(7), 1114–1120. http://doi.org/10.1139/v76-159
O’Donnell, C. P., Tiwari, B. K., Bourke, P., & Cullen, P. J. (2010). Effect of ultrasonic
processing on food enzymes of industrial importance. Trends in Food Science and Technology, 21(7), 358–367. http://doi.org/10.1016/j.tifs.2010.04.007
Queiroz, C., da Silva, A. J. R., Lopes, M. L. M., Fialho, E., & Valente-Mesquita, V. L. (2011).
Polyphenol oxidase activity, phenolic acid composition and browning in cashew apple
(Anacardium occidentale, L.) after processing. Food Chemistry, 125(1), 128–132. http://doi.org/10.1016/j.foodchem.2010.08.048
Raso, J., Mañas, P., Pagán, R., & Sala, F. J. (1999). Influence of different factors on the output
power transferred into medium by ultrasound. Ultrasonics Sonochemistry, 5(4), 157–162. http://doi.org/10.1016/S1350-4177(98)00042-X
Raviyan, P., Zhang, Z., & Feng, H. (2005). Ultrasonication for tomato pectinmethylesterase
inactivation: Effect of cavitation intensity and temperature on inactivation. Journal of Food Engineering, 70(2), 189–196. http://doi.org/10.1016/j.jfoodeng.2004.09.028
Sulaiman, A., Soo, M. J., Yoon, M. M. L., Farid, M., & Silva, F. V. M. (2015). Modeling the
polyphenoloxidase inactivation kinetics in pear, apple and strawberry purees after High
Pressure Processing. Journal of Food Engineering, 147(C), 89–94. http://doi.org/10.1016/j.jfoodeng.2014.09.030
Supeno, & Kruus, P. (2000). Sonochemical formation of nitrate and nitrite in water. Ultrasonics Sonochemistry, 7(3), 109–113. http://doi.org/10.1016/S1350-4177(99)00043-7
ACCEPTED MANUSCRIPT
characteristic of cloudy apple juices. Agricultural and Food Science, 25(1), 34–43. Terefe, N. S., Buckow, R., & Versteeg, C. (2014). Quality-Related Enzymes in Fruit and
Vegetable Products: Effects of Novel Food Processing Technologies, Part 1: High-Pressure
Processing. Critical Reviews in Food Science and Nutrition, 54(1), 24–63. http://doi.org/10.1080/10408398.2011.566946
Tiwari, B. K., Muthukumarappan, K., O’Donnell, C. P., & Cullen, P. J. (2008). Effects of
sonication on the kinetics of orange juice quality parameters. Journal of Agricultural and Food Chemistry, 56(7), 2423–2428. http://doi.org/10.1021/jf073503y
Van Boekel, M. A. J. S. (2002). On the use of the Weibull model to describe thermal inactivation
of microbial vegetative cells. International Journal of Food Microbiology, 74(1-2), 139– 159. http://doi.org/10.1016/S0168-1605(01)00742-5
Yuk, H. G., Sampedro, F., Fan, X., & Geveke, D. J. (2014). Nonthermal Processing of Orange
Juice Using a Pilot-Plant Scale Supercritical Carbon Dioxide System with a Gas-Liquid
Metal Contactor. Journal of Food Processing and Preservation, 38, 630–638. http://doi.org/10.1111/jfpp.12013
Zafra-Rojas, Q. Y., Cruz-Cansino, N., Ramírez-Moreno, E., Delgado-Olivares, L.,
Villanueva-Sánchez, J., & Alanís-García, E. (2013). Effects of ultrasound treatment in purple cactus
pear (Opuntia ficus-indica) juice. Ultrasonics Sonochemistry, 20(5), 1283–1288. http://doi.org/10.1016/j.ultsonch.2013.01.021
Zhou, L., Zhang, Y., Leng, X., Liao, X., & Hu, X. (2010). Acceleration of precipitation
ACCEPTED MANUSCRIPT
Figure captions:
Figure 1. Temperature profile of cloudy apple juice during thermosonication of different
volumes of cloudy apple juice in a continuous mode ( 60 1.57 W/mL, □ 80
mL-1.36 W/mL, ◇ 100 1.21 W/mL, ○ 120 1.09 W/mL) and pulse mode (x 80
mL-1.18 W/mL). 100 % of amplitude (76 m), 40ºC of the jacketed water.
Figure 2. Effect of the amplitude on PPO residual activity (□), final temperature of the juice ()
and power density, W/mL (○) for a treated volume of 80 mL and 40ºC of the jacketed water.
Lines represent the linear regression.
Figure 3. Particle size distribution of fresh cloudy apple juice (a ) and treated by TS at
different amplitudes 19 m (25% of maximum amplitude, b − − − −), 38 m (50% of maximum
amplitude, c ∙−∙−∙−∙), 57 m (75% of maximum amplitude, d ▬ ▬ ▬ ), 76 m (100% of
maximum amplitude, e ∙∙∙∙∙∙∙). Treated volume, 80 mL and 40ºC of the jacketed water.
Figure 4. Enzyme residual activity after 15 min of thermosonication at100 % of amplitude (79
m) and different temperatures ( 52ºC, □ 60ºC, Δ 67ºC, T of the plateau) in a continuous mode
and in pulse mode at 54ºC (T of the plateau) () as a function of AED, W/mL (a) PPO (b) PME.
Lines represent the linear relationship.
Figure 5. PPO inactivation kinetics during TS treatment at 100 % of amplitude (79 m) at
different operating temperatures ( 52ºC, □ 60ºC, ◇ 64ºC, ○ 67ºC, T of the plateau). Treated
volume = 80 mL. Continuous lines represent the Weibull model.
Figure 6. PPO (6a) and PME (6b) inactivation kinetics during TS treatment at 100 % of
amplitude (79 m) at different operating temperatures (◇ 44ºC; 52ºC, □, ■ 60ºC, T of the
plateau) in presence of nitrogen (hollow symbols) and carbon dioxide (full symbols). Treated
ACCEPTED MANUSCRIPT
Figure 7. Comparison of PPO inactivation kinetics at 44 - 45 ºC for different non-thermal
treatments: Δ HPCD at 20 MPa, ◇ TS in the presence of N2 (V=80 mL, 100 % of amplitude), □
ACCEPTED MANUSCRIPT
Figure 1. Temperature profile of cloudy apple juice during thermosonication of different volumes of cloudy apple juice in a continuous mode ( 60 1.57 W/mL, □ 80
mL-1.36 W/mL, ◇ 100 mL-1.21 W/mL, ○ 120 mL-1.09 W/mL) and pulse mode (x 80 mL-1.18 W/mL). 100 % US amplitude (76 m), 40ºC of the jacketed water.
35 40 45 50 55 60 65
0 2 4 6 8 10 12 14 16
T
em
p
er
at
u
re
(
ºC
)
ACCEPTED MANUSCRIPT
Figure 6. PPO (6a) and PME (6b) inactivation kinetics during TS treatment at 100 % of amplitude (79 m) at different operating temperatures (◇ 44ºC; 52ºC, □, ■ 60ºC (T of the plateau) in presence of nitrogen (◇, , □) and carbon dioxide (■). Treated volume = 80 mL. Lines represent the Weibull model (continuous: N2, dashed line: CO2).
ACCEPTED MANUSCRIPT
Table 1. Effect of amplitude in the thermosonication treatment on the particle size distribution
(m) of cloudy apple juice
Time D[3,2] D[4,3] d(0.1) d(0.5) d(0.9)
Cloudy apple juice 2.24 ± 0.04d 70 ± 2d 0.690 ± 0.003d 20.9 ± 0.8c 249 ± 4c
19 m (25 %) 0.82 ± 0.02c 44 ± 2c 0.36 ± 0.01c 0.88 ± 0.01b 158 ± 4b
38 m (50 %) 0.168 ± 0.003b 4.66 ± 0.06b 0.086 ± 0.003b 0.202 ± 0.003a 0.70 ± 0.06a
57 m (75 %) 0.140 ± 0.001a 0.238 ± 0.001a 0.077 ± 0.000a 0.164 ± 0.001a 0.513 ± 0.001a
76 m (100 %) 0.138 ± 0.001a 0.217 ± 0.001a 0.078 ± 0.001a 0.160 ± 0.001a 0.434 ± 0.001a
ACCEPTED MANUSCRIPT
Table 2. TS kinetic inactivation parameters at different operating temperatures. Sensititvity temperature parameters, ZT and Ea.
ACCEPTED MANUSCRIPT
Table 3. TS kinetic inactivation parameters at different operating temperatures and with different dissolved gases. Sensititvity
ACCEPTED MANUSCRIPT
Table 4. Effect of thermosonication on color parameters, total polyphenolic compounds (TPCs) and hydroxymethyl furfural content
TS treatment V -PD1
mL -W/mL
T, ºC Gas L* a* b* E Chroma TPCs
mg GAE/L
HMF mg/L
Untreated apple juice 37.1 ± 0.2a,b 1.7 ± 0.1e 7.8 ± 0.1d 7.9 ± 0.1d 407 ± 20a 1.9 ± 0.1a,b
60 - 1.58 60 Air 38.9 ± 0.2d 0.07 ± 0.05c 7.0 ± 0.2c 2.5 ± 0.3b 7.0 ± 0.2c 419 ± 27a 2.0 ± 0.1a,b
80 - 1.30 60 Air 37.9 ± 0.6b,c 0.47 ± 0.02d 6.9 ± 0.1c 1.7 ± 0.3a 6.9 ± 0.1c 459 ± 3a,b 1.7 ± 0.1a,b
100 - 1.21 60 Air 39.2 ± 0.2d,e -0.5 ± 0.1b 7.1 ± 0.2c 3.1 ± 0.1c 7.1 ± 0.2c 478 ± 35b 1.2 ± 0.1a,b
80 - 1.43 60 N2 38.0 ± 0.2
c
0.48 ± 0.02d 5.9 ± 0.1b 2.3 ± 0.1b 6.0 ± 0.1b 508 ± 13b 2.2 ± 0.1b
60 - 1.51 67 Air 37.1 ± 0.2a -0.85 ± 0.01a 4.5 ± 0.1a 4.1 ± 0.1d 4.6 ± 0.1a 482 ± 15b 1.6 ± 0.2a,b
80 - 1.28 67 Air 40.3 ± 0.2f -0.45 ± 0.04b 8.4 ± 0.2e 3.8 ± 0.2d 8.5 ± 0.2e 483 ± 10b 1.1 ± 0.1a
100 - 1.15 67 Air 39.9 ± 0.1e,f -0.03 ± 0.03c 7.9 ± 0.1d 3.2 ± 0.1c 7.9 ± 0.1d 498 ± 9b 1.6 ± 0.1a,b
1
Treated volume and power density
ACCEPTED MANUSCRIPT
HighlightsEnzyme inactivation increased with amplitude, power density and temperature
TS treatment decreased particle size of cloudy apple juice
PME was more TS resistant than PPO
Faster enzyme inactivation kinetics in the presence of nitrogen were observed