Cu(II) and Zn(II) complexes with a poly-functional ligand derived from o-vanillin and thiophene. Crystal structure, physicochemical properties, theoretical studies and cytotoxicity assays against human breast cancer cells
María R. Rodríguez a, Julián Del Plá a, Lucía M. Balsa a, Ignacio E. León a, Oscar E. Piro b, Gustavo A. Echeverría b, Javier García-Tojal c, Reinaldo Pis-Diez a, Beatriz S. Parajón-Costa a and Ana C. González-Baró a *
a CEQUINOR (CONICET-CCT La Plata, UNLP), Bvd. 120 N°1465, B1900AVV La Plata, Argentina. b IFLP (CONICET-CCT La Plata, UNLP), CC 67, B1900AVV, La Plata, Argentina.
c Departamento de Química, UBU, Pza. Misael Bañuelos s/n, E-09001 Burgos, España.
Abstract
The interaction of a poly-functional ligand derived of o-vanillin and 2-thiophenemethylamine (oVATPNH2) with transition metal ions, Cu(II) and Zn(II) leads to the formation of stable coordination compounds, namely [Cu(oVATPNH2)2] and [Zn(oVATPNH2)2]. Their crystal structures have been determined by X-ray diffraction methods. Two molecules of the deprotonated ligand acting as bidentate build a nearly square planar environment around Cu(II) and a distorted tetrahedral coordination arrangement for Zn(II). The complexes were characterized by spectroscopic techniques, including solid state FTIR, Raman, EPR and diffuse reflectance and solution UV-vis and EPR. Their thermal behavior has been analyzed by means of TGA and DTA. DFT theoretical studies, using computational methods based on DFT, were employed to assist the interpretation and assignment of spectroscopic data. Cytotoxicity assays against two human breast cancer cell lines, namely MCF-7 and MDA-MB-231, revealed an enhancement of effectiveness of the complexes as compared with both the ligand and the free metal ions. The results for the copper compound are promising, as its cytotoxic effect was stronger than the reference metallodrug cisplatin in both cancer cell lines tested.
1. Introduction
therapeutic agents.7 Additionally, the sulfur atom can act as a potential donor in the ligands depending on their conformational properties.
The relevance of transition metal coordination chemistry involving this kind of ligands is based on the structural versatility, syntheses accessibility and wide application in different fields. They are of interest in food and dye industries; in analytical and agro-chemistry and they have shown catalytic, antioxidant, fungicidal, anti-inflammatory and antitumor activities.8-10 It is expected that complexation leads to an improvement in the activity of the ligand or the metal themselves. It is well known that, among the first row of transition metals, copper and zinc are involved in many essential biological roles and in a wide variety of bioinorganic systems. Furthermore, these metals have been important in the development of metallo-pharmaceuticals with diverse therapeutic activity in an attempt to lower the side effects.
Examples of copper complexes involving ligands derived from heterocycles have shown relevant characteristics and applications.11-13 The interaction of this kind of ligands with the Zn(II) has led to stable complexes that have been studied in relation with the importance of this metal in biological functions and therapeutic activities.13-16
Among the diversity of biological and therapeutic effects of metal complexes, antitumor activity is one of the most relevant.17 In particular, breast cancer is one of the more frequent causes of premature mortality in female population. One of the most aggressive types is the one known as triple-negative breast cancer. Up to the moment, chemotherapy seems to be the only possible treatment, involving side effects. Then, great efforts are devoted to improve therapeutic agents to optimize the treatment.18 The selected ligand in this work (oVATPNH2, HL, see Scheme 1) has been obtained and fully characterized in our laboratory.19 It is the product of the reaction of o-vanillin (2-hydroxy-3-methoxybenzaldehyde, hereafter oVa) and 2-thiophenemethylamine (TPNH2). It is an example of Schiff base derived from primary amines involving a heterocycle, a group of compounds with interesting properties.4
Scheme 1:oVATPNH2, HL ligand (2-methoxy-6-{(E)-[(thiophen-2-ylmethyl)imino]methyl}phenol).
The complexes have been fully characterized by means of spectroscopic (FTIR, Raman, UV-Vis and EPR) techniques, their thermal behavior has been explored by TGA and DTA and their crystal structures were determined by X-ray diffraction methods. DFT calculations were performed to complement experimental results and to assist in their interpretation. The cytotoxic activity of the complexes was essayed against two tumoral cell lines and compared with the free ligand, metal ions and the reference metallodrug cisplatin, with promising results in breast cancer cell lines. The physicochemical and structural characteristics of the compounds that are analyzed herein can help to explain their behavior in chemical or biological reactions, being a valuable tool in the design of new synthetic systems.
2. Experimental
2.1. Synthesis
The following reactants and solvents were used as provided with no further purification. Absolute ethanol (Soria), methanol and acetonitrile (Carlo Erba), Cu(CH3COO)2·H2O (Merck) and Zn(CH3COO)2·2 H2O (Mallinckrodt).
The ligand oVATPNH2 (HL) was prepared according with previously reported data.19
Elemental analyses were performed in an Exeter CE 440 analyser and melting points were determined in a Bock monoscop “M” instrument.
The complexes were prepared according to the following procedures:
[Cu(oVATPNH2)2] (CuL2): This complex was prepared from different copper salts, namely chloride, nitrate and acetate and in different solvents (ethanol, methanol, acetonitrile), but only in the following case it was possible to obtain a crystalline product: over a solution of Cu(CH3COO)2·H2O (0,10 mmol, 0.0199 g) in acetonitrile (8 mL), a solution of the ligand (0,20 mmol, 0492 g) in the same solvent (25mL) was drop wise added under stirring and mild heating conditions. The resulting solution immediately changes its colour from yellow to ochre with forward precipitation of yellowish-green crystals. The system was kept in the same conditions for 30 minutes and the solid was isolated by filtration. (Yield: 65%, 0.0361 g, m.p: 237-238°C) Anal. Found: C, 55.98; H, 4.43; N, 5.12; S, 11.48% Calc. for C26H24N2O4S2Cu: C, 56.15; H, 4.35; N, 5.04; S, 11.53 %.
2.2. X-ray diffraction data
The measurements of complexes (I) and (II) were performed on an Oxford Xcalibur Gemini, Eos CCD diffractometer with graphite-monochromated MoKα (λ=0.71073 Å) radiation. X-ray diffraction intensities
were collected (ω scans with ϑ and κ-offsets), integrated and scaled with CrysAlisPro 24 suite of
programs. The unit cell parameters were obtained by least-squares refinement (based on the angular settings for all collected reflections with intensities larger than seven times the standard deviation of measurement errors) using CrysAlisPro. Data were corrected empirically for absorption employing the multi-scan method implemented in CrysAlisPro. The structures were solved by direct methods with SHELXS of the SHELX suit of programs 25 and the molecular models refined by full-matrix least-squares procedure on F2with SHELXL of the same package. At this stage it was noted a rotational disorder of
the five-member thiophene ring which splits into a dominant (74% for the Cu complex and 83% for the Zn one) conformer and a second minor one rotated from the first in 180º around the linking C-C σ-bond. This disorder was modeled in terms of two such rings and refined such that their occupancies summed up to one. The hydrogen atoms were located on stereo-chemical basis and refined with the riding model. The methyl groups were refined as rigid group allowed to rotate around the corresponding O-CH3 bonds such as to maximize the sum of the electron density at the hydrogen calculated positions. The methyl group of both complexes converged to staggered angular conformations.
2.3. Spectroscopy
Infrared spectra of solid samples (KBr pellets) were recorded with a Bruker Equinox 55 instrument in the 4000-400 cm-1 region. Raman spectra were measured with a WITEC alpha 300 RA spectrophotometer, using laser excitation wavelength of 532 nm and a 20x objective lens.
Electronic spectra of the compounds and reactants were recorded in solution of dimethyl sulfoxide (DMSO), using 10 mm quartz cells in the spectral range from 190 to 800 nm. Diffuse reflectance spectra (convert in absorbance from Kubelka-Munk function) in the 250 - 800 nm range were recorded using BaSO4 pellet as a reference with an integrating sphere attachment. Both spectra were registered in a Shimadzu UV-2006 spectrophotometer.
simulated spectra and graphics were carried out with Kaleidagraph v4.1 27. Experimental details are given in figure captions.
NMR samples were prepared under a nitrogen atmosphere by dissolving the suitable amount of the compound in 0.5 mL of pre-dried (Molecular Sieves 4Å) oxygen-free CD3)2SO and the spectra were recorded at 298 K. Typically, 1H NMR spectra were acquired with 32 scans into 32 k data points over a spectral width of 16 ppm. 1H and 13C chemical shifts were internally referenced to TMS via the residual 1H signal of CHD2SOCD3 (δ = 2.50 ppm) and the 13C signal of (CD3)2SO (δ = 39.52 ppm), according to
the values reported by Fulmer et al.28 Heteronuclear 2D NMR spectra such as 1H-13C HSQC, 1 H-13C HMBC were recorded using standard pulse sequences. The probe temperature (±1 K) was
controlled by a standard unit calibrated with methanol as a reference. All NMR data processing was carried out using MestReNova version 10.0.2.
2.4. Computational methods.
The structures of the three complexes were optimized using the Becke's three parameters hybrid density functional 29 with the gradient-corrected correlation functional due to Lee, Yang, and Parr 30 as implemented in of the ORCA program 31. The Def2-TZVP basis set of triple-zeta quality was used for all the atoms.32 The experimental structures obtained from X ray diffraction were taken as starting geometries for Cu(oVATPNH2)2 and Zn(oVATPNH2)2. Based on spectroscopic results, a square pyramidal geometry was proposed in the case of VO(oVATPNH2)2. Optimizations were conducted in the gas phase.
To verify whether the optimized geometries are local minima or saddle points on the potential energy surface of the molecules the eigenvalues of the Hessian matrix of the total energy with respect to the nuclear coordinates were calculated. Those eigenvalues were then transformed to harmonic vibrational frequencies, which were further used to aid in the assignment of the experimental vibrational frequencies. No factors were used to scale calculated frequencies.
The electronic spectra of complexes were calculated using the hybrid PBE0 functional 33 as implemented in the ORCA program. The Def2-TZVP basis sets were used for those calculations, too. Solvent effects were included implicitly through the Conductor-like Screening Model (COSMO) 34 as implemented in the ORCA program. The results obtained by these procedures were used to assist in the interpretation and assignments of the spectroscopic data.
2.5. Thermal analysis.
2.6. Biological assays. 2.6.1. Materials
Tissue culture materials were purchased from Corning (Princeton, NJ, USA), Dulbecco’s modified Eagle’s medium (DMEM) and TrypLE ™ were purchased from Gibco (Gaithersburg, MD, USA), and fetal bovine serum (FBS) was purchased from Internegocios (Argentina). All the cell lines were purchased from ATCC (American Type Culture Collection.
2.6.2. Cell line and growth conditions
MCF-7 (breast) cancer cells were grown in DMEM containing 10 % FBS, 100 U/mL penicillin, and 100 µg/mL streptomycin at 37° C in a 5 % CO2 atmosphere whilst MDA-MB-231 (triple negative breast) were grown in F12-DMEM. Cells were seeded in a 75-cm2 flask, and when 70–80 % of confluence was reached, cells were subcultured using 1 mL of TrypLE ™ per 25-cm2 flask. For experiments, cells were grown in multiwell plates. When cells reached the desired confluence, the monolayers were washed with PBS and were incubated under different conditions according to the experiments.
2.6.3.Cell viability study: 3-(4,5-Dimethylthiazol-2-yl)-2,5-diphenyltetrazolium bromide assay
The 3-(4,5-dimethylthiazol-2-yl)-2,5-diphenyltetrazolium bromide (MTT) assay was performed according to Mosmann 35. Briefly, cells were seeded in a 96-well dish for 24 h, and treated with different concentrations of compound (1-50 µM) at 37° C for 48 h. Afterward, the medium was changed and the cells were incubated with 0.5 mg/mL MTT under normal culture conditions for 3 h. Cell viability was marked by the conversion of the tetrazolium salt MTT to a colored formazan by mitochondrial dehydrogenases. Color development was measured spectrophotometrically with a microplate reader (model 7530, Cambridge Technology, USA) at 570 nm after cell lysis in DMSO (100 µL per well). Cell viability was plotted as the percentage of the control value.
3. Results and discussion
3.1. Crystal Structures
(O-Zn-N)=95.88(7)º.40-42Complete lists of geometrical parameters are available as supplementary information (Tables S1-S5).
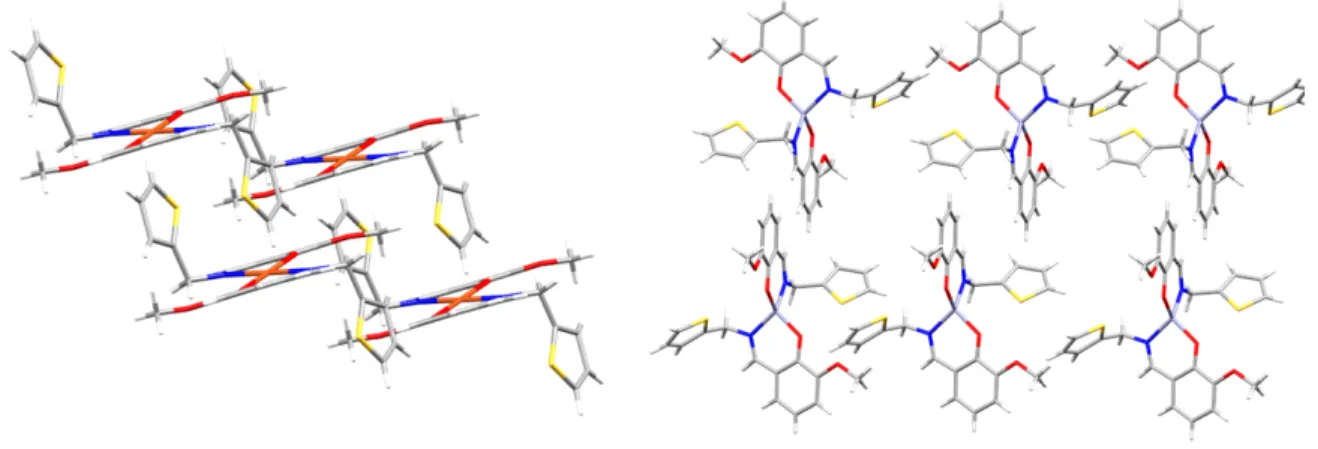
Because of π-bond delocalization, both the arylmethylidenemethanamine and the thiophene fragments are planar [rms deviation of atoms from the corresponding best least-squares planes less than 0.017 Å]. Planarity in the arylmethylidenemethanamine molecular skeleton is further stabilized by the ligand bite-like coordination to metal.
The conformation and metrics of the single-charged anionic ligand can be compared with the corresponding geometric data reported for the uncharged pure oVATPNH2 ligand. It crystallizes in the monoclinic space group P21/n with two un-equivalent but structurally closely related molecules per asymmetric unit (Z=8), one of them showing rotational disorder of the five-member ring. The disorder has been modeled in term of two rings rotated from each other in 180º around the linking C-C σ -bond.19
Referring to the better refined, disorder-free molecule in the neutral ligand, some bond structure changes are expected upon deprotonation of OH group followed by formation of the metal-O and metal-N bonds. Main change occurs at the C-O bonds as C-OH formally single bond length of 1.351(4) Å shortens to 1.297(2)
Å (
twelve times the standard deviation σ) in the copper complex and to 1.307(2) Å (12σ) in the zinc complex (see tables S2a,b).Table 1. Crystal data and structure refinement for [Cu(oVATPNH2)2] (I) and [Zn(oVATPNH2)2] (II)
Independentreflections 2685 [R(int) = 0.0369] 2652 [R(int) = 0.0285]
Observed reflections [I>2σ(I)] 2267 2098
Completeness (%) 99.9 (to ϑ = 25.242°) 99.8 (to ϑ = 25.242°)
Refinement method Full-matrix least-squares on F2 Full-matrix least-squares on F2
Data / restraints / parameters 2685 / 67 / 207 2652 / 49 / 206
stabilization effect due to coordination to the metal is probably not strong enough to compensate for the conformational change needed by the ligand to act as tridentate.
Figure 2. Crystal packing of CuL2 (left) and ZnL(right)
3.2. Optimized geometries and their comparison with experimental data Deleted section
Geometrical parameters of both complexes were optimized using the computational procedure described in the experimental section 4.4 (see below). Geometrical parameters are listed in Table S6 of the Supplementary Information where the results for CuL2 and ZnL2 are compared with the experimental crystallographic data.
Optimized geometrical parameters for CuL2 show that the two ligands surrounding the metal ion are inequivalent, thus giving two values for each geometrical parameter. For bond distances and bond angles, the difference among the two calculated values for each inequivalent ligand is small, and therefore only average values are listed in Table S6. Nevertheless, as significant differences are observed in calculated dihedral angles of the two ligands, both values are included in the table. On the other hand, both ligands in complex ZnL2 are equivalent according to present calculations.
It can be appreciated in Table S6 that bond distances around metal ions are well described by the computational methodology used in this work. Calculated N-M bond distance is overestimated by 0.024 and 0.030 Å for CuL2 and ZnL2, respectively. For the O-M bond distance, calculated values also overestimated experimental data by 0.047 and 0.024 Å for CuL2 and ZnL2, respectively. Bond angles are very well described for Zn(II) complex with a maximum error of about 4 degrees. On the other hand, the bond angles with larger errors are those angles involved in the closest environment of Cu(II) ion. Errors are as large as 20 degrees for N-Cu-N’ and O1-Cu-O1’.
angles depart from experimental values by about 40 degrees, the environment around the Zn(II) ion is well described. Interestingly, the S-C1-C5-N angles exhibit the largest deviation from experimental measurements in both complexes
3.2. Vibrational Spectroscopy
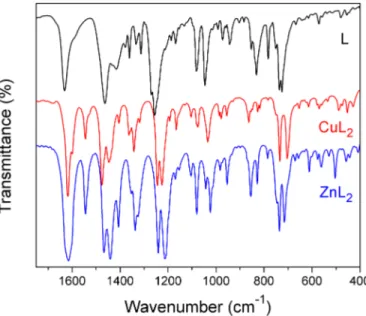
FTIR and Raman spectra of the complexes were registered and are presented in Figure S1 as Supplementary Information, they were analysed in comparison with the spectra of the free ligand we have previously reported. 19 Assignments were done based on reported data 43,44 and results on related species 13,45, and also assisted by DFT calculations. Changes in the frequency of the ligand vibrational modes were observed upon coordination to the metal. Moreover, new bands due to ligand-metal bonds appeared in the spectra of the complexes. The more relevant spectral region in the IR spectra of the ligand and the complexes is depicted in Figure 3. Selected relevant bands, assigned to modes involving coordinating atoms, are listed in Table 2 and a more complete list of spectroscopic information is available as supplementary information (table S6). As can be seen in the tables, calculations predicted a strong coupling of different modes at some frequencies.
Figure 3. IR spectra of the oVATPNH2 ligand (L) and the complexes CuL2 and ZnL2
spectra. In both cases, the O-M-O bands appear at higher wavenumbers than the N-M-N ones, as predicted by calculations and in accordance with the M-N distances longer than the M-O ones, also observed in related complexes involving N,O-donor ligands. The –N=C-C-C-O- moiety of each ligand bonded to the metal ion gives rise to a six-membered ring (coordination ring). In the complexes, vibrations of these rings are predicted at lower frequencies that the respective modes of the oVA ring. The ring stretching bands could not be detected, probably because they are overlapped with the intense bands near 1500 cm-1, due to the CH3 and CH2 bending modes. Nevertheless, weak bands related to de coordination ring deformations appeared at around 600 cm-1 (in-plane) and 400 cm-1 (out-of-plane).
Modes related to the o-Va and thiophene ring vibrations and those concerning the –CH2 and O-CH3 groups show slight changes in frequency and/or intensity upon complex formation, as they are not directly affected by coordination. In particular for CuL2 two close, or even coincident, values are calculated for each mode of the ligand in the complex. This is due to the presence of two no strictly equivalent ligands in the coordination sphere of the metal centre.
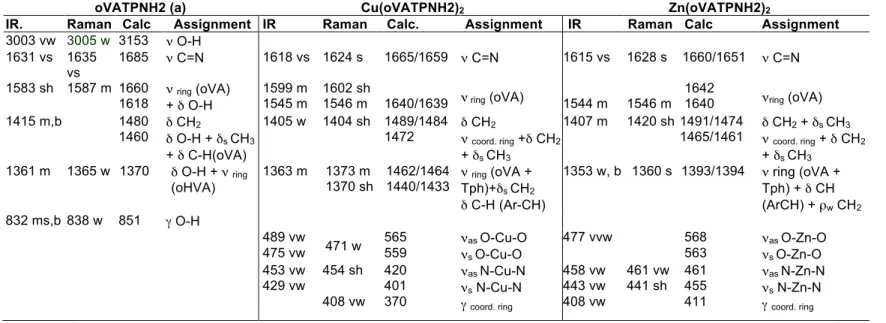
Table 2. Relevant bands in the vibrational spectra of CuL2 and ZnL2. Assignment and comparison with the free ligand data (wavenumbers in cm-1)
oVATPNH2 (a) Cu(oVATPNH2)2 Zn(oVATPNH2)2
(a) Data extracted from ref 19. vs: very strong, s: strong, m: medium, w: weak, vw: very weak, b: broad, sh: shoulder:
3.3. EPR Spectroscopy.
X-band EPR spectra of powdered solid samples of CuL2 at different temperatures are given as ESI (Figure S2). No relevant variations are observed in the studied temperature range. Despite the shape of the signal resembles an axial symmetry feature, the best fit is obtained for a rhombic distortion (see Figure 4). The calculated g-values are g1 = 2.240, g2 = 2.065 and g3 = 2.043, where the value of g1 is calculated with some uncertainty due to the broadness and weakness of the absorption in the parallel component. All the spectra are characteristic of dx2-y2 ground-state, in good agreement with the square-planar geometry around the metal centre in the crystal.
Figure 4. EPR spectrum of [Cu(oVATPNH2)2] (CuL2) at 150 K (solid line) together with the best fit (dashed line). Experimental details: modulation amplitude 0.1 mT, time constant 40.96 ms, conversion time 327.68 ms, gain 1 103 (short ranges) or 1 104 (long 0 ‒ 700 mT ranges) and power 20 mW. Microwave frequency 9.4260 GHz.
Calculated G-value 46 is 4.44 (see Equation 1), which suggests negligible magnetic exchange interactions, as expected for the monomeric character of the paramagnetic centre, in agreement with the vibrational spectroscopic results and supporting the predicted structure.
Equation 1
In order to have some information about the behaviour of the complex in solution, the X-band EPR spectra of a CuL2 5 10−4 M in (1:1) (DMSO:ethanol) are recorded. The room temperature spectrum is depicted in Figure S3 (ESI). Despite the low resolution, giso = 2.115 and Aiso = 82 G (81.0 10−4 cm−1) parameters can be deduced. The measurements carried out in frozen solution at 150 K are characteristic of a dx2
-y2 ground-state (Figure S4), and the best fit yields the following values: g|| = 2.224; A|| = 185 G (192.1 10−4 cm−1); and g⊥ = 2.055. The analogies of these g-values with those
calculated in solid state suggest that the molecular structure is roughly retained in solution. Finally, the representation of A|| vs. g|| falls in the area predicted by Blumberg and Peisach Peisach, 47 for Cu(II) complexes with 2N2O planar moieties, in good agreement with the coordination environment in CuL2.
3.4. Electronic Spectroscopy
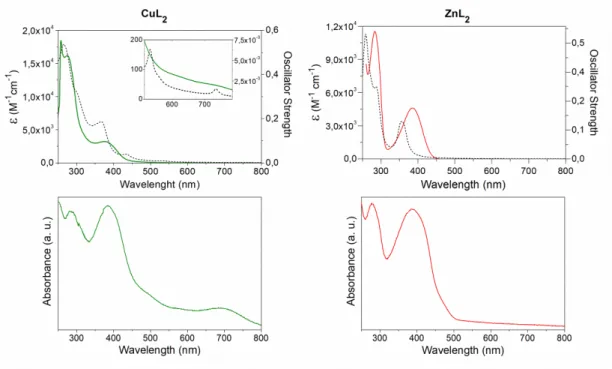
Electronic spectra of the complexes are recorded in DMSO solution (approximately 10-3 M and 10-5 M) in the 250-800 nm spectral range and diffuse reflectance spectra of the solids are also measured (see Figure 5).
Spectra in solution of the ligand and the complexes do not change during 48 hours, hence denoting their stability in the selected solvent. The absorption bands in solution were assigned with the assistance of theoretical calculations. Calculated electronic transitions are selected according to their oscillator strengths. Experimental and calculated spectra for each complex show a good accordance, as can be seen in Figure 5.
Figure 5: Top: Experimental (solid) and calculated (dashed) electronic spectra of the complexes registered for 5x10⁻⁵ M DMSO solutions. Higher concentration (5x10⁻³ M) was employed to register d-d transitions in complexes CuL2. Bottom: Diffuse reflectance spectra of solid samples.
experimental bands is considerably reduced. Graphical representations of the OM’s involved in the electronic transitions of CuL2 and ZnL2 (Figures S5 and S6, respectively) and their description are available as ESI.
When compared with the electronic spectra ofoVATPNH2, a blue shift of the intra ligand bands (at 263 and 331 nm in the free ligand) is observed in both complexes, as a consequence of coordination. Furthermore, charge transfer bands appear in the spectra in the expected wavelengths. It is interesting to mention that, d-d bands in the Cu(II) complex observed at 693 and 617 nm in solution and at 692 and 587 nm in the solid state are in accordance with a planar square environment of the d9 copper ion. Even though three bands are predicted for this symmetry, the one at higher energy is frequently hidden under the stronger charge transfer band. 48,49 In this case, deconvolution of the broad band at 381 nm shows the best fit considering two maxima, in accordance with the calculated transition.
The shifts in the band positions and the differences in intensity between the diffuse reflectance spectra obtained from the solid sample and the absorbance spectra in solution of each compound are a consequence of the different physical basis of both measurement method, the way in that data is analyzed and the expected solvent effect. 50 The results indicate that there are no significant changes in the metal environment when compared solid samples with solutions.
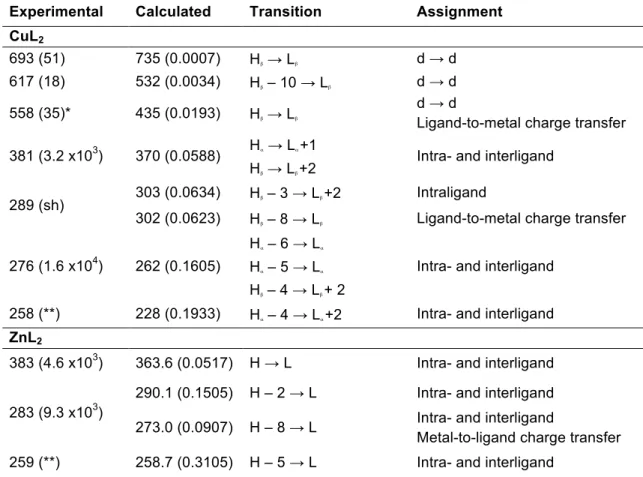
Table 3. Experimental and calculated electronic spectra of the complexes in DMSO solution. Band
maxima and transition energies are given in nm. Molar absorptivity (in M-1.cm-1) and calculated
oscillator strength (in atomic units) are in parentheses. The proposed assignment is also given. H and
L are used as short notation for HOMO and LUMO, respectively, whereas α and β refer to the
(*) The transition calculated at 435 nm in complex CuL2 presents two monoelectronic components from
the HOMOβ – 13 and the HOMOβ – 23 to the LUMOβ, which are responsible for the lower wavelength of
this transition with respect to the one calculated at 735 nm. The band found at 558 nm by deconvolution is hidden under the strong absorption with maximum at 381 nm.
(**) Undefined maxima due to solvent cut-off.
3.5. NMR Spectroscopy
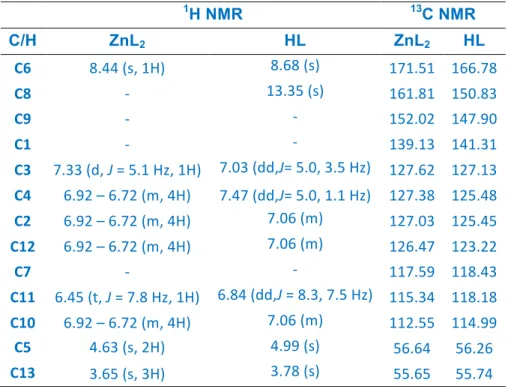
Table 4. 1H and 13C NMR of complex ZnL2 in (CD3)2SO solution. Data for the HL ligand is included for comparison. Chemical shifts δ (ppm), J (Hz) and assignments.
1H NMR 13C NMR
C/H ZnL2 HL ZnL2 HL
C6 8.44 (s, 1H) 8.68 (s) 171.51 166.78
C8 -‐ 13.35 (s) 161.81 150.83
C9 -‐ -‐ 152.02 147.90
C1 -‐ -‐ 139.13 141.31
C3 7.33 (d, J = 5.1 Hz, 1H) 7.03 (dd,J= 5.0, 3.5 Hz) 127.62 127.13
C4 6.92 – 6.72 (m, 4H) 7.47 (dd,J= 5.0, 1.1 Hz) 127.38 125.48
C2 6.92 – 6.72 (m, 4H) 7.06 (m) 127.03 125.45
C12 6.92 – 6.72 (m, 4H) 7.06 (m) 126.47 123.22
C7 -‐ -‐ 117.59 118.43
C11 6.45 (t, J = 7.8 Hz, 1H) 6.84 (dd,J = 8.3, 7.5 Hz) 115.34 118.18
C10 6.92 – 6.72 (m, 4H) 7.06 (m) 112.55 114.99
C5 4.63 (s, 2H) 4.99 (s) 56.64 56.26
C13 3.65 (s, 3H) 3.78 (s) 55.65 55.74
S:singlet, d: doublet, m: multiplet
3.6. Thermal analysis
The thermal behaviors of the ligand and the complexes were studied analyzing the TG and DT data obtained through the incineration of solid in oxygen flux (see Figure S11 in ESI).
In the TG and DT curves of the ligand, the melting point is observed at 70.5°C. At 165°C starts the decomposition involving several exothermic processes, losing the 59% of mass in a first step, consistent with the removal of the substituted benzene ring fragment. This is followed by the loss of the remaining ligand´s fragments, leading to a total weight loss of 97%.
Due to the thermal inertia during the heating process in the TG experiment, the recorded melting point values of the complexes have some differences with those determined in a Bockmonoscop “M” instrument.
3.7. Cytotoxicity Assays. Evaluation of metal dependent activity on cell viability in breast cancer cell lines (MCF7 and MDA-MB-231).
To test the effect of metal dependent cytotoxicity on cell viability two different breast cancer cell lines: MCF7 (breast adenocarcinoma) and MDA-MB-231 (triple negative breast adenocarcinoma) were assayed. These tumor cells were exposed to the ligand, the metal cation and the complex during 48 h. The anticancer activity of both complexes was investigated and compared with that of the free ligand (oVATPNH2) and respectively with CuII), Zn(II)) ions.
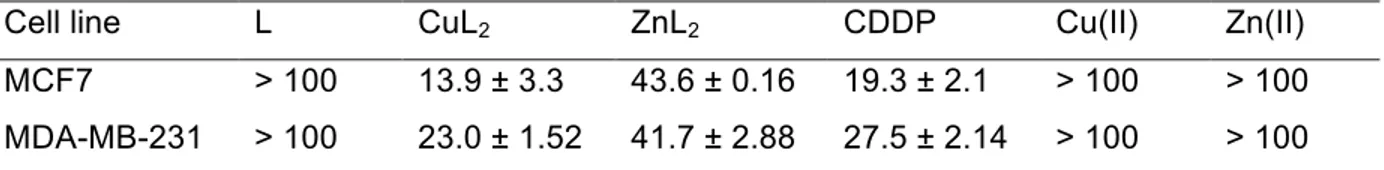
Table 5 shows the IC50 values of the complexes and data for the reference metallodrug cisplatin (CDDP) are included for comparison. As it can be seen, both complexes impaired cell viability on MCF7 and MDA-MB-231 cells in the range of concentration (10-50 µM). The table also indicates that CuL2 is a stronger antiproliferative agent than ZnL2 and has an even stronger anticancer activity than CDDP in both tested breast cell lines. On the other hand, the IC50 values of the free ligand and free metal cations are greater than 100 µM for both cell lines tested, hence revealing the important role of complexation to modulate the antitumor properties of this kind of compounds.
Table 5. IC50 (µM) values of complexes and CDDP on MCF7 and MDA-MB-231 after 48 h of incubation. Values for free ligand and metal ions are included for comparison.
Cell line L CuL2 ZnL2 CDDP Cu(II) Zn(II)
MCF7 > 100 13.9 ± 3.3 43.6 ± 0.16 19.3 ± 2.1 > 100 > 100 MDA-MB-231 > 100 23.0 ± 1.52 41.7 ± 2.88 27.5 ± 2.14 > 100 > 100
This positive effect has been described for other complexes of these metals and others such as platinum and palladium that have shown cytotoxic activity. 51,52 Particularly, copper have been more effective against both breast cancer cell lines (MCF7 and MDA-MB-231) than zinc. Comparison of IC50 values with other copper complexes reveals that this complex can be included in the active group, as a potential cytotoxic agent. 53 In this sense, copper(II) complex of 4'methoxy-5,7-dihydroxy-isoflavone showed moderate cytotoxic effectiveness against human breast cancer cells with IC50 values in the
MB-231 cells. 55The same cell specificity was observed for copper complexes with Schiff bases benzyl N-[1-(thiophen-2-yl)ethylidene] hydrazine carbodithioate and benzyl N-[1-(thio- phen-3-yl)ethylidene].56 The effectiveness of copper complex could be associated with its planar conformation, but further
mechanistic studies are required to determine the correlation. Results have been reported on some
copper complexes more effective than platinum compounds as antitumor agents on prostate and breast and cancer cells. 57Considering that generally copper compounds have less toxic side effects than platinum ones 58,59 it would be interesting to test this complex in further in vivo studies for breast cancer treatments.
4. Conclusions
The interaction of oVATPNH2 with Cu(II) and Zn(II) lead to the formation of stable complexes, namely [Cu(oVATPNH2)2] (CuL2) and [Zn(oVATPNH2)2] (ZnL2). Despite the presence of the S, N and O donor atoms in the ligand, it acts as a bidentate ligand through the phenoxo oxygen and the imine nitrogen atoms in both complexes.
The crystal structures of the complexes reveal a nearly square planar environment for the copper centre and a tetrahedral coordination sphere in the case of Zn cation. In both cases the thiophene ring appears almost perpendicular to the coordination plane in the ligand, increasing the deviation from the benzenic ring as compared with the free ligand.
Spectroscopic behaviour completely accords with the structural properties of the complexes and reveals that the coordination sphere is retained in solution. Calculated parameters and frequencies assisted the interpretation of the experimental results and show good agreement. The vibrational modes of the free ligand are consequently changed upon its deprotonation followed by coordination to the metal and new bands related to metal-ligand bonds are observed. For CuL2, the EPR spectra are characteristic of a dx2-y2 ground-states and the expected d-d transitions can be identified in the electronic spectra, according to the distorted square-planar environment of the Cu(II) centre.
Electronic Supplementary Information
Crystallographic structural data have been deposited at the Cambridge Crystallographic Data Centre (CCDC). Enquiries for data can be direct to: Cambridge Crystallographic Data Centre, 12 Union Road, Cambridge, UK, CB2 1EZ or (e-mail) deposit@ccdc.cam.ac.uk or (fax) +44 (0) 1223 336033. Any request to the Cambridge Crystallographic Data Centre for this material should quote the full literature citation and the reference numbers CCDC1844563 for complex CuL2 and 1844564for complex ZnL2. Geometrical parameters for complex CuL2 and ZnL2 (Tables S1 to S5); experimental and vibrational spectra along with the assignment (Table S6), FTIR and Raman spectra in the whole spectral range (Figure S1); EPR spectra of CuL2 solid sample (Figures S2) and in solution (Figures S3 and S4) at different temperatures, MOs involved in relevant electronic transitions of the complexes (Figures S5 and S6) and their description; RMN spectra for ZnL2 (Figures S7 to S10) and TG and DTA thermograms of both complexes (Figure S11) are available as ESI.
Conflicts of Interest
There are no conflicts of interest to declare.
Acknowledgments
This work was supported by CONICET-CCT- La Plata (PIP 0651 and 0034), ANPCyT (PICT 2016-1574) and UNLP (Argentina) and also by Consejería de Educación CyL and FFEDER BU076U16, BU022G18 and Ministerio de Economía y Competitividad CTQ2016-75023-C2-1-P and CTQ2015-70371-REDT MetDrugs Network (Spain). O.E.P, R.P.D., G.A.E, I.E.L, B.S.P.C and A.C.G.B are members of the Researcher Career of CONICET. M.R.R, J.D.P and L.M.B. are Doctoral Fellows of CONICET. The authors thank Drs. David Ibáñez Martinez and Gustavo Espino (Department of Chemistry, Universidad of Burgos, España) for Raman and NMR spectra, respectively. We are also grateful to one of the Reviewers for his valuable help with the modelling and refinement of disorder present in the crystal structures reported in this work.
References
1 - G L. Backes, D. M. Neumann, B. S. Jursic, Bioorg. Med. Chem. 2014, 22,4629-4636.
2 - C. M. da Silva, D. L. da Silva, L. V. Modolo, R. B. Alves, M. A. de Resende, C. V. B. Martins, Â. de Fátima, J. Adv. Res. 2011, 2, 1-8.
3 - S. A. Matar, W. H. Talib, M. S. Mustafa, M. S. Mubarak, M. A. AlDamen, Arab. J. Chem. 2015, 8, 850-857.
4 - M. Rudrapal, B. De, Int. Res. J. Pure. Appl. Chem. 2013, 3(3), 232-249.
6 - S. Bala, S. Kamboj and A. Kumar, J. Pharm Res. 2010, 3(12), 2993-2997.
13 - M. Khorshidifard, H. A. Rudbari, Z. Kazemi-Delikani, V. Mirkhani, R. Azadbakht, J. Mol. Struct. 2015, 1081, 494-505. Mutsvunguma and A. L. Edkins. Recent Pat. Anticancer Drug Discov. 2014, 9(2), 153-175.
19 - M. R. Rodríguez, J. Del Plá, O. E. Piro, G. A. Echeverría, G. Espino, R. Pis-Diez, B. S. Parajón-Costa, A C. González-Baró, J. Mol. Struct. 2018, 1165, 381-390.
20 - M. N. Patel, C. R. Patel, H. N. Joshi, Z. Anorg. Allg. Chem. 2012, 638, (7-8), 1224-1232. 21- C. Spinu, A. Kriza, Acta Chim. Slov. 2000, 47, 179-185
22 - A. B. Gündüzalp, B. Erk, Russian Journal of Inorganic Chemistry, 2010, 55(7), 1094-1102.
23 - J. F. Modder, J-M. Ernsting, K. Vrieze, M. de Wit, C.r H. Siam, G. van Koten1,Inorg. Chem. 1991, 30, 1208-1214.
24 - CrysAlisPro, Oxford Diffraction Ltd., version 1.171.33.48 (release 15-09-2009 CrysAlis171.NET) 25 - G. M. Sheldrick, Acta Crystallogr. 2008, A64, 112-122.
26 - SimFonia v1.25, Bruker Analytische Messtecnik GmßH, 1996. 27 - Kaleidagraph v3.5 Synergy Software, 2000.
28 - G. R. Fulmer, A. J. M. Miller, N. H. Sherden, H. E. Gottlieb, A. Nudelman, B. M. Stoltz, J. E. Bercaw, K. I. Goldberg, Organometallics 2010, 29, 2176-217.
29 - D. Becke, J. Chem. Phys. 1993, 98, 5648-5652.
34 - A. Klamt, G. Schüürmann, J. Chem. Soc., Perkin Trans. 1993, 2, 799-805. 35 - T.T.Mosmann, J. Immunol. Methods, 1983, 65, 55-63.
36 - L. J. Farrugia, J. Appl. Cryst. 1997, 30, 565.
37 - N. Novoa, T. Roisnel, P. Hamon, S. Kahlal, C. Manzur, H. M. Ngo, I. Ledoux-Rak, J. Y. Saillard, D. Carrillo, J. R. Hamon, Dalton. Trans. 2015, 44, 18019-18037.
38 – N. Revathi, M. Sankarganesh, J. Rajesh, J. D. Raja, J. Fluoresc. 2017, 27, 1801-1814.
39 - S. Sangeeta, K. Ahmad, N. Noorussabah, S. Bharti, M. K. Mishra, S. R. Sharma, M. Choudhary, J. Mol. Struct. 2018, 1156, 1-11.
40 – M. Enamullah, G. Makhloufi, R. Ahmed, B. A. Joy, M. A. Islam, D. Padula, H Hunter, G. Pescitelli, C. Janiak, Inorg. Chem. 2016, 55, 6449-6464.
41 – M. Khorshidifard, H. A. Rudbari, B. Askari, M. Sahihi, M. R. Farsani, F. Jalilian, G. Bruno, Polyhedron, 2015, 95, 1-13.
42 - M. Montazerozohori, A. Masoudiasl, S. Joohari, J. M. White, Mater. Sci. Eng. C, 2017, 77, 229-244.
43 - D. Lin-Vien, N. B. Colthup, W. G. Fately and J. G. Grasselli in: Infrared and Raman Characteristic
Frequencies of Organic Molecules, Academic Press, Boston, 1999.
44 - K. Nakamoto, in: Infrared and Raman Spectra of Inorganic and Coordination Compounds, Sixth ed., J. Wiley & Sons, Inc., Hoboken, New Jersey, 2009.
45 - A. C. González-Baró, R. Pis-Diez, C. A. Franca, M. H. Torre, B. S. Parajón-Costa, Polyhedron, 2010, 29, 959-968.
46 - B. J Hathaway, D. E. Billing, Coord. Chem. Rev. 1970, 5, 143-207. 47 - J.; Blumberg, W. E. Arch. Biochem. Biophys. 1974, 165, 691–708.
48 - I. M. Procter, B. J. Hathaway, P. Nicholls J. Chem. Soc. A, 1968, 1678-1684.
49 - A. B. P. Lever in Inorganic electronic Spectrocopy, 2nd Ed. Elsevier, Amsterdam, 1984.
50 - G. Kortüm in Reflectance Spectroscopy. Principles, Methods, Applications. Springer-Verlag, New York Inc. 1969.
51 - A. Matesanz , E. Jimenez-Faraco, M. C. Ruiz, L. M. Balsa, C. Navarro-Ranninger, I. E. León, A. G. Quiroga, Inorg. Chem. Front. 2018, 5, 73-83.
52 - I. E. Leon, J. Cadavid-Vargas, I.Tiscornia, V.Porro, S. Castelli, P. Katkar, A. Desideri, M. Bollati-Fogolin, S. Etcheverry J. Biol. Inorg. Chem. 2015, 20(7), 1175-1191.
53 - Sant- C. ini, M. Pellei, V. Gandin, M. Porchia, F. Tisato, C. Marzano, Chem. Rev. 2014, 114, 815-862.
56 - M. H. E. Chan, K. A. Crouse, M. I. M. Tahir, R. Rosli, N. Umar-Tsafe, A. R. Cowley, Polyhedron 2008, 27, 1141-1146.
57 - J. Grau, C. Renau, A. B. Caballero, A. Caubet, M. Pockaj, J. Lorenzo and P. Gamez, Dalton Trans. 2018, 47(14), 4902-4908.
58 - T. Wang, Z. Guo, Curr. Med. Chem. 2006, 13, 525-537 and references therein.
![Figure 1: View of [Cu(oVATPNH2) 2 ] (CuL 2 ) (left) and [Zn(oVATPNH2) 2 ] (ZnL 2 ) (right) showing the labeling of the non-H atoms and their displacement ellipsoids at the 30% probability level](https://thumb-us.123doks.com/thumbv2/123dok_es/3937962.669201/7.918.263.703.578.811/figure-ovatpnh-ovatpnh-showing-labeling-displacement-ellipsoids-probability.webp)
![Table 1. Crystal data and structure refinement for [Cu(oVATPNH2) 2 ] (I) and [Zn(oVATPNH2) 2 ] (II) CuL 2 ZnL 2 Empirical formula C 26 H 24 N 2 O 4 S 2 Cu C 26 H 24 N 2 O 4 S 2 Zn Formula weight 556.13 557.96 Temperature (K) 293(2) 294(2)](https://thumb-us.123doks.com/thumbv2/123dok_es/3937962.669201/8.918.190.787.126.793/crystal-structure-refinement-ovatpnh-ovatpnh-empirical-formula-temperature.webp)
![Figure 4. EPR spectrum of [Cu(oVATPNH2) 2 ] (CuL 2 ) at 150 K (solid line) together with the best fit (dashed line)](https://thumb-us.123doks.com/thumbv2/123dok_es/3937962.669201/12.918.346.553.343.529/figure-epr-spectrum-ovatpnh-cul-solid-line-dashed.webp)