Abundances in the Galactic bulge
5
0
0
Texto completo
(2) IOP PUBLISHING. PHYSICA SCRIPTA. Phys. Scr. T133 (2008) 014032 (4pp). doi:10.1088/0031-8949/2008/T133/014032. Abundances in the Galactic bulge B Barbuy1 , A Alves-Brito1 , S Ortolani2 , M Zoccali2 , V Hill3 , J Meléndez4 , M Asplund5 , E Bica6 , A Renzini7 , A Gómez3 and D Minniti8 1. Universidade de São Paulo, IAG, Rua do Matão 1226, São Paulo 05508-900, Brazil Dipartimento di Astronomia, Università di Padova, Vicolo dell’Osservatorio 2, I-35122 Padova, Italy 3 Observatoire de Paris-Meudon, 92195 Meudon Cedex, France 4 Centro de Astrofísica da Universidade de Porto, Rua das Estrelas, 4150-762 Porto, Portugal 5 Max Planck Institute for Astrophysics, Postfach 1317, 85741 Garching, Germany 6 Departamento de Astronomia, Universidade Federal do Rio Grande do Sul, CP 15051, Porto Alegre 91501-970, Brazil 7 Osservatorio Astronomico di Padova, Vicolo dell’Osservatorio 5, I-35122 Padova, Italy 8 Department of Astronomy and Astrophysics, Universidad Catolica de Chile, Casilla 306, Santiago 22, Chile 2. E-mail: barbuy@astro.iag.usp.br. Received 17 September 2008 Accepted for publication 19 September 2008 Published 19 December 2008 Online at stacks.iop.org/PhysScr/T133/014032 Abstract The metallicity distribution and abundance ratios of the Galactic bulge are reviewed. Issues raised by recent work of different groups, in particular the high metallicity end, the overabundance of α-elements in the bulge relative to the thick disc and the measurement of giants versus dwarfs, are discussed. Abundances in the old moderately metal-poor bulge globular clusters are described. (Some figures in this article are in colour only in the electronic version.). and Melendez et al (2008) include targets from BW only, except for Zoccali et al (2006, 2008) and Lecureur et al (2007) who observed three other fields besides BW. A better coverage of the bulge is being carried out by the BRAVA project, where radial velocities are being obtained for thousands of M giants in 32 fields along the minor and major bulge axes (Rich et al 2008).. 1. Introduction Dynamical models of the bulge/bar have been presented in the literature, e.g., Raha et al (1991), Kormendy and Kennicutt (2004) and Binney (2008). These models consider that classical bulges are the result of mergers, and can be found in Sa/Sb spirals, whereas later-type spirals have pseudo-bulges, formed through dynamical evolution of the bar that forms from discs. Dynamical models of bars formed from disc gas or disc stars are found in the literature. For example, Raha et al (1991) forms bulges from bars made of stars, whereas Combes (2007), for example, forms bars from gas. It is then expected that the bulge stellar population be similar to the inner parts of the disc, from which it formed (e.g., Athanassoula (2007)). Colour-magnitude diagrams (CMDs) and spectroscopic abundances have been obtained for giants in Baade’s Window (BW), and the results show, so far, that the bulge is old (Ortolani et al 1995, Feltzing and Gilmore 2000, Zoccali et al 2003) and metal-rich. The regions sampled by spectroscopic and photometric CMD data are, however, rather restricted in terms of l, b space coverage. Rich and Origlia (2005), Fulbright et al (2006, 2007), Cunha and Smith (2006), Zoccali et al (2006, 2008) 0031-8949/08/014032+04$30.00. 2. Abundance ratios Abundance ratios for bulge field giants were reported by Fulbright et al (2007), Cunha and Smith (2006), Zoccali et al (2006, 2008), Lecureur et al (2007) and Melendez et al (2008). In particular, the oxygen abundances derived by all these groups indicate an enhancement of oxygen relative to iron. Given the agreement between the five different groups, who used both the forbidden [OI] 630 nm and the infrared OH lines, it seems that the oxygen enhancement is a robust result. Zoccali et al (2006) and Lecureur et al (2007) derived O and Mg abundances in four fields, and no difference was found between them. On the other hand, Zoccali et al (2006), Lecureur et al (2007) and Fulbright et al (2007) found an overenhancement of the bulge α-elements O and Mg with respect to 1. © 2008 The Royal Swedish Academy of Sciences. Printed in the UK.
(3) Phys. Scr. T133 (2008) 014032. B Barbuy et al. et al 2002, 2005, 2005, 2008). The field points are from thick-disc dwarf stars by Reddy et al (2006) and bulge giants by Fulbright et al (2007). These discrepancies occurred in the past, for example, concerning oxygen abundances from the forbidden line at [OI] 630 nm and the permitted triplet lines at OI 7774–7 nm. The discrepancy is not yet totally explained, but is in good part due to NLTE effects on the permitted triplet lines. The same could be true for the Ca lines used in the optical versus infrared, and such possibilities will have to be investigated.. 3. Metallicity distribution Globular clusters. Zoccali et al (2008) presented the metallicity distribution for a large sample of about 800 bulge giants, observed in four fields, using FLAMES (Pasquini et al 2000). The fields are located at: BW: 1.◦14, −6.◦02, E(B–V ) = 0.46; NGC 6553 ◦ ◦ ◦ field: 5. 25, −3. 02, E(B–V ) = 0.70; Field at −6◦ : 0. 21, ◦ ◦ ◦ −6. 02, E(B–V ) = 0.48; Blanco field at −12◦ : 0. 00, −12. 00, E(B–V ) = 0.20. In the BW field, two clear peaks are seen around [Fe/H] = +0.3 and −0.25. Progressively along the minor axis, at −6◦ and −12◦ , the peak at [Fe/H] = +0.3 gets weaker. A gradient of stellar populations is therefore seen, and kinematical studies are under way to better understand the metal-rich component. The high end of the metallicity distribution is also presently being studied in the literature. The metallicity distributions of Zoccali et al (2008) for the four fields give a highest metallicity star at around [Fe/H] ≈ +0.5. The results by Sadler et al (1996) based on indices showed a high end of the metallicity distribution at [Fe/H] = +1.0. Recalibrations of Sadler et al’s data using high resolution spectroscopy of 11 giants by McWilliam and Rich (1994) and 27 giants analysed by Fulbright et al (2006) keep the high metallicity end at +1.0 dex, despite the high-resolution results being limited to +0.5 dex. Given that metal-rich cool giants, showing strong TiO bands, have their indices MgFe, Mg2 and Fe affected by the TiO bands, the high metallicities of [Fe/H] ≈ 1.0 could be a spurious result. Still, Johnson et al (2007, 2008) and Cohen et al (2008) derived metallicities for three microlensed dwarfs in the Galactic bulge and found [Fe/H] = +0.5 for all of them. They argue that the highest metallicity dwarf stars do not become giants, which would explain the cut at [Fe/H] ≈ +0.5 in the metallicity distribution by Zoccali et al (2008). However, stellar evolution modellers tell us that an extreme wind would be necessary for this to happen and that this is unlikely. Also, extreme horizontal branch stars should be seen in the CMDs. Finally, we would like to call attention to a bulge-like population present in the solar neighbourhood. They are old, with pericentric distances of Rper ≈ 3.5 kpc and very low maximum height Z max . In Pompeia et al (2008, in preparation), it is shown that abundances of α-elements are intermediate between the bulge and the thick disc, and a check of the high metallicity end for these stars is being carried out, in collaboration with Professor Bengt Gustafsson.. Bulge stars: Fulbright et al. (2007) Thick disk stars: Reddy et al. (2006). Figure 1. [Ca/Fe] versus [Fe/H] for bulge globular clusters. The field-star points are from Reddy et al (2006) for thick-disc dwarfs and Fulbright et al (2007) for bulge giants. The lower abundances result from optical spectra, whereas the higher abundances result from NIR spectra.. results for thick-disc dwarfs by Bensby et al (2004). An overenhancement relative to the thick disc was found for the α-elements Si, Ca and Ti, which was also found by Fulbright et al (2007). However, Melendez et al (2008) compared bulge giants with thick-disc giants, all observed and analysed in the same way, and they find that O, Mg, Si, Ca and Ti of bulge and thick-disc giants overlap each other. Given the implications of the bulge being identified with the thick disc, or not, concerning the bulge formation process, further efforts on this would be necessary to confirm either of the conclusions. 2.1. IR versus optical Abundances of bulge field giants using near-infrared (NIR) spectra were presented by Rich and Origlia (2005), Cunha and Smith (2006) and Melendez et al (2008). The oxygen abundances derived fit well the optical results, as already mentioned above. However, a systematic determination of oxygen abundances from the optical and NIR for the same stars has not been done so far. Ryde (2008, this volume) presents oxygen abundances derived from NIR CRIRES data for the same sample stars of Zoccali et al (2006) and detected an overenhancement of oxygen relative to optical data. Such discrepancies are being studied. Another clear discrepancy is found between NIR and optical data, for Ca abundances. In figure 1, we plot the Ca abundances derived for bulge globular cluster giants: the lower abundances are all derived from optical data, whereas the higher abundances are all derived from NIR data (Alves-Brito 2008, Barbuy et al 2006, 2007, Gratton et al 2006, Carretta et al 2007, Origlia and Rich 2004, Origlia 2.
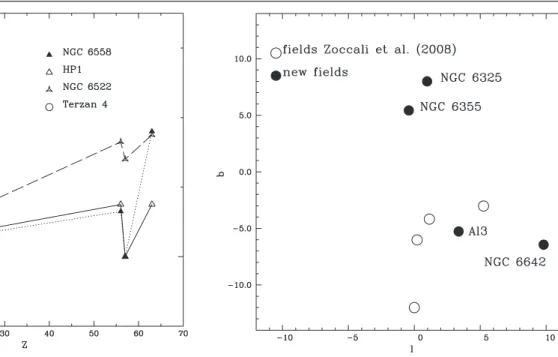
(4) Phys. Scr. T133 (2008) 014032. B Barbuy et al. Figure 2. Abundance pattern of bulge metal-poor globular clusters: Terzan 4 of [Fe/H] = −1.6 (Origlia and Rich 2004) and HP 1, NGC 6558, NGC 6522 of [Fe/H] ≈ −1.0 (Barbuy et al 2006, 2007, 2008).. Figure 3. Location in l, b of the four fields analysed by Zoccali et al (2008) and four BHB intermediate metallicity globular clusters being studied by our group.. however, would indicate that the bulge and old thick disc show the same abundance ratios and could have formed in the same process. Given that the CMDs available for bulge fields show an old age, the bulge formation should have happened early, and if this process involves the dynamical evolution of a bar, the bar should have formed at early times. Globular clusters in the Galactic bulge are probes of stellar populations originally from the bulge, but also halo and thick disc ones. The BHB combined to a moderate metallicity around [Fe/H] ≈ −1.0 form a sample of probably the oldest globular clusters in the Galaxy. The three (NGC 6522, NGC 6558 and HP 1) clusters of this kind so far studied show shallow abundance ratios, different from halo clusters and field stars at the same metallicity, and this could be an abundance pattern typical of the early bulge.. 4. Bulge globular clusters We have identified a number of blue horizontal branch (BHB) clusters with metallicities around [Fe/H] ≈ −1.0. Within 10◦ and R < 4 kpc of the Galactic centre, 36 clusters are found, half of them metal-rich ([Fe/H] > −0.6) and the other half metal-poor. Around eight of them show the BHB with intermediate metallicity. From the detailed analyses of three, namely HP 1 (Barbuy et al 2006), NGC 6558 Barbuy et al (2007) and NGC 6522 (Barbuy et al 2008, in preparation), the abundance patterns are very similar among them—see figure 2, and their abundances are different from the halo pattern. The very metal-poor cluster Terzan 4 (Origlia and Rich 2004) shows an abundance pattern similar to halo field and cluster stars. Terzan 4 could be a ‘normal halo’ cluster, whereas the BHB intermediate metallicity ones might be a typical early bulge sample. In figure 3, we show the locations of the four fields analysed by Zoccali et al (2008) and the location of four BHB intermediate metallicity clusters being studied by our group. These observations being obtained with FLAMES should allow us to also study the surrounding fields, helping to understand the bar/bulge configuration.. Acknowledgment BB acknowledges grants from CNPq and Fapesp for participation in this meeting.. Appendix: Discussion 5. Conclusions. Q: (Ulrike Heiter) Of the 160 globular clusters known in the Milky Way, 80 are located towards the bulge. Is this the real distribution or are there some selection effects? A: I would believe that there should be more globulars towards the bulge, that are hidden by the dust. Q: (Bengt Gustafsson) If the bulge is very old you could expect to find some very metal-poor stars there. Would you comment on the possibilities of finding such stars? Also, how metal-poor are the most metal-poor globular clusters there?. A better coverage of the Galactic bulge is needed in terms of CMDs and abundances in order to have a better understanding of the bar/bulge configuration. New fields are being studied by our group (figure 3), and an important radial velocity survey (BRAVA) in 32 bulge fields is being carried out by Rich et al (2007). Zoccali et al (2006), Lecureur et al (2007) and Fulbright et al (2007) found overenhancement of α-elements relative to thick-disc stars. Recent work by Melendez et al (2008), 3.
(5) Phys. Scr. T133 (2008) 014032. B Barbuy et al. A: 3CDM models predict that population III and the oldest stars should be found in bulges (White and Springel 2000; Diemand et al 2005). However we do not detect many metal-poor stars. Q: (Sofia Feltzing) You showed, in the Ca/Fe versus Fe plot, two determinations of abundances for NGC 6528. Why do they differ so much—are they both from visual spectra—I seem to remember that there are two visual studies that show large discrepancies. A: The differences found a few years ago between different optical studies were understood, and the results have converged. A detailed comparison for NGC 6553 (a globular cluster twin of NGC 6528) was presented in section 4.2 of Alves-Brito et al (2006). Figure 1 presented here indicates systematic and huge differences between Ca abundances obtained in the optical versus infrared. Q: (Harm Habing) Have all globular clusters been formed in our Galaxy, or have some been captured from an infalling dwarf galaxy? A: There should be accretion, at least it is clearly the case of the globulars in the Sagittarius dwarf, and a few younger ones captures from the Magellanic Clouds. Probably there are others in such case, and not yet clearly identified as such (for example, those that have retrograde orbits).. Combes F 2007 Formation and Evolution of Galaxy Bulges vol 245 ed M Bureau, E Athanassoula and B Barbuy (Cambridge: Cambridge University Press) pp 151–60 Cunha K and Smith V V 2006 Astrophys. J. 651 491–501 Feltzing S and Gilmore G 2000 Astron. Astrophys. 355 949–65 Fulbright J, McWilliam A and Rich R M 2006 Astrophys. J. 636 821–41 Fulbright J, McWilliam A and Rich R M 2007 Astrophys. J. 661 1152–79 Gratton R G, Lucatello S, Bragaglia A, Carretta E, Momany Y, Pancino E and Valenti E 2006 Astron. Astrophys. 455 271–81 Johnson J, Gal-Yam A, Leonard D C, Simon J D, Udalski A and Gould A 2007 Astrophys. J. 655 L33–6 Johnson J, Gaudi B, Sumi T, Bond I A and Gould A 2008 Astrophys. J. 685 508–20 Kormendy J and Kennicutt R C J 2004 Annu. Rev. Astron. Astrophys. 42 603–83 Lecureur A, Hill V, Zoccali M, Barbuy B, Gomez A, Minniti D, Ortolani S and Renzini A 2007 Astron. Astrophys. 465 799–814 McWilliam A and Rich R M 1994 Astrophys. J. Suppl. Ser. 91 749–91 Melendez J et al 2008 Astron. Astrophys. 484 L21–5 Origlia L and Rich R M 2004 Astron. J. 127 3422–30 Origlia L, Rich R M and Castro S 2002 Astron. J. 123 1559–69 Origlia L, Valenti E and Rich R M 2005 Mon. Not. R. Acad. Sci. 356 1276–82 Origlia L, Valenti E and Rich R M 2008 Mon. Not. R. Astron. Soc. 388 1419–25 Origlia L, Valenti E, Rich R M and Ferraro F R 2005 Mon. Not. R. Acad. Sci. 363 897–904 Ortolani S, Renzini A, Gilmozzi R, Marconi G, Barbuy B, Bica E and Rich R M 1995 Nature 377 701 Pasquini L, Gerardo A, Allaert E, Ballester P and Biereichel P E A 2000 Proc. SPIE 4008 129–140 Raha N, Sellwood J A, James R A and Kahn F D 1991 Nature 352 411 Reddy B E, Lambert D L and Allende Prieto C 2006 Mon. Not. R. Acad. Sci. 367 1329–66 Rich R M, Howard C, Reitzel D B, Zhao H and de Propris R 2008 Formation and Evolution of Galaxy Bulges (IAU Symposium vol 245) ed M Bureau, E Athanassoula and B Barbuy pp 333–8 Rich R M and Origlia L 2005 Astrophys. J. 634 1293–9 Sadler E M, Rich R M and Terndrup D M 1996 Astron. J. 112 171 Zoccali M, Hill V, Lecureur A, Barbuy B, Renzini A, Minniti D, Gomez A and Ortolani S 2008 Astron. Astrophys. 486 177–89 Zoccali M, Lecureur A, Barbuy B, Hill V, Renzini A, Minniti D, Momany Y, Gomez A and Ortolani S 2006 Astron. Astrophys. 457 L1–4 Zoccali M, Renzini A, Ortolani S, Greggio L, Saviane I, Cassisi S, Rejkuba M, Barbuy B, Rich R M and Bica E 2003 Astron. Astrophys. 399 931–56. References Alves-Brito A 2008 PhD Thesis Universidade de São Paulo Alves-Brito et al 2006 Astron. Astrophys. 460 269–76 Athanassoula E 2007 Formation and Evolution of Galaxy Bulges vol 245 ed M Bureau, E Athanassoula and B Barbuy (Cambridge: Cambridge University Press) pp 93–102 Barbuy B, Zoccali M, Ortolani S, Minniti D, Hill V, Renzini A, Bica E and Gomez A 2007 Astron. J. 134 1613 Barbuy B et al 2008 in preparation Barbuy B et al 2006 Astron. Astrophys. 449 349–58 Bensby T, Feltzing S and Lundstrom I 2004 Astron. Astrophys. 415 155–70 Binney J 2008 Formation and Evolution of Galaxy Bulges (IAU Symposium vol 245) ed M Bureau, E Athanassoula and B Barbuy pp 455–8 Carretta E, Bragaglia A, Gratton R G, Momany Y, Recio-Blanco A, Cassisi S, François P, James G, Lucatello S and Moehler S 2007 Astrophys. J. 464 967–81 Cohen J, Huang W, Udalski A, Gould A and Johnson J 2008 Astrophys. J. 682 1029–40. 4.
(6)
Figure
![Figure 1. [Ca/Fe] versus [Fe/H] for bulge globular clusters. The field-star points are from Reddy et al (2006) for thick-disc dwarfs and Fulbright et al (2007) for bulge giants](https://thumb-us.123doks.com/thumbv2/123dok_es/7264844.439042/3.892.77.438.99.454/figure-versus-globular-clusters-points-reddy-dwarfs-fulbright.webp)
Documento similar
As reported above, OTU 1, OTU 2, and OTU 6 showed different abundances according to the farming condition, having higher abundances in both tomato genotypes grown under OF; OTU 5
Recent observations of the bulge display a gradient of the mean metallicity and of [Ƚ/Fe] with distance from galactic plane.. Bulge regions away from the plane are less
[r]
So reaction is fastest between most abundant, least charged pairs of nuclei, and increase in T is needed to make slower reactions significant.. H-burning is by far the
In each panel, we show two MDFs derived from the simulations: one based upon the use of all star particles belonging to the bulge, after ap- plication of the kinematic
As compared to high metallicity disc H II regions, CNSFR show values of the O 23 and the N2 parameters whose distributions are shifted to lower and higher values, respectively,
Ia, and also partially due to mas yields. Therefore, both IMF and massive stellar yields are playing a role here. It is evident that a ‘by eye’ inspection of these panels would
We also plotted the total oxygen abundances calculated from the electron temperatures measured using the direct method, only for the long-slit data of knot B, and those estimated
