Modeling the relationship between knowledge components and students’ skills in learning high school algebraic expression using the AHM
15
0
0
Texto completo
(2) Journal for Educators, Teachers and Trainers, Vol. 10 (1) ISSN 1989 – 9572 http://www.ugr.es/~jett/index.php. Modeling the relationship between knowledge components and students’ skills in learning high school algebraic-expression using the AHM Modélisation de la relation entre les composantes de connaissances et les compétences d’élèves pour l’apprentissage de l’expression algébrique dans les écoles secondaires à l’aide de la méthode AHM Shiva Mafakheri, [email protected] Ahmad Shahvarani Semnani, [email protected] Mohammad Hassan Behzadi, [email protected] Ali Barahmand, [email protected] Islamic Azad University, Iran Abstract: The purpose of this study is to apply the Attribute Hierarchy Method (AHM) in the cognitive domains of algebraic expressions to find cognitive inferences about students’ mathematical problem-solving skills. Initially, cognitive content techniques were developed to determine the knowledge and skills needed to solve mathematical assignments. Then, items were written specifically to assess skills in cognitive models. Finally, confirmatory psychometric analyses were used to evaluate students' response information by estimating the proportionality of the data model, attribute probabilities to report the diagnostic score and attri bute validity. The first domain is concerned with the cognition and diagnosis of general polynomials and algebraic expressions and encompasses other areas. Therefore, the focus is on the precise definition of the basic concepts of the recognition of polynomials such as the polynomials and the number of very important terms and similar monomials and incorrect learning of algebra. Nevertheless, in the second domain, which focuses on simplification and related concepts, less emphasis has been placed on the seventh to ninth grades. The defect in the expression and practice of this field leads to weakness in solving and analyzing relevant mathem atical problems. The third domain is related to the second domain and directly to the first domain. Factorization and distributive properties are often used without considering the rules of simplification by students. The weakness associated with the second domain causes the students not to be able to easily analyze and solve the problem in difficult polynomials in which the rules do not apply easily Résumé: L’objectif principal de cette étude est d’appliquer la méthode de hiérarchie d'attributs dans les domaines cognitifs d’expressions algébriques pour trouver d’inférences cognitives concernant les compétences d’élèves en résolution de problèmes mathématiques. Initialement, des techniques de contenu cognitif ont été développées pour déterminer les connaissances et les compétences nécessaires pour résoudre des problèmes de mathématiques. » Ensuite, l’on a écrit d’articles spécifiquement pour évaluer les compétences en modèles cognitifs. Enfin, des analyses psychométriques de confirmation ont été utilisées pour évaluer les informations sur la réponse d’étudiants en estimant la proportionnalité du modèle de données, les probabilités d’attributs pour rendre compte du résultat diagnostique et la validité d’attributs. » Le premier domaine concerne la connaissance et le diagnostic des polynômes généraux et des termes algébriques, et comprend d'autres domaines. Conséquemment, l’accent est mis sur la définition précise de concepts de base de la reconnaissance des polynômes tels que les polynômes et le nombre de termes très importants et de monômes similaires et l’apprentissage incorrect de l’algèbre. Cependant, dans le deuxième domaine, qui met l'accent sur simplification et concepts connexes, moins d'attention a été accordée aux septième à neuvième années. Le défaut d ans l'expression et dans la pratique de ce domaine entraîne une faiblesse dans résolution et analyse de problèmes mathématiques pertinents. Le troisième domaine est lié au deuxième domaine et directement au premier domaine. La factorisation et les propriétés distributives sont souvent utilisées sans tenir compte des règles de simplification appliquées par les étudiants. La faiblesse du deuxième domaine empêche les étudiants d'analyser et de résoudre facilement le problème dans des polynômes difficiles dans lesquels les règles ne s'appliquent pas facilement Keywords: Algebra expressions; Attribute Hierarchy Method; Cognitive diagnostic assessment Mots-clés: Expressions algébriques; Méthode de Hiérarchie d'Attributs; Évaluation diagnostique cognitive. Journal for Educators, Teachers and Trainers JETT, Vol. 10 (1); ISSN: 1989-9572. 203.
(3) 1. Introduction The purpose of this study is to apply the Attribute Hierarchy Method (AHM) to a sample of algebra items to illustrate how the method can promote diagnostic inferences about examinees’ cognitive skills. The AHM is a psychometric method for classifying examinees’ test item responses into a set of structured attribute patterns associated with different components from a cognitive model of task performance. An attribute is a description of the procedural or declarative knowledge needed to perform a task in a specific domain. Unfortunately, the impact of cognitive theory on the test design has been considered less (Gierl, Cui, & Hunka, 2007;Gierl, Leighton, & Hunka, 2007; Leighton, Gierl, & Hunka, 2004).Embretson believed that test developers had been slow in integrating cognitive theory with psychometric methods because they did not have a framework in order to use this theory in the development of the test. Also he said that cognitive theory cannot affect the test method until its role is explicitly considered in the design of the test. It has been used to validate various structures, including verbal reasoning, abstract reasoning, the spatial reasoning of paragraph comprehension, and mathematical problem-solving (Embretson, 1995, P.179-197). Advantages of Analytical Hierarchy Process: "The Attribute Hierarchy Method (AHM) is a collection of judgments, decisions, and personal valuations in a rational way. Therefore, on the one hand, it is related to personal and experiential impressions, and on the other hand, it relates to the logic, understanding, experience of decision making and ultimate judgment" (Leighton and Gierl,2007,P.3-16). The characteristics of the hierarchical analysis process are as follows: -. -. -. -. Uniqueness and Unity Model: The hierarchical analysis process is a unique, simple, and flexible model for solving a wide range of unstructured issues which is easily comprehensible by everyone. Complexity: In order to solve complex problems, the hierarchical analysis process uses both systemic and component analysis concurrently. On the whole, people are analyzing things through a holistic or atomistic perspective. While the hierarchy analysis process uses both of these dimensions together. Interdependence: it considers the dependence analysis hierarchy process linearly. But it is also used to solve problems where components are nonlinear Hierarchical structure: The hierarchical analysis process organizes the components of a system in a hierarchical manner, which is organized in accordance with human thought and components are classified at different levels. Measurement: A measurement hierarchy process is developed to measure qualitative criteria and provides a method for estimating and prioritizing priorities. Consistency: The hierarchical analysis process of logical compatibility calculates and presents the judgments used in determining priorities. Synthesis: The process of analyzing hierarchy results in the estimation of the final rating of each option. Tradeoffs: considers the hierarchy analysis process to prioritize factor-dependent factors in a system and to balance between them, enabling an individual to choose the best option based on his goals. Consensus and Judgment: The hierarchical analysis process does not insist on group consensus, but it can provide a combination of various judgments. Repetition Process: The hierarchy analysis process enables an individual to correct his definition of an issue and improve his judgment and decision (Gierl, Cui & Hunka, 2007;Gierl, Leighton & Hunka, 2007).. The Attribute Hierarchy Method (AHM): "It is a set of judgments, decisions, and personal valuations in a rational way. Therefore, on the one hand, it is related to personal perceptions and experiences and on the other hand, it relates to the logic, understanding, and experience of decision-making and ultimate judgment" (Leighton and Sternberg, 2003). Initially, the cognitive areas of learning and education of algebraic terms were studied and classified according to the books taught at the secondary level. Cognitive Models for Cognitive Diagnostic Assessment (CDA) have at least four descriptive characteristics. First, the model involves skills that are on a small scale, because these skills. Journal for Educators, Teachers and Trainers JETT, Vol. 10 (1); ISSN: 1989-9572. 204.
(4) should identify the underlying cognitive processes of the test function. This small scale should also be continuously identified, so that knowledge and skills can be arranged in the model to illustrate the types of diagnostic interpretations presented in the score report. Second, skills must be measurable. Each skill should be described in such a way as to allow a test builder to create an item to measure that skill. Third, skills must be structurally appropriate for a wide range of educational practitioners, including students, parents, and teachers (Alves, 2011). Diagnostic skills will be reported as scores for practitioners, and these grades are intended to guide the treatment of educational disability and training. Hence, feedback should be clearly communicated. Fourth, a cognitive model will often show a hierarchy of disciplines in one domain, because cognitive processes, affiliations, and performance in a network share more than in-house processes, competencies, and skills (Lim, Sia, Chew, Kor & Tan, 2017).. 2. Methodology 2.1. Participants In the beginning, 11 items for students' exam questions were designed and developed with the cooperation of 15 math Educators and experienced math teachers. In a random sample of 25 students, first, the Difficulty Index and Discrimination Index of the questions were calculated and then the questions were returned to seven of the high school experienced math teachers and mathematical educators so that about the definition of Cohen’s kappa coefficient, they arrived at an agreement. After doing this, the pre-implementation tests were conducted for 300 high school students in the tenth grade of the school and the results were collected in a matrix. In the matrix adjustment phase, the final 286 responses from the tests were analyzed. First domain (recognition and diagnosis): It means recognizing polynomials and basic definitions of algebra in the algebraic expressions, such as the principle of the integral domain; placement of variables is the base of the associated basic. Second domain (simplification): It means the use of basic subtraction and multiplication of algebraic expressions in problems related to the algebraic expressions. Third domain (Factorization, distributive and simplification): to find the unknown values or usage in rational expressions and problem simplification. Based on the amount of overlapping of the contents in different fields of the case and after several screenings the initial design of the questions began. In this design, according to the main formula in the AHM method, the matrix should contain 11elements representing 11 items or questions (Table1).. Journal for Educators, Teachers and Trainers JETT, Vol. 10 (1); ISSN: 1989-9572. 205.
(5) Table1. Questionnaire Field 1: Recognition: Means recognition of polynomials and basic definitions in algebraic algorithms, such as the correct field, placement of variables and etc. Item 1: If (x + 1) (m-1) = 0 and m ≠ 1, what is the value of x? A) 2 b) 1 c) 0 d) 1 e) 2 Item 2: If 4a + 4b = 3c-3d, then what is the result (2a + 2b) / (5c-5d)? A) 2/5 b) 4/3 c) 3/4 d) 8/15 e) 3/10 Item 3: What is the value of 3𝑥 3 + 2y for x = -1 and y = 3? A) 3b) 7 c) 5d) 5 e) 7Field 2 - Simplification: means the use of subtraction and multiplication in algebraic expressions as basic and elemental in issues related to algebraic expressions Item 1: What is the result of the following : - (8x-2y-5) +3 (y-7x + 9) A) -y + 15x-34 b) 29x-5y-32 c) y-15x + 4 d) 5y-23x + 32 E) -29x + 5y + 32 Item 2: What is the simplified of -2c - [- 5c - [- 8c- (5c-3)]]? A) -20c-30 b) -10c + 3 c) 20c + 3 d) -10c-3 e) 10c-3 Item 3: what is the number of resulting sentences (x-y + z). (m + n + p)? A) 9 B) 6 C) 3 D) 12 E) 5 Item 4: What is the circumference of this shape algebraically and also the normal value for x = 2 and π = 3? A) 52 and 20x + 12 b) 10x + 12.32 c) 46 and 17x + 12 D) 48 and 18x + 12 e) 42 and 15x + 12. 5x+6 2x. Field 3- Factorization and diffusion simplification to find missing values or use in rational expressions and issues Item 1: The algebraic expression 42 𝑥𝑦 3 − 35𝑥 2 𝑦 2 is the same as which option? a) 7𝑥 2 𝑦 2 (6𝑦 − 5) b)7𝑥𝑦(6𝑥𝑦 2 − 5xy) c)6𝑥𝑦 2 (7𝑦 − 5𝑥 2 ) d)7𝑥𝑦 2 (6𝑦 − 5𝑥) e) 6𝑥𝑦 2 (7𝑦 − 5𝑥) Item 2: what is the simplified of the following expression? (x, y ≠ 0). 𝒙𝟒 𝒚𝟑 − 𝒙𝟑 𝒚𝟒 𝒙𝟓 𝒚𝟒 −𝒙 𝟒 𝒚𝟓. =?. A) x.y b) 1 / (x.y) c) (x-y) / (x + y) d) (x + y) / (x-y) Item 3: What is the result of the expression (-2m-3n) (- 3n-2m)? A) -6 m2 -15mn + 6 n2 b) 6 m2+ 15mn + 6 n2 C) -6 m2 -15mn-6 n2 d) 6 m2-15mn-6 n2 e) 6 m2+ 15mn-6 n2 Item 4: What is the common factor between x2-3x + 2 and x4-5 x2 + 4? A) (x-2) (x-1) b) (x + 2) (x-1) c) (x + 2) (x + 1) D) (x-2) (x + 1) e) (x-1) (x + 1). e) x / y. Questions were sent to 5 distinguished professors to find the agreement coefficient. 2.2. Procedure The authors created the cognitive models using the content described in the evidence, the secondary mathematics program of studies with progress indicators. The program studies beliefs about mathematics, algebra and polynomials in three areas of math operations, factor. Journal for Educators, Teachers and Trainers JETT, Vol. 10 (1); ISSN: 1989-9572. 206.
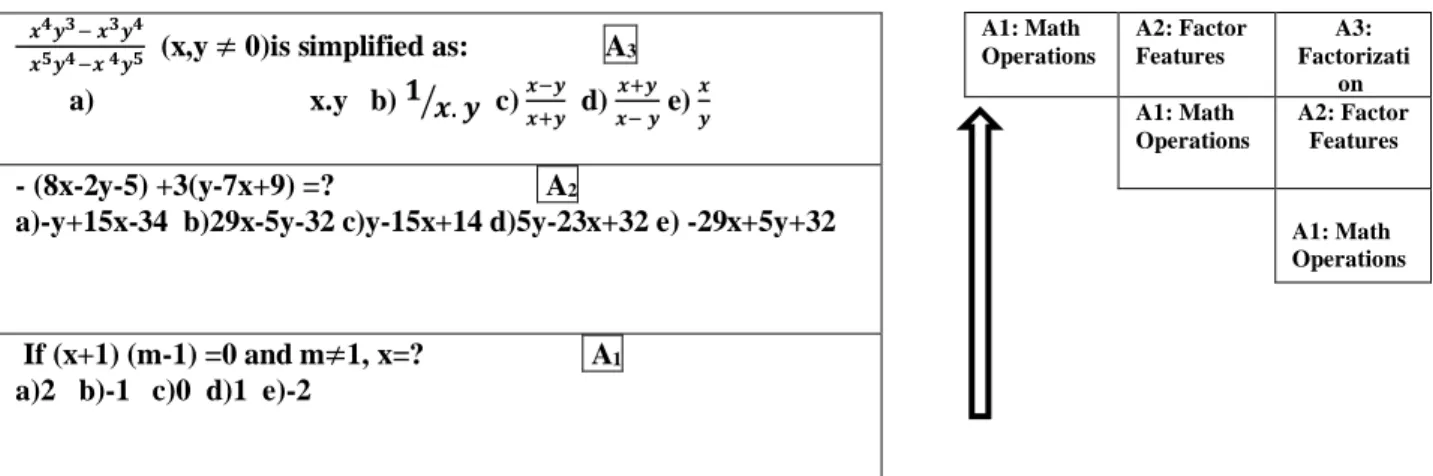
(6) features and factorization. Cognitive models created by the test director were examined by three Mathematics educators who worked with student teachers. This foundation was essential in recognizing student learning and learning among content experts for the development of cognitive models because they identified little knowledge and skills needed to solve problems in mathematics, arranged these skills in each model, and these attributes described cognition in a way that is both structurally clear and meaningful for a large group of educational actors. To facilitate this survey, content specialists from Mathematics Program provided evidence of a study and a description of the Diagnostic Mathematics project. The initial created by the test director was evaluated and modified. The first key change was the introduction and development of the terms "knowledge" and "skill" by content specialists. These statements were later used by content specialists to create small cognitive skills, which ultimately included cognitive skills. Subsequently, the wording of the terms of knowledge and skills was revised, so the small scale remained constant in all areas of content and the terms were educationally relevant for teachers. Similarly, the cognitive model includes all diagnostic skills sorted in four areas of content at high school level. Cognitive Models for Cognitive Diagnostic Assessment (CDA) have at least four descriptive characteristics. First, the model involves skills that are on a small scale, because these skills should identify the underlying cognitive processes of the test function. This small scale should also be continuously identified, so that knowledge and skills can be arranged in the model to illustrate the types of diagnostic interpretations presented in the score report. Second, skills must be measurable. Each skill should be described in such a way to allow a test builder to create an item to measure that skill. Third, skills must be structurally appropriate for a wide range of educational practitioners, including students, parents, and teachers. Diagnostic skills will be reported as scores for practitioners, and these grades are intended to guide the treatment of educational disability and training. Hence, feedback should be clearly communicated. Fourth, a cognitive model will often show a hierarchy of disciplines in one domain, because cognitive processes, affiliations, and performance in a network share more than in-house processes, competencies, and skills (Burny, 2012). Assessments based on the cognitive model can be developed, so that the test items directly evaluate the specific cognitive skills of the complexity of the individual, thus allowing student test performance to be linked with information about their strengths and weaknesses. First, four main domains were found by means of studying references and consulting with experts as well as the colleagues who had teaching experience for the main skills in the algebraic polynomials in the new secondary school. Figure 1. Shows an example of an adapted part of a cognitive model: 𝒙𝟒 𝒚𝟑 − 𝒙𝟑 𝒚𝟒 𝒙𝟓 𝒚𝟒 −𝒙 𝟒 𝒚𝟓. a). (x,y ≠ 0)is simplified as: A3 𝒙−𝒚 𝒙+𝒚 𝒙 𝟏 x.y b) ⁄𝒙. 𝒚 c) d) e) 𝒙+𝒚 𝒙− 𝒚 𝒚. A1: Math Operations. A2: Factor Features A1: Math Operations. - (8x-2y-5) +3(y-7x+9) =? A2 a)-y+15x-34 b)29x-5y-32 c)y-15x+14 d)5y-23x+32 e) -29x+5y+32. If (x+1) (m-1) =0 and m≠1, x=? a)2 b)-1 c)0 d)1 e)-2. A3: Factorizati on A2: Factor Features. A1: Math Operations. A1. Fig 1: Examples of test items for the hierarchical level of the cognitive model Figure1 show three sample items designed to evaluate three arranged skills in a linear cognitive model.As a defining skill, the A1 trait includes the most basic mathematical operational skills, such as addition, subtraction, multiplication, and division of numbers. In the A2 attribute, it is necessary for the individual to have basic mathematical skills (such as the A1 attribute) as well as knowledge of the properties of the agents. In the A3 trait, the subject. Journal for Educators, Teachers and Trainers JETT, Vol. 10 (1); ISSN: 1989-9572. 207.
(7) needs not only basic mathematical skills (such as the A1 attribute) and factorization knowledge (such as the A2 attribute), but also skills or factoring. Attributes are marked on a small scale; each attribute is measurable, and each attribute and related item are considered to be structurally related and meaningful, and traits from simple to more complex as we move from A1 to A3 We are sorted. Other hierarchical structures can also be used to process cognitive model information. Cognitive Diagnostic Assessment (CDA) has the potential to improve the attribute of the test score implications, and thus increase the educational relevance of the evaluation, since the performance of the test can directly relate to the weaknesses and strengths of the problemsolving test. But the successful implementation of the CDA also requires new methods and techniques for developing the test, which is necessary to lead to the subject's response data to the item, which is faced with four descriptive characteristics of the cognitive model. Step 1: Presenting the cognitive model and constructing the item: In the first step, the expected response pattern patterns for the hierarchy of attributes are calculated. Only a brief summary of the algebraic requirements required to create the expected final response matrix is presented The full training of this stage, with examples, is presented in (Gierl, Leiton & Honka, 2000). The relationships between traits in the hierarchy are defined using the proximity matrix and accessibility. The direct relation between the attributes is determined by a binary adjacency manifold (A) rank (k, k), k is the number of traits. The direct and indirect relationships between the attributes are determined by a binary accessibility matrix (R) rank (k, k), k is the number of traits. In order to obtain the matrix R from the matrix A in addition to the Boolean, the multiplication function was carried out in the proximity matrix, which means that R =(𝐴 + 𝐼)𝑛 , where n is the integer required to achieve the invariance. n = 1, 2 ... m, and I is the matrix of the same. In the next step, the Bank created a diagnostic test item. This bank is described by a randomized (Q) rank matrix (k, p); k is the number of attributes and p of possible diagnostic items. The Q matrix is reduced by decreasing randomized matrices (Qr) by imposing the hierarchy of traits, as defined in the matrix R. The Qr matrix is constructed using a Boolean inclusion with the property that the columns of the matrix (R) are logically contained in each column of the Q matrix. Matrix Qr is the rank (k, i), k is the number of traits, and i is the number of declined diagnostic items due to constraints in the trait hierarchy. Given the hierarchy of attributes, as described in the Qr matrix, the expected response patterns of the subject can then be created. The expected response matrix (E) was created using Boolean inclusion, which is compared with the matrix columns Qr of each row of the attribute pattern matrix, which is the prediction of the Qr matrix. The expected answer matrix is rank (j, i), which is the number of subjects and the number of items dropped from the restrictions imposed by the attribute hierarchy. The A1 is the first cognitive skill that is required. A linear hierarchy also shows that A1 is a prerequisite for A2, and A1 and A2 are prerequisites for A3, etc. By implication, a subject is not expected to have A2 unless he dominates A1. This relationship, which has been identified in a cognitive model and operational with a linear hierarchy, was then implemented through a test design where the items were created to evaluate their attributes and their dependencies. Functionality: At the beginning of the development of references and contextualization, as well as an opinion poll among the most experienced colleagues in the field of teaching the key skills in the field of study were found in the new phase of the four main areas of interest. First area: recognition and recognition: the recognition of polynomials and basic concepts in algebraic algorithms, such as the field of the correct field, the placement of variables and etc. Second area: Means the use of subtraction and multiplication Algebraic algebras as a basis for the issues related to the third hypothesis phrases: the factorization and diffusion of simplicity to. Journal for Educators, Teachers and Trainers JETT, Vol. 10 (1); ISSN: 1989-9572. 208.
(8) find the missing values or use in rational expressions. Applications: the use of unity, operators, parsing in the solution of the equation, or issues requiring the use of algebraic phrases has started with regard to the overlapping of the material in the different fields of interest and after the various screenings of the initial design of the questions. In this design, according to the main formula in the AHM matrix method, there should be 11 elements as 11clauses or questions (Table1). Difficulty: one of the activities that follow its performance. The test can be done to analyze questions. Calculate the difficulty factor of each question. In defining the difficulty factor, the percentage of the total number of test subjects who answer the correct answer is the difficulty of the question. In other words, calculating the difficulty rate of each question can be deduced from how many volunteers have been able to answer it correctly. If all the candidates answer the question correctly, that question is easy and if none of the bidders respond, that is a difficult question. To be sure, identifying the order of the traits needed to solve the test questions can be challenged because cognitive theories of performance are not always easy to align with diagnostic and evaluation objectives. However, identifying the hierarchy of attributes of the test function performs the essential function: the hierarchy is a hypothesis of cognitive performance in the field of interest, and if it does not successfully classify testers, it leads to distortion. In other words, the identification of the hierarchy of variable traits is an important input for AHM, because it is used to predict student performance categories and to test the cognitive capabilities of the testator. Several studies have been conducted to identify the different types of traits necessary for doing homework and test items. Tatsuoka & Boodoo (2000) have done a lot of work in this regard. For example, item checking and protocol analysis can be used to study homework requirements. The item's review is often done by experts (for example: test developers), who are familiar with the content domain, the test development process, and student problem-solving methods to identify the knowledge and capabilities needed to solve the test items. »Testers can be asked to use long thinking to solve problems, and protocol analysis can be used to study their problem-solving strategies. Protocol analysis is an effective method for identifying specific knowledge components and mental processes extracted by test items, and experts use these techniques to measure and test the problem-solving of quizzes. In the application of AHM, the hierarchy of attributes necessary for proper operation in a domain should be identified before the development of the test of that domain. This sequence of events is necessary for the use of AHM, because the Hierarchy of Attributes must be the guiding tool for the development of test items. By using the attribute hierarchy to develop test items, the reviewer gains maximum control over the attributes of each item criterion. When the test items are derived from the hierarchy, a unique proximity matrix can be identified for the built-in items. In a nutshell, when the test items are not developed hierarchically, so the hierarchy of items is diverted (for example, the Q matrix is reduced), then identifying a unique proximity matrix for items is difficult. 3. Results Data analysis is important for answering research questions. Nowadays, in most researches that rely on collected information from the subject under study, information analysis is one of the most important and main parts of the research. Raw data is analyzed using statistical techniques and is presented to the users after processing in the form of information. Accordingly, in this chapter, the descriptive analyses are performed and the diagrams are plotted in the first section. The difficulty coefficients of the questions are presented in Table2. The analysis of the difficulty coefficients showed that Question 3 with P=0.787 coefficient was the simplest question and. Journal for Educators, Teachers and Trainers JETT, Vol. 10 (1); ISSN: 1989-9572. 209.
(9) Question7 with difficulty coefficient of P=0.21 was the most difficult question. The mean difficulty coefficient indicated that the test difficulty coefficient and SD were 0521 and 0.032, respectively. Table 2. Descriptive indices of test questions Question. Classic difficulty coefficient. SD. q1. 0.593. 0.4920. q2. 0.257. 0.4375. q3. 0.787. 0.4103. q4. 0.713. 0.4530. q5. 0.430. 0.4959. q6. 0.603. 0.4900. q7. 0.210. 0.4080. q8. 0.650. 0.4778. q9. 0.483. 0.5006. q10. 0.467. 0.4997. q11. 0.537. 0.4995. The mean difficulty coefficient indicates that the test difficulty is average. The SD of the questions is within the range of 0.408 and 0.50. The mean and variance of the total test score are 5.7312 and 5.78, respectively. The Cronbach's alpha coefficient was 0.71. The analysis of the total questions in the table shows that all question correlation was more than 0.1, which was in the desired range. The correlation between the modified total question and the Cronbach's alpha in the case of removing the question showed that the removal of any questions did not increase the internal consistency of the test. 3.1. Cognitive diagnostic model with attribute hierarchy structure In order to choose the cognitive diagnostic model, two non-compensatory models of RRUM and DINA were analyzed. The lower values of the AIC and BIC indices meant the proper fitting of the model with the data. The RMSEA was also used for questions. Table 3: Model’s fitting indices with data Model RMSEA 0.048 0.018. BIC 4037.480 4027.626. AIC 3900.44 3935.03. Model RRUM DINA. The RMSEA<0.1 values represent proper fit of the model. The AIC value is less in the RRUM model. The RMSEA and BIC indices were less in the DINA model. The DINA model was selected for this research because the RMSEA index showed that the DINA model had a better fit with each of the questions and according to previous research that employed a hierarchical structure for mathematical data with the DINA model, and the DINA mode requires less parameter than RRUM.. Journal for Educators, Teachers and Trainers JETT, Vol. 10 (1); ISSN: 1989-9572. 210.
(10) 3.2. The validity of the Q matrix The Dela Torre method (2008) was used to evaluate the validity of the Q matrix. In this method, a discrimination coefficient is used to identify the elements of the Q matrix that need to be modified. The results of this method showed that the change in any of the proposed Q matrix elements does not lead to a significant improvement in the discrimination coefficient. Therefore, it can be claimed that the proposed matrix had the necessary validity. Table 4. Conjecture and slippage parameters of the questions Question q1 q2 q3 q4 q5 q6 q7 q8 q9 q10 q11. Conjecture. Slippage. 0.265 0.107 0.649 0.660 0.346 0.527 0.144 0.554 0.326 0.270 0.292. 0.018 0.567 0.051 0.187 0.413 0.254 0.665 0.168 0.220 0.161 0.001. Table 4 shows the conjecture and slippage parameters of the DINA model. The conjecture parameter specifies the probability of answering the question correctly for subjects who do not possess the required skills to answer the question. The lowest value of the conjecture parameter was g=0.107 the highest value for the conjecture parameter was g=0.66 for question 4. The conjecture parameters of questions 4, 3, 6, and 8 were greater than 0.5, which is a larger value. The conjecture parameters of other questions were average or low. The slippage parameter indicates the probability of an incorrect answer to the question for subjects who have mastered all the skills needed to answer the question. The maximum slippage parameter was s=0.001 for question 11. The slippage parameters of questions 2 and 7 were larger than 0.5 and that of the question 5 is 0.41. These values represent a high probability of slippage for subjects who have mastered the skills needed to answer each question. The slippage parameters of other questions were small and acceptable.. Fig 2. The probability of correct answer to questions. Guessing probability. Journal for Educators, Teachers and Trainers JETT, Vol. 10 (1); ISSN: 1989-9572. 211.
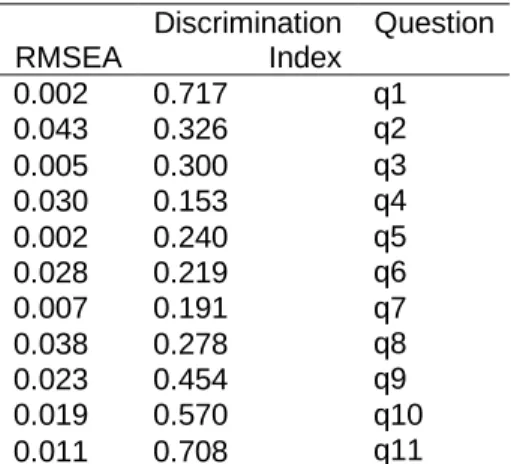
(11) Figure2 shows the probability of correct answer to any of the 11 test questions in conjecture mode in the absence of slippage. Question 2 had the lowest probability of the correct answer through conjecture; the probability of correct non-slippage response is also low and slightly more than 0.4. Question 7 has the lowest probability of the correct answer for the absence of slippage, which is about 0.34. The probability of correct answer without slippage for questions 1, 3, and 11 was greater than 0.90. Table 5 shows the item diagnostic index (IDI) and fit index (RMSEA) of questions based on the DINA model. The IDI had an inverse relationship with the conjecture and slippage indices. As these two indices lower, the IDI increases. The largest IDI of 0.711 was related to Q.1 and the smallest IDI of 0.153 was related to Q.4. The RMSEA index shows the fit of each question with the cognitive model. RMSEA<0.05 values represent the excellent fit of the question with the cognitive model. Table 5. Discrimination parameters and RMSEA index. RMSEA 0.002 0.043 0.005 0.030 0.002 0.028 0.007 0.038 0.023 0.019 0.011. Discrimination Index 0.717 0.326 0.300 0.153 0.240 0.219 0.191 0.278 0.454 0.570 0.708. Question q1 q2 q3 q4 q5 q6 q7 q8 q9 q10 q11. The largest observed RMSEA was 0.043 for Q.2. The lowest RMSEA indices were for Q. 1 and 5, which is 0.002. The RMSEA value for questions reflected the fitting of questions with the DINA cognitive model. The response pattern’s direction is from left to right so that the response of each person to question 1 was the first number on the left and the last number on the right, which indicates the answer to question 11. The HCI was within the range of -1 to 1. The amounts close to 1 is the sign of consistency of a person's response pattern with a given hierarchy, and values close to -1 indicate a lack of consistency of a person's response pattern with a given hierarchy. The mean HCI can also be used to determine the hierarchical fit with the data. The values greater than 0.7, are considered as desirable fit. In the sample, the mean HCI=0.02 was obtained. The HCI is not efficient in samples that most people are not mastered on measured skills. The FHCI is not affected by the distribution of skill classes. In addition to correct answers, this index considers incorrect answers. The values greater than zero for this index, is indicative of the consistency of the individual response to the hierarchy. The observed FHCI for the 187 subjects (62%) was greater than zero. The mean of FHCI was 13. The dispersion graphs of the HCI and FHCI are shown in Figures 3 and 4.. Journal for Educators, Teachers and Trainers JETT, Vol. 10 (1); ISSN: 1989-9572. 212.
(12) Fig 3. HCI values of the subjects. Fig 4. FHCI values of the subjects. Polychoric correlation results showed (Table6) that the measured skills had high correlation with each other. Correlation among factorization, distributivity, cognition, and diagnosis was 0.93, which was a great correlation. Skills related to simplification had a full correlation with cognition, diagnosis and factorization, which showed that this simplification skill did not exist independent of the other two skills. Table 6. Tetrachoric correlation matrix between skills Skills 1. Cognition and diagnosis 2. Simplification 3. Factorization and distributivity. 1 1 0.99 0.93. 2. 3. 1 0.99. 1. Table 7 indicates the mastery probability of the three skills. The cognition and diagnosis skill has the highest probability (P=0.46). This figure indicates that 46% of subjects mastered the ability to recognize and diagnose polynomials. Table 7. The probability of mastering the three skills measured by the test Skills Cognition diagnosis. Sub skills and. Simplification. Factorization and distributivity. The use of the principle of integral domain in hypothesis and judgment and using factorization and placement Placement of numerical values in an algebraic expression Simplifying using distributivity and addition and subtraction of monomials Simplifying with correlation Multiplying the monomials and identifying similar monomials Using polynomials in other problems Factorization in polynomials Factorization in rational expression Polynomials’ distributivity The use of algebraic identities. Journal for Educators, Teachers and Trainers JETT, Vol. 10 (1); ISSN: 1989-9572. Mastering probability 0.46. 0.35. 0.35. 213.
(13) Fig 5. Skill mastery probability The probability of mastering the skill of simplifying the expression and the application of polynomials and the factorization and distributivity skills in algebraic expressions was 0.35. Therefore, 35% of the subjects mastered these two skills. Table 8. The probability of observing different skill patterns in the sample Pattern Lack of mastery of the three skills Mastering cognition and diagnosis Mastering cognition, diagnosis simplification Mastering all three skills. and. Code 000 100 110. Mastering probability 0.54 0.11 0.002. 111. 0.35. As shown in the table8 and Figure5, 54% of the sample members did not master any of the three skills. This skill pattern was the most common pattern among subjects. Only 11% of the samples mastered the cognition and diagnosis skills.. Fig 6. The probability of observing different skill patterns in the sample A few percent of the sample mastered two skills of cognition, diagnosis and simplification. 35% of the sample mastered all three skills (Fig 6).. Journal for Educators, Teachers and Trainers JETT, Vol. 10 (1); ISSN: 1989-9572. 214.
(14) Table 9. Reliability of estimating attributes for subjects Pattern Class Cognition and diagnosis Simplification Factorization and distributivity. Pa 0.88 0.89 0.89 0.94. Pc 0.80 0.81 0.91. The Pa Index indicates the probability (Table 9) that a subject is correctly classified in its actual class. The value of 0.88 indicated that 88% of subjects were correctly classified in the actual class. The probability of correct classification for the recognition and detection skill was 0.89, simplification 0.89 and 0.94 for factorization and distributivity. The Pc index was calculated for each skill alone. The value of this index reflected the probability of the same classification of a subject in two different implementations. The probability of the same subject classification in two implementations for the recognition and detection skill was 80%, simplification 81% and 91% for factorization and distributivity.. 4. Conclusion The linear pattern derived from the Q matrix indicated that the domain 1 was the prerequisite of domain 2 and domain 2 was the prerequisite of domain3. Domain 1 described the recognition and detection skill of polynomials and general algebraic expressions that contained the other domains. Therefore, focusing on the precise description of the basic concepts of the recognition of polynomials, such as the order and number of polynomials and similar monomials, is of great importance and the basis for the correct learning of algebra. This content has been well documented in the recently issued books since the seventh grade. However, in the second domain, which focused on simplification and related concepts, less emphasis was made on the seventh to ninth grades. The defect in the expression and practice of this field led to the weakness in solving and analyzing relevant mathematical problems. The third domain was related to the second domain and directly to the first domain. Factorization and distributivity properties were often used without considering the rules of simplification by students. The weakness associated with the second domain caused the students not to be able to easily analyze and solve the problem in difficult polynomials that clearly the rules did not apply easily. According to the results of the table 8 in the field of recognition and identification of the probability of mastery of high school students, the reason for this can be the replication of the use of factorization and the principle of the field of correctness and the placement of numerical values in verbal and algebraic issues in the first and second element of the disciplines that students are familiar with such issues and there are many examples of this in books. But in two areas of simplification of algebraic expressions, the use of the concepts of simplification and factorization, and the terms of algebraic terms, was much lower than that of students. The lack of verbal issues and less exercises in this area weakened these areas. Regarding the importance of this issue in the next issues, as well as its application to the following topics in the field of jurisprudence and other related subjects, it is urgently needed to reinforce this part of the work.. 5. References Alves, C. (2011). Making Diagnostic Inferences about Student Performance on the Alberta Education Diagnostic Mathematics Project: An Application of the Attribute Hierarchy Method (Doctoral dissertation). Retrieved from Pro Quest Dissertations & Theses database. (Order No. NR81451). Burny, E. (2012). Time-related Competences in Primary Education (Unpublished doctoral dissertation) Ghent University, Belgium. Retrieved from https://biblio.ugent.be/ publication /4337147/file/7023842.pdf. Journal for Educators, Teachers and Trainers JETT, Vol. 10 (1); ISSN: 1989-9572. 215.
(15) Dela Torre, M. (2008). A Study of small open economy with non-tradable goods, North Western University. Embretson, S. E. (1995). A measurement model for linking individual learning to processes and knowledge: Application to mathematical reasoning. Journal of Educational Measurement, 32(93), 179-197. Gierl, M.J., Cui, Y., and Hunka, S. (2007). Using Connectionist Models to Evaluate Examinees’ Response Patterns on Tests, paper presented at the annual meeting of the National Council on Measurement in Education, Chicago IL. Gierl, M.J., Wang, C. & Zhou, J. (2008). Using the Attribute Hierarchy Method to Make Diagnostic Inferences about Examinees’ Cognitive Skills in Algebra on the SAT©. Journal of Technology, Learning, and Assessment, 6(6). Retrieved [date] from http://www.jtla.org. Gierl, M. J., Leighton, J. P., & Hunka, S. (2000). Exploring the logic of Tatsuoka’s rule-space model for test development and analysis. Educational Measurement: Issues and Practice, I9, 3 & 44. Gierl, M. J., Alves, C., & Taylor-Majeau, R. (2010). Using the Attribute Hierarchy Method to make diagnostic inferences about examinees’ knowledge and skills in mathematics: An operational implementation of cognitive diagnostic assessment. International Journal of Testing, 10, 318-341. Lim, C. S., Sia, C. J. L., Chew, C. M., Kor, L. K., Tan, P. L. (2017). Revealing primary mathematics pupils’ cognitive models in learning of “Time”. Penang, Malaysia: Universiti Sains Malaysia. ISBN 978-967-2075-01-1 Leighton, J. P., & Gierl, M. J. (Eds.). (2007a). Cognitive diagnostic assessment for education:Theory and applications. Cambridge, UK: Cambridge University Press. Leighton, J. P., & Gierl, M. J. (2007b). Defining and evaluating models of cognition used in educational measurement to make inferences about examinees’ thinking processes. Educational Measurement: Issues and Practice, 26, 3-16. Leighton, J. P., & Sternberg, R. J. (2003). Reasoning and problem solving. In A. F. Healy & R. W. Proctor (Eds.), Experimental Psychology (pp. 623448). Volume 4 in I. B. Weiner (Editor-in-Chief) Handbook of psychology. New York: Wiley. Sullivan, P., Clarke, D. J., Clarke, D., M., Farrell, Lesley, & Gerrard, J. (2013). Processes and priorities in planning mathematics teaching. Mathematics Education Research Journal, 25(4), 457-480. Tatsuoka, K. K., & Boodoo, G. (2000). Subgroup differences on the GRE quantitative test based on the underlying cognitive processes and knowledge. In D. Lesh & W. E. Kelly (Eds.), Research design and methodologies for mathematics and science. Hillsdale, NJ:Erlbaum.. Journal for Educators, Teachers and Trainers JETT, Vol. 10 (1); ISSN: 1989-9572. 216.
(16)
Figure


+2

Documento similar