TítuloPredicting vertical urban growth using genetic evolutionary algorithms in Tokyo’s minato ward
16
0
0
Texto completo
(2) Introduction Since the beginning of the twentieth century, many large urban centers have grown not only in size, extent, and population, but also vertically. However, it is not always easy to predict where and when vertical growth will occur. Thus the motivation for this research is to develop tools to simulate scenarios of future vertical growth in order to aid planners, urban designers, and policy makers. This study proposes a genetic algorithm that simulates the vertical urban growth of Minato Ward based on previous growth patterns to make predictions from pre-established inputted parameters. Because genetic algorithms have been used in the past for predicting the evolution of self-organized systems, it seems plausible that evolutionary computation could also be applied to examine the growth of cities. After a brief introduction to the development of genetic algorithms, this article explains the parameters that are used in the case study, proposes and tests an evolutionary computer model, and, finally, based on the results, offers some conclusions on the potential for evolutionary computation to predict vertical urban growth.. Methodology This article develops a computer model that can simultaneously determine the most likely location, height and number of new skyscrapers. For inputs, it uses various criteria related to urban regulations, a survey of current buildings, and economic indicators in the case study area to simulate future growth patterns. The proposed model is divided into two parts: the first is a parametric process which determines a probabilistic map for the allocation of new buildings; secondly, a genetic algorithm based on economic data determines the estimated number of buildings built per year as well as their average height. The methodology follows these steps: An area of study is defined within a large urban metropolis and the building types to be studied are determined. Existing parameters that influence the allocation of vertical growth are analyzed and mapped to later determine the location of possible new buildings. A genetic algorithm to predict scenarios of vertical growth is proposed. Economic parameters from the area of study are used as input data for a genetic algorithm to determine both the number and average height of new skyscrapers. A probabilistic allocation map is generated. The genetic algorithm is tested for the vertical growth of the study area for a 4-year period. The results obtained by the genetic algorithm and the probabilistic map are contrasted with the current observed vertical growth in the area of study.. Precedents In the 1960s, Holland began to study the logical processes involved in adaptation, inspired by the studies of cellular automata (CA) by Burks (1960) and neural networks by Selfridge (1958). Holland (1975, 1998) explored the way simple rules could lead to complex behavior. Using the logic of Darwinian evolution, he built what he initially called a reproductive genetic plan, known today as a genetic algorithm. The concept was further developed by Koza (1989, 1992), who introduced the idea of genetic programming and achieved excellent results in solving problems for which traditional techniques did not work. The evolutionary process consisted of randomly combining pools of genes, in this case codes, through which the most successful new solutions and behaviors would be passed on to the next generation. Johnson (2001) noted that Turing (1952) was the first to demonstrate, using mathematics, how a complex organism could assemble itself without any master planner..
(3) This article applies the same logic to an urban system to test whether the genetic algorithms might be successful in predicting the evolution of a city over time. Many authors have already proposed links between urban growth and biological growth, such as pioneering studies by Weaver (1958) in the natural sciences. Jacobs (1961), who applied Weaver’s notion of organized complexity, further theorized that although cities are a model of disorder, they somehow work successfully. Johnson (2001) claimed that the growth of large urban metropolitan areas resembled the growth of biological organisms. A similar analogy was made by Al-Sayed and Turner (2012), who described cities as complex organisms in constant evolution, their growth governed by both an evolutionary process and a self-organization process. Al-Sayed and Turner (2012) also noted how most of the computer models that simulate urban growth were developed based on mechanisms that characterize biological systems rather than spatial systems. The main precedent for the use of computer models to simulate urban growth is CA modeling. According to Leao et al. (2004), since the 1980s and the introduction of computation and selforganization, the traditional top-down approaches for the simulation of urban growth have shifted toward bottom-up approaches. Clarke et al. (1997) developed the first CA-based model, which was applied with satisfactory results in the simulation of urban growth for the San Francisco Bay area (Clarke and Gaydos 1998). Other CA models were developed by Wu (1998) to analyze forms of city growth for different development strategies, and by Li and Yeh (2000) for sustainable development of agricultural land. Li and Yeh (2002) combined neuronal networks and CA using geographical information system (GIS) to simulate the evolution of multiple land uses. Leao et al. (2004) further noted how urban growth has generally been the product of individuals making decisions within existing regulations even if these decisions did not necessarily follow the most optimal patterns. Because of this, CA models have also been used in combination with other techniques. White and Engelen (1997) included a stochastic factor in their CA models, whereas Clarke and Gaydos (1998) used probabilistic random processes. Rienow et al. (2014) used CA-based spatial modeling to simulate urban growth in combination with multiagent systems (MAS), which are well-suited to capture individual decision making. Other studies have used genetic algorithms to calibrate the CA modeling for urban simulation (Li et al. 2007) and landscape metrics (Li et al. 2013). Naghibi et al. (2016) combined CA with swarm intelligence–based algorithms. Because economic factors have always played a role in the selforganization of city growth, other lines of research proposed economic models. As an example, Krugman (1996), based on Schelling’s (1978) game theory model, explained how a simplified city made up only of businesses will organize itself into multiple equidistant, distinct clusters evenly spaced from each other. Beyond these examples, no other attempts to produce similar types of studies exclusively using genetic algorithms to simulate urban growth have been found. In addition, there are no previous studies that focused exclusively on the prediction of vertical growth. Because urban growth is the result of a collective and largely unplanned effort that does not necessarily follow the most logical, advantageous, or efficient patterns, the use of evolutionary computation seems to present an ideal and novel approach to simulate vertical growth. Case Study: Tokyo’s Minato Ward One of Tokyo’s most central administrative districts, Minato, was used as a case study. According to the Council of Tall Buildings and Urban Habitat (CTBUH), Tokyo is the third tallest city in the world based on both the number of buildings over 100 m and their accumulated height (CTBUH 2009). However, this is a recent phenomenon, because most of Tokyo’s high-rise buildings were built in the 21st century. As Pazos (2014) noted, 72% of all the buildings over 150 m were built after the year 2000. The process of building skyward began in the early 1990s and accelerated after the year 2000. The main reason for this high-rise boom was the easing of urban regulations, in particular the Urban Regeneration Act of 2000, which eased regulations concerning floor area ratio (FAR) in order to boost economic growth..
(4) To develop the genetic algorithm, it was necessary to first precisely define the area of study as well as the number of high-rise buildings. To this end, an administrative district was selected so that similar conditions could be evenly applied to the whole area. It was also important to define the sample size or population of objects to be studied. Because the research focuses on the morphology of the skyline, to run the algorithm only buildings over 130 m tall were included. Thus this article defined a skyscraper or highrise building as a building with an official height over 130 m. According to the CTBUH height criteria, there is no absolute definition of what constitutes a tall building, and different cutting marks are constantly used. What really defines a tall building is its height relative to its environment as well as the slenderness of the building. With this in mind, the model produced in this article focused on buildings that significantly stick out from their surroundings. Of the 124 buildings in Minato Ward over 100 m, only 51 of them surpass the 130-m mark, which is the threshold for a building to visually protrude into the skyline in this ward (Fig. 1). Minato was chosen because it contains 28.7% of the total buildings over 130 m in Tokyo, including the two tallest buildings, as well as the second tallest communications tower (Emporis Building Directory 2017). Ōdaiba, a small area on the eastern side of Minato Ward, was excluded from this study because it is an island in Tokyo Bay, disconnected from the main urban fabric, and contains no buildings surpassing 130 m in height.. Fig. 1. Minato Ward skyline renderings; data obtained from photogrammetric 3D model, postedited, and rendered (map data © 2017 Google, ZENRIN). For the purpose of geometrically analyzing the morphology, location, and number of buildings of the current skyline, a three-dimensional (3D) model of Minato Ward was developed from original photogrammetric data. The model contains the terrain level as well as buildings over 15 m, approximately four to five stories high, and accurately represents the Minato skyline in 2015 (Fig. 1)..
(5) To develop the genetic algorithms, economic data and parameters were taken from the existing urban fabric of MinatoWard. For this purpose, gradient probabilistic maps of the ward were developed from the 3D data. The gradient maps informed the probability of new high-rise developments occurring in a particular area.. Parameter Mapping A series of greyscale probabilistic maps showing different parameters were developed for use as the basis for the evolutionary model. The parameters were mapped in the following gradient maps: land ownership, regulatory master plans, vertical urban consolidation, accessibility, and allocation. Land Ownership: Public versus Private The land ownership diagram [Fig. 2(a)] shows publicly owned land in white and privately held land in black. The construction of private buildings is prohibited in public spaces such as streets, roads, parks, cemeteries, highways, train tracks, stations, and so on. The municipal government has direct control over publicly owned areas, which are designed and regulated as top-down systems from a central local authority (Johnson 2001). In contrast, privately owned land is developed based on individual decision making as a bottom-up process, although it must still adhere to building codes and urban regulations that set rules such as floor area ratios, building coverage ratios (BCR), and maximum permitted heights. Floor area ratio regulations are variable in Minato Ward, with standard maximum percentages up to 1,000% for residential and up to 1,300% for high-rise office developments, and, even then, exceptions can be granted in exchange for the integration of public parks or facilities. The usual limiting factor in developing a building over 130 m in height tends to be accumulating enough small land plots. Land reorganization processes are often necessary in order to put together land plots large enough to accommodate a high-rise building based on the current FAR and BCR regulations.. Fig. 2. Urban consolidation diagrams obtained from the 3D model; white areas show publicly owned land and consolidated master plans, and the gradient denotes vertical consolidation: (a) public (white) and private (black) space; (b) consolidated master plans (white) and lack of master plan (black); (c) vertical consolidation gradient map.
(6) Land Reorganization Master Plans The consolidated land diagram [Fig. 2(b)], which presents existing master plans already developed, shows areas that have already undergone master plans through urban redevelopment processes in white. As Kogut (2006) noted, the modern-day urban fabric of Tokyo is eerily similar to its origins in the Edo period (1603–1867), although the administrative boundaries changed numerous times before their current configuration was decided in 1947. Tokyo high-rises have grown over this pre-existing urban fabric, with no substantial changes made to the previous land structure, except for ownership changes and localized regulatory master plans, involving land property reorganization. Almazan and Tsukamoto (2009) defined these types of high-rise developments as corporate urban centers, which are an example of government policy reinforcing deregulation and privatization of urban developments. Meyer (2011) explained how this type of redevelopment strategy has become the norm in Minato Ward, because finding plots large enough to build a high-rise building is very difficult due to the small size of land plots. For these reasons, areas comprising clusters of low-rise buildings are likely to be reorganized into privately driven high-rise redevelopments, whereas areas that have been recently redeveloped are very unlikely to see new high-rise developments in the near future. Vertical Density The vertical consolidation diagram [Fig. 2(c)] shows Minato Ward’s vertical density in grayscale. The darker shades represent shorter buildings, which open the possibility for new high-rise urban developments. This is because Tokyo high-rise buildings are developed through the reorganization of small land plots, which puts pressure on less-dense areas to be developed into high-rises, as was explained in the previous paragraph. Accessibility The train station proximity diagram [Fig. 3(a)] shows greyscale circles with a radius of 500 m (walking distance of 5–10 min) centered on subway stations. When several train lines overlap in one station, the circles overlap as well, producing a darker tone, which indicates multiple access points to public transportation. In Tokyo, there is a strong correlation between the development of high-rise buildings and their proximity to public train transportation. Fig. 3(b) plots the footprint of buildings over 100 m in black over the station diagram, making clear this correlation of high-rise buildings and proximity to train stations. The public space and already regulated spaces in the previous diagrams are subtracted from the final accessibility diagram [Fig. 3(c)]. The darker areas in the diagram, which are in close proximity to public transportation, are more likely to experience further high-rise developments..
(7) Fig. 3. Accessibility grayscale diagrams of the subway stations with a radius of 500 m; darker tones reflect higher accessibility to trains and thus a higher probability of future high-rise developments: (a) train station gradient overlap within 500 m radius; (b) train stations and tall buildings; (c) train station accessibility gradient map. Allocation Parameters With these various inputs, a final gradient probabilistic map combining the land ownership, existing master plans, vertical consolidation and accessibility was developed (Fig. 4), to be later used as the basis for the computer model. This map was the result of the overlap of the vertical consolidation diagram and the accessibility diagram [Figs. 2(c) and 3(c)]. Darker areas reflect a high probability for future high-rise developments to occur due to less urban consolidation as well as proximity to public transportation. Lighter areas represent a lower probability of further vertical growth, and the white areas show where construction of vertical developments is prohibited or highly unlikely. The gradient plan was produced with simple parameters and was used as a probabilistic basis to determine areas with higher probability for new skyscraper construction.. Fig. 4. Allocation diagram produced by overlapping Figs. 2(c) and 3(c); darker áreas show higher probability of future high-rise developments.
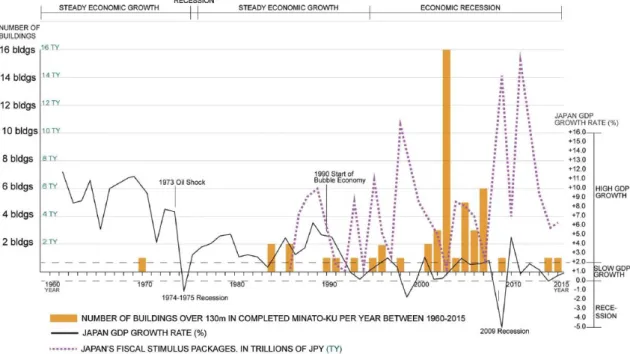
(8) Economic and Real Estate Parameters The evolutionary process incorporated economic and demographic data to predict the number of new high-rise developments annually. Understanding the overall economic context and its relation to the construction of high-rise buildings was an important factor. In 1991, Japan’s economy entered a recession which, as Daniell (2008) noted, was the result of a real estate bubble that was fed by easy access to loans using overvaluated properties as collateral. As Krugman (2008) explained, “Japan did not merely undergo a single year of catastrophic economic decline”; rather, the economy gradually slowed, with growth rates below 2% since 1992. Starting in the 1990s with the fall of land prices, some developers began acquiring significant numbers of small, adjacent land plots in order to undertake large building projects in a way that had not been viable before. Most of the high-rise construction in Minato Ward followed this pattern of development. As Pazos (2014) argued, high-rise developments in Tokyo tend to increase with low economic growth in part due to lower land prices, the introduction of economic stimulus, and lessrestrictive building regulations as the government attempts to boost productivity across the economy (Fig. 5). High-rise construction has been more of a tool to boost economic development than a result of economic growth itself. Since 1960, a total of 51 buildings over 130 m were completed in Minato Ward, with 31% of them completed during 2003 alone. The reason for this anomaly is that urban regulations regarding high-rise construction were eased in 2000 by the Urban Regeneration Act, and the typical highrise building takes an average of 3 years to build. Attempts by the government to improve the economy have led to an increase in high-rise construction, because each drastic fall of the economic growth rate results in more quantitative easing (Fig. 5). This economic pattern, and its relation to the number of buildings over 130 m completed per year, served as the basis for the evolutionary computation process in predicting of the number of future buildings per year.. Fig. 5. Number of buildings over 130 m built per year in Minato Ward from 1960 to 2015, combined with Japan’s gross domestic product (GDP) growth rates and economic stimulus packages.
(9) Genetic Evolutionary Vertical Growth Algorithm By combining the probabilistic gradient map (Fig. 4) with the historical economic data (Fig. 5), a computer model to predict the construction of high-rise buildings over 130 m in Tokyo’s Minato Ward was developed and tested. This study used the gradient plan (Fig. 4) as a basis to predict the most likely allocations for new high-rise buildings using a variety of determining factors: only areas where new developments are allowed; proximity to the public transportation network; the current location of high rise buildings; and variances in land prices, density, and population. The economic data, obtained from the World Bank (2016), cover the period from 1991 to 2015, when Tokyo experienced its high-rise boom. These data were then used to predict the number of buildings that would be built per year as well as the height of each building. The model was based on the assumption that the current conditions of vertical growth will remain constant and that there will be no major changes in the government’s urban policy. In order to complete this task, the economic data for the region were used to statistically determine the number of buildings that would be developed within that area from 2016 to 2019 as well as their respective building heights based on previous patterns of development and current urban regulations. The data parameters contained 184 economic indicators, such as population growth, fuel exports, foreign direct investment, deposit interest rates, and so on. The construction data from 1991 to 2015 were obtained from specialized websites Emporis Building Directory (2017) and CTBUH (2017). Once the economic data parameters were decided, a hybrid genetic algorithm was created (Mathias et al. 1994). The feature selection (Kudo and Sklansky 1998), feature transformation (Liu and Motoda 1998) and parameter selection (Hurvich and Tsai 1990) were done simultaneously to create an adjusted linear regression model using R-squared as a measure of performance in the evolutionary process. The genetic algorithm uses mathematic operators to refactor input variables in order to find a suitable solution. Fig. 6 shows all 12 available transformations in the evolutionary process used in this study). Any continuous mathematical function could have been used; however, this specific subset was selected based on previous experience.. Fig. 6. Twelve available sets of mathematical transformations used to determine the evolutionary process. The genotype of the individuals (high-rise buildings) is an array of the functions described previously. The genetic algorithm attempts to calculate the best possible combination of selections and transformations for all the input features. Fig. 7 presents the workflow of the hybrid genetic algorithm previously described. The best combinations of transformations in the input variables that maximize the previously determined objective function are determined through the evolutionary process. During the feature selection process, the possibility of determining the usability of a variable when assigning null selection is known (Fig. 7). For the best individuals of the population, the parameters with the best.
(10) adaptation are selected (parameter selector) to create the final regression model. The termination criteria of the evolutionary process are connected to the performance of the current individuals of a population in relation to the average individual of the population. When the average difference is lower than the preset threshold value for a homogeneous population, the iterative search process comes to an end. For cases in which the threshold value is not reached, a maximum number of iterations was used to finalize the process.. Fig. 7. Workflow diagram of the hybrid genetic algorithm; feature selection, feature transformation, and parameter selection were done simultaneously to maximize the objective correlation function (R-squared).
(11) For this particular case, the genetic algorithm attempted to maximize the R-squared regression value of the initial data (Table 1). It used a vector formed by the previously mentioned 184 indicators (variables) as training data, and it used the number of buildings built per year and their median height as objective data. Table 2 shows the capacity of the predictive model in relation to the determination coefficient R-squared and F-test analysis (Seber and Lee 2012) for both the number of buildings and the median height, respectively. All the results reported refer to the performance obtained in validation using 10-fold cross-validation and 50 independent runs. This probability was low enough to reject the null hypothesis using the common significance level of 0.05. Eqs. (1) and (2) in the Appendix show the selected/transformed variables during the evolutionary search of the best adapted individual. For these individuals, the optimal parameters were calculated according to the input data to extrapolate the generated model. Once both predictive models were determined, the gradient probabilistic plan was used (Fig. 4) for the generation of a stochastic roulette wheel based on stochastic universal sampling (Baker 1987). A total of 100 independent simulations were made according to the 2015 map by estimating the possible locations of buildings in Minato Ward over the 2016–2019 interval. The number of buildings and their heights were determined using both predictive models. A probabilistic map was then generated in which the darker tones represent higher likelihood of new buildings over 130 m to be developed (Fig. 8).. Table 1. Technical Specifications of the Algorithm Proposed Algorithm specifications. Operations and parameters. Operators. Add, subtract, sin, cos, tan, asin, acos, atan, log, exp, sqrt, and inverse Ramped half-and-half R-squared correlation One-point crossover Leave-flipping 0.05 0.90 Proportional roulette wheel Invert-fitness. Initialization Fitness function Recombination strategy Mutation strategy Mutation rate (pm) Crossover rate Selection strategy Replacement strategy. Table 2. Regression Analysis for both Models Indicating the Capacity of the Predictive Model for Both the Number of Buildings and the Median Height Regression analysis operations. Slope Y-intercept X-intercept 1/Slope Slope Y-intercept X-intercept R-squared Sy.x F DFn, DFd P value. Number of buildings Best-fit values 0.9900 ± 0.0229 0.0200 ± 0.0937 −0.0202 1.0100 95% confidence intervals 0.9419 to 1.0380 −0.1761 to 0.2161 −0.2240 to 0.1738 Goodness of fit 0.9899 0.3731 F-test significance 1,855 1.1900 <0.0001. Building median height. 0.9893 ± 0.0236 31.1800 ± 3.3660 −31.5200 1.0110 0.9399 to 0.1039 24.1400 to 38.2300 −40.2900 to −23.4600 0.9893 9.8170 1,755 1.1900 <0.0001. Note: DFd = degrees of freedom denominator; DFn = degrees of freedom numerator; F-Test = FisherSnedecor test..
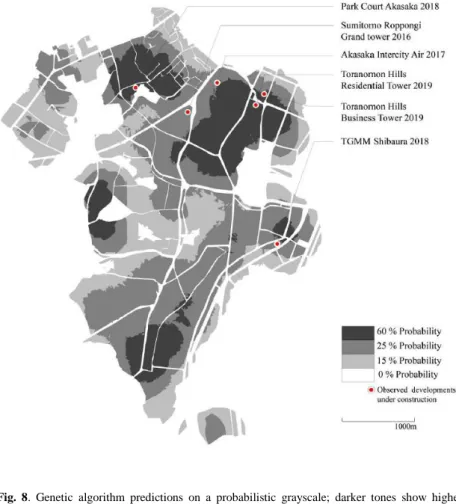
(12) Fig. 8. Genetic algorithm predictions on a probabilistic grayscale; darker tones show higher probability for new high-rise developments over 130 m to occur; dots represent high-rise buildings already planned to be completed during the 2016–2019 interval. Evaluation and Discussion Data regarding future high-rise construction and the data predictions obtained from the computer model for the 2016–2019 period were compared to evaluate the results (Table 3). The first column of the table shows the real estimated data for future high-rises (current construction), and the middle column shows the data predictions by the computer model. The differences between both sets of data are shown in the third column for evaluation purposes. According to the evolutionary model, a total of six new buildings over 130 m should be built over this period. The table also includes the median height of the buildings and shows that a total of six buildings over 130 m were under construction or were planned for construction in Minato Ward from 2016 to 2019. The current developments under construction and their expected dates of completion are Sumitomo Roppongi Grand Tower, 2016 (230 m); Akasaka Intercity Air, 2017 (205 m); Park Court Akasaka, 2018 (170 m); TGMM Shibaura, 2018 (169 m); Toranomon Hills Residential Tower, 2019 (219 m); and Toranomon Hills Business Tower, 2019 (185 m). There is the possibility that additional buildings over 130 m that have not been identified will be finalized before 2019. There is also a possibility that some of the buildings currently under construction and scheduled to be finished by 2019 could be delayed beyond the parameters of this case study. Therefore it will not be possible to verify with total accuracy the observed real data until the end of 2019, and thus these data should be used only as an estimate for pre-evaluating the results..
(13) Table 3. Observed Available Data for Future Construction in MinatoWard versus Predictions by the Algorithm for the Years 2016– 2019 Observed real developments. GA predicted developments. Difference (observed − predicted). Year. Number of buildings. Average height (m). Number of buildings. Average height (m). Number of buildings. Average height (m). 2016 2017 2018 2019 Total. 1 1 2 2 6. 230 205 169.5 202.5 196.5. 0 2 1 3 6. 0 203.7 220.9 278.8 244.1. +1 −1 +1 −1 0. −230 1.3 −51.4 −76.3 −47.6. The algorithm simulation predicted six buildings in Minato Ward for 2016–2019, which matches the six known developments either under construction or planned to be completed in the same period. Thus the algorithm was 100% accurate in predicting the total number of buildings compared with the observed current construction data over a 4-year period. This is despite the fact that the algorithm had an error of one building per year, which suggests that, even if the algorithm was accurate in predicting the overall number of buildings, it was not accurate in predicting the exact time of construction because it deviated by a few months. Construction delays or additional developments are still possible, which might further skew these numbers. The algorithm prediction was not accurate regarding the average building height, with an average error of 47.60 m, or 19.50%. This result was probably due to the fact that the maximum possible building height entered into the algorithm was 300 m. Even though buildings reaching 300 m in height are allowed to be built in Tokyo (for example, there are several buildings of 300 m which are planned to be completed in the 2020s), approval for such projects is only granted under special circumstances, and currently there are no buildings over 260 m completed in central Tokyo. Thus placing a height limitation of 260 m into the algorithm probably would have resulted in a smaller deviation. In order to test the algorithm’s accuracy in predicting building heights, further research is necessary. The six dots on the grayscale map (Fig. 8) show the exact location of the already planned and inprogress construction projects to be built by 2019. Four buildings appear in the darker areas which the algorithm predicted and only two buildings, the TGMM Shibaura and the Sumitomo Roppongi Grand Tower, fall into the medium area, with one of them allocated on the edge of an area of higher probability. The results are in concordance with the probabilistic plan generated by the algorithm, with 66.67% of the buildings allocated to the dark zone, versus a 60% result from the computer simulation, a 6.67% margin of error. One-third (33.33%) of the observed construction is allocated to the medium and light zones, versus a combined 40% (25 + 15%) by the computer model, again with a margin of error of 6.67%. Because of the small size of the population sample (six buildings), these deviations are considered acceptable.. Conclusions In the same manner as organisms (Johnson 2001), cities experience constant change and transformation through endless mutations in what constitutes the ultimate and most visible expression of civilization. The constantly changing skylines of large urban centers have come to define their identity. The morphological evolution of cities and biological growth are both driven by a self-organizing process. This case study tested an adaptive evolutionary model through the use of genetic algorithms to predict the likeness of future vertical growth in Tokyo’s MinatoWard. First, the areas with high potential for future high-rise developments based on previously identified recurring patterns of growth (regulations, vertical.
(14) density and accessibility) were identified over a gradient map. Then, using data from previous economic patterns and high-rise construction, the algorithm predicted the number of new buildings expected to be built per year and their respective heights to generate a probabilistic map of new buildings. The results obtained from the proposed approach were then compared with the real construction data of buildings over 130 m planned to be completed in Minato Ward by 2019. After testing the genetic algorithm predictions for the 2016–2019 period and comparing the results with the real projects underway, it can be concluded that the growth estimates by the algorithm were accurate regarding the total number of buildings (100%) and their likely locations (± 6.67%). However, the algorithm did not accurately predict the exact year of the developments (± 1 year) and the height of the buildings (19.50% deviation), suggesting that further studies should be done in those areas. Future case studies using this methodology should test a larger sample area, because this current study was partially limited by the small size of the population sample (six buildings). Nonetheless, it can be concluded evolutionary computation yielded acceptable results when used to predict future urban vertical growth. By simulating possible scenarios of vertical urban growth, urban planners, policy makers, and designers will be able to better assess future changes in cities and anticipate the necessary responses for implementing new infrastructure or regulations. By imputing different economic, legal, regulatory, and real estate parameters, planners will also be able to assess what will happen if those conditions change. Future developments for this type of methodology include the use of genetic algorithms to simulate the evolution of other urban variables to produce a broader understanding of how a complex self-organizing system, such as a city, will change over time. The algorithm used in this study is not limited to Tokyo, but could be adjusted for any urban environment with a high density of high-rise buildings. Thus this article concludes that it is possible to accurately simulate the evolution of complex self-organizing artificial systems, such as a city skyline, with the assistance of genetic algorithms.. Appendix. Equations Eq. (1) is the variable selection/transformation formula obtained in the evolutionary search for Minato Ward used to predict the number of probable new buildings #buildings =. tan(v0) + tan(v1) + sin(v2) + tan(v3) + asin(v4) + sin(v5) + tan(v7) + (v10) + tan(v11) + sin(v12) + asin(v13) + sin(v15) +asin(v17) + sin(v18) + tan(v20) + tan(v21) + asin(v22) + asin(v23) + sin(v25) + (v26) + sin(v28) + tan(v31) + asin(v32) +tan(v35) + asin(v36) + tan(v40) + sin(v43) + tan(v44) + asin(v45) + sin(v46) + asin(v47) + sin(v49) + tan(v51) + tan(v54) +tan(v55) + tan(v57) + tan(v58) + tan(v60) + sin(v61) + tan(v62) + tan(v64) + tan(v65) + tan(v66) + sin(v67) + tan(v71) +asin(v73) + tan(v74) + asin(v77) + sin(v78) + sin(v80) + sin(v81) + sin(v83) + tan(v87) + tan(v90) + sin(v91) + asin(v92) +tan(v93) + sin(v94) + sin(v96) + sin(v97) + sin(v99) + tan(v100) + sin(v102) + asin(v103). (1).
(15) Eq. (2) is the variable selection/transformation formula obtained in the evolutionary search for Minato Ward used to predict the average heights of probable new buildings avg(heights) =. sin(v1) + asin(v3) asin(v7) + asin(v9) + asin(v10) + sin(v13) + asin(v14) + tan(v15) + asin(v16) + tan(v17) + tan(v20) + tan(v22) + tan(v25) + asin(v28) + sin(v30) + tan(v31) + asin(v32) + sin(v33) + (v34) + asin(v35) + asin(v37) + asin(v38) + tan(v39) + asin(v40) + asin(v42) + sin(v43)+ + sin(v44) + asin(v49) + tan(v51) + tan(v52) + sin(v53) + tan(v54) + tan(v56) + sin(v57) + asin(v60) + tan(v61) + tan(v62) + sin(v64) + tan(v68) + tan(v69) + asin(v70) + tan(v71) + tan(v72) + asin(v73) + sin(v76) + tan(v77) + sin(v79) + tan(v80) + asin(v83) + sin(v84) + asin(v85) + sin(v86) + tan(v87) + tan(v89) + sin(v90) + asin(v91) + sin(v92) + asin(v94) + asin(v95) + tan(v96) + asin(v99) + asin(v100) + sin(v102) + asin(v105). References Almazan, J., and Tsukamoto, Y. (2009). “Tokyo public space networks at the intersection of the commercial and the domestic realms. Part III: Study on transit urban centers.” J. Asian Arch. Build. Eng., 8(2),461– 468. Al-Sayed, K., and Turner, A. (2012). “Multidisciplinary research on geographical information in Europe and beyond.” J. Gensel, D. Josselin, and D. Vandenbroucke, eds., Proc., AGILE’2012 Int. Conf. on Geographic Information Science, Avignon, France. Baker, J. (1987). “Reducing bias and inefficiency in the selection algorithm.” Proc., 2nd Int. Conf. on Genetic Algorithms and Their Application, L. Erlbaum Associates, Hillsdale, NJ, 14–21. Burks, A. W. (1960). “Computation, behavior and structure in fixed and growing automata.” Self-organizing systems, M. C. Yovits and S. Cameron, eds., Pergamon Press, New York, 282–309. Clarke, K. C., and Gaydos, L. (1998). “Loose-coupling a cellular automaton model and GIS: Long-term urban growth prediction for San Francisco and Washington/Baltimore.” Int. J. Geograph. Inf. Sci., 12(7), 699– 714. Clarke, K. C., Hoppen, S., and Gaydos, L. (1997). “A self-modifying cellular automaton model of historical urbanization in the San Francisco Bay area.” Environ. Plann. B, 24(2), 247–261. CTBUH (Council of Tall Buildings and Urban Habitat). (2009). Tall buildings in numbers: World’s tallest urban agglomerations, Chicago. CTBUH (Council of Tall Buildings and Urban Habitat). (2017). “The skyscraper center: Tokyo, Japan.” ⟨http://www.skyscrapercenter.com/city/tokyo⟩ (Jun. 10, 2017). Daniell, T. (2008). After the crash: Architecture in post-bubble Japan, Princeton Architectural Press, New York. Emporis Building Directory. (2017). “Emporis building map: Tokyo.” ⟨https://www.emporis.com/borough/100795/minato-ku-tokyo/1⟩ (Jun. 10, 2017). Engelen, G., White, R., and Uljee, I. (1997). “Integrating constrained cellular automata models, GIS and decision support tools for urban planning and policy-making.” Chapter 8, Decision support systems in urban planning, H. Timmermans, ed., E&FN Spon, London. Holland, J. H. (1975). Adaptation in natural and artificial systems: An introductory analysis with applications to biology, control, and artificial intelligence, University of Michigan Press, Ann Arbor, MI. Holland, J. H. (1998). Emergence: From chaos to order, Oxford University Press, Oxford, U.K. Hurvich, C. M., and Tsai, C. (1990). “The impact of model selection on inference in linear regression.” Am. Statistician, 44(3), 214–217. Jacobs, J. (1961). The death and life of the great American cities, Vintage, New York. Johnson, S. (2001). Emergence: The connected lives of ants, brains, cities and software, Touchstone, New York. Kogut, J. (2006). “A study of the transformation of street-blocks in Tokyo: A case study in Shinjuku.” J. Asian Arch. Build. Eng., 5(1), 61–66. Koza, J. R. (1989). “Hierarchical genetic algorithms operating on populations of computer programs.” Proc., 11th Int. Joint Conf. on Artificial Intelligence, Morgan Kaufmann, San Mateo, CA, 768–774. Koza, J. R. (1992). Genetic programming: On the programming of computers by means of natural selection, Vol. 1, MIT Press, Cambridge, MA.. (2).
(16) Krugman, P. (1996). The self-organized economy, Blackewell Publishers, Oxford, U.K. Krugman, P. (2008). The return of depression on economics and the crisis of 2008, W.W. Norton & Company, Inc., New York. Kudo, M., and Sklansky, J. (1998). “A comparative evaluation of mediumand large-scale feature selectors for pattern classifiers.” Kybernetika, 34(4), 429–434. Leao, S., Bishop, I., and Evans, D. (2004). “Simulating urban growth in a developing nation’s region using a cellular automata-based model.” J. Urban Plann. Dev., 10.1061/(ASCE)0733-9488(2004)130:3(145), 145–158. Li, X., Lin, J., Chen, Y., Liu, X., and Ai, B. (2013). “Calibrating cellular automata based on landscape metrics by using genetic algorithms.” Int. J. Geogr. Inf. Sci., 27(3), 594–613. Li, X., Yang, Q., and Liu, X. (2007). “Genetic algorithms for determining the parameters of cellular automata in urban simulation.” Sci. China Ser. D, 50(12), 1857–1866. Li, X., and Yeh, A. G. O. (2000). “Modelling sustainable urban development by integration of constrained cellular automata and GIS.” Int. J. Geog. Inf. Sci., 14(2), 131–152. Li, X., and Yeh, A. G. O. (2002). “Neural-network-based cellular automata for simulating multiple land use changes using GIS.” Int. J. Geog. Inf. Sci., 16(4), 323–343. Liu, H., and Motoda, H. (1998). “Feature transformation and subset selection.” IEEE Intell. Syst. Appl., 13(2), 26–28. Mathias, K., Whitley, L., Stock, C., and Kusuma, T. (1994). “Staged hybrid genetic search for seismic data imaging.” Proc., 1st IEEE Conf., IEEE World Congress on Computational Intelligence, Vol. 1, IEEE, Los Alamitos, CA, 356–361. Meyer, U. (2011). Tokyo architectural guide, Dom Publishers, Berlin. Naghibi, F., Delavar, M. R., and Pijanowski, B. (2016). “Urban growth modeling using cellular automata with multi-temporal remote sensing images calibrated by the artificial bee colony optimization algorithm.” Sensors (Basel), 16(12), 2122. Pazos, R. I. (2014). “The historical development of the Tokyo skyline: Timeline and morphology.” J. Asian Arch. Build. Eng., 13(3), 609–615. Rienow, A., Stenger, D., and Menz, G. (2014). “Sprawling cities and shrinking regions—Forecasting urban growth in the Ruhr for 2025 by coupling cells and agents.” Erdkunde, 68(2), 85–107. Schelling, T. (1978). Micromotives and macrobehaviour, W.W. Norton & Company, Inc., New York. Seber, G. A., and Lee, A. J. (2012). Linear regression analysis, Vol. 936, Wiley, New York. Selfridge, O. G. (1958). “Pandemonium: A paradigm for learning.” Proc., Symp. on Mechanization of Thought Processes, National Physical Laboratory, London, 511–529. Turing, A. M. (1952). “The chemical basis of morphogenesis.” Philos. Trans. R. Soc. B Biol. Sci., 237(641), 37–72. Weaver, V. (1958). A quarter-century in the natural sciences, Rockefeller Foundation, New York. White, R., and Engelen, G. (1997). “Cellular automata as the basis of integrated dynamic regional modeling.” Environ. Plan. B, 24(2), 235–246. World Bank. (2016). “The World Bank: Data: Japan.” ⟨http://data.worldbank.org/country/japan⟩ (Aug. 8, 2016). Wu, F. (1998). “Sim land: A prototype to simulate land conversion through the integrated GIS and CA with AHP-derived transition rules.” Int. J. Geograph. Inf. Sci., 12(1), 63–82..
(17)
Figure


+4


Documento similar
Supplementary Figure 4 | Maximum Likelihood Loliinae tree cladograms (combined plastome + nuclear 35S rDNA cistron) showing the relationships among the studied samples in each of
In this article, (i) we present a brief synopsis of the development of community radio in Colombia, after that (ii) we point out how community radio strengthen the peace
In any case, the work of (Bashashati et al. [3]) deeply explains the different methods and signal processing algorithms used in the different steps, such as pre-processing,
I already had the main idea of the video game: a zombie survival game in which the zombies would learn (I didn’t know how yet) to locate the player in order to attack him.. With
6 This study evidences that hematocrit, lipid peroxidation and NO levels in the first trimester of pregnancy are potential biomarkers to be included in predictive algorithms
More specifically, they had to assign a readability score for 3 different pairs of test cases: (1) interactive vs interactive, two tests whose readability differed significantly for
To create genetic graph-based clustering algorithms and heuristics to improve the robustness and solutions of classical partitional clustering algorithms, and to study its
The figure also shows the results obtained using a standard Newton-based optimization method, and with a GA method using a standard minimum-square objective function.. We can see that
