TítuloRapid assay for the analysis of class III metallothioneins by capillary zone electrophoresis in crude extracts of microalgal cells exposed to cadmium
13
0
0
Texto completo
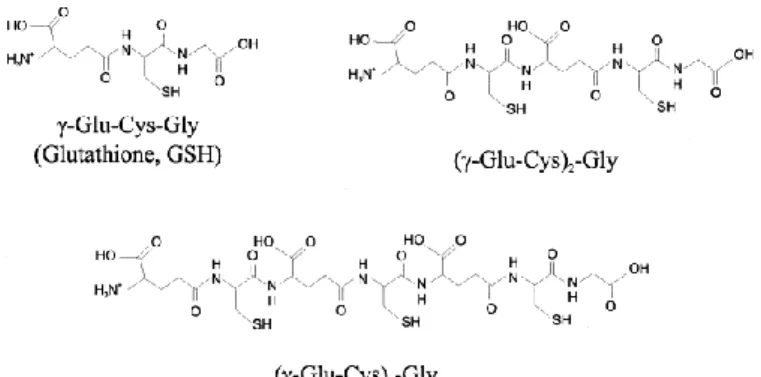
(2) temperature and 150 mM sodium phosphate buffer (pH 3.5). Based on this preliminary study, CZE with an uncoated fused-silica capillary using sodium phosphate buffer appears to be a useful technique for the separation of class III metallothioneins. Keywords Metallothioneins; Cadmium; Proteins. 1. INTRODUCTION Metallothioneins (MTs) are low-molecular-mass, cysteine-rich polypeptides that complex heavy metals in thiol clusters 1 and 2. It is believed that these peptides play a general role in the metabolism and the detoxification of a number of essential and nonessential trace metals [3]. MTs have attracted interest from researchers involved in a wide range of disciplines including bioinorganic chemistry, biochemistry, molecular biology, physiology, toxicology, environmental science and medicine. These molecules chelate toxic trace metals, such as cadmium, thereby involved in zinc and copper homeostasis. They are structurally diverse and three classes have been defined [4]. Classes I and II are proteins encoded by structural genes. In contrast, class III are secondary metabolites not directly encoded by structural genes. This class of MTs was identified in plants, algae and certain fungal organisms. These class III MTs are composed of the repeating dipeptide unit γ-glutamylcysteine with a single carboxy terminal glycine residue. The general structure for the set of these peptides is (γ-Glu–Cys)n–Gly, where n=2–11. They can be viewed as linear polymers of the γ-glutamylcysteine (γ-Glu–Cys) portion of glutathione (GSH), which is the precursor of these molecules. The structure of class III MTs can be abbreviated as (γEC)nG. Fig. 1shows the structure of glutathione and two class III MTs with two and three repetitions of (γ-Glu–Cys) units..
(3) Fig. 1. Structure of glutathione (GSH) and of two class III MTs with two and three repetitions of (γ-Glu–Cys) units.. Methods for the analysis of class III MTs involve chromatography on Sephadex G-75 or G-50, followed by anion-exchange chromatography on DEAE-based columns [5]. Tissues must be concentrated by partial or total lyophilization, ultrafiltration, dialysis against polyethylene glycol or precipitation with (NH4)2SO4, because of the requirement of small volumes of extracts for gel filtration. An alternative group of protocols relied on chromatography of the crude extract first on DEAE- or QAE-based anion exchangers, followed by gel filtration on Sephadex G-50, Sephadex G-75 or Bio-Gel P6 [6]. Individual peptide components can be analyzed by denaturation in dilute acid and chromatography on reversed-phase HPLC columns using acetonitrile–water gradients in 0.1% trifluoroacetic acid [7]. Derivatization of separated polypeptides with DTNB [55′-dithiobis-(2-nitrobenzoic acid), Ellman reagent] in a post-column reactor; or with monobromobimane is necessary to identify the thiol-containing compounds [8]. In recent years, capillary electrophoresis (CE) offers an alternative in the analysis of many molecules 9 and 10. Proteins and small organic molecules, including amino acids, small peptides, nucleotides, bases and water-soluble vitamins, can be separated by capillary zone electrophoresis (CZE) 11 and 12. CE has been used extensively for the separation of peptides of different characters [13]. Recent advances in CE of proteins, peptides and amino acids have been reviewed [11]. CE was demonstrated to be superior to HPLC in separation efficiency in many cases in peptide research and was also used in characterizing multiple antigenic peptides [14]..
(4) Recently, CE has been used for the separation of class I MTs in uncoated fused-silica capillaries and it has been applied to characterize class I MTs isoforms 15 and 16. This paper reports the successful separation of class III MTs in an untreated fused-silica capillary, and a simple method is proposed for the analysis of these molecules in crude extracts by CZE without prior steps of purification and derivatization.. 2. EXPERIMENTAL 2.1. Apparatus A Waters Quanta 4000 CE system equipped with a high-voltage power supply was used. Untreated fused-silica capillary (Composite Metal Services, UK), 37 cm (effective length 30 cm)×50 μm I.D., was used as a separation tube. Detection was performed by the on-column measurement of UV absorption at 214 nm with a zinc lamp and an appropriate optical filter. The window for the on-column detector cell was created by burning off a small section (0.2 mm) of the polyimide coating. Electropherograms were recorded and analyzed on a Vectra VL2 Hewlett–Packard personal computer with an appropriate ADC card and an interface using the CHEMSTATIONHPLC2D data processing software (Hewlett–Packard).. 2.2. CZE procedure Prior to the runs the capillary was rinsed with 1 M sodium hydroxide solution, distilled water, 1 M HCl and then conditioned for 3 min with the separation buffer. The running buffer was phosphoric acid 150 mM (pH 3.5±0.1), made by adjusting the pH with a sodium hydroxide solution. Between injections, the capillary was washed for 2 min consecutively with 0.1 M HCl and Milli-Q water to remove surface adhered material and retain separation reproducibility, and finally the capillary was filled with running buffer. The sample was introduced at the cathode by gravity at a height of 15 cm. The analysis was performed by applying a −12 kV voltage in a constant voltage mode and at room temperature (23±2°C)..
(5) 2.3. Chemicals and solutions All buffers were analytical grade or better and were obtained from Sigma (St. Louis, MO, USA). Water was purified by reverse osmosis followed by deionization (Milli-Q, Millipore, USA). All solutions were filtered prior to use through a 0.45-μm Millex-UV filter (Millipore) and running buffer was degassed under vacuum. The organism used to check this technique was the microalga Phaeodactylum tricornutum (Bohlin) (Bacillariophyceae). Crude extracts from microalgal cells non-exposed and exposed to cadmium were obtained harvesting the cells by centrifugation at 6000 g for 5 min and the pellet was resuspended in 75 mM sodium borate buffer (pH 8.6). The algal cells were disrupted by sonication in a Soniprep 150 MSE equipped with a microtip for 3 min at 14 microns while the sample was kept on ice. Unbroken cells and cellular debris were removed by centrifuging at 13 000 g for 15 min. The obtained extract was immediately analyzed by CZE. The standard MTs were obtained by purification from the same microalga exposed to 30 mg l−1 of cadmium for 15 days. The crude extract was obtained by the procedure indicated above. This extract was loaded onto a gel permeation column containing BioGel P-60 (Bio-Rad Laboratories). The MTs were eluted with 25 mM ammonium acetate buffer (pH 8.6). The fractions containing this molecules were pooled and lyophilized. The purified MTs were used as a test mixture after resuspended them in 75 mM sodium borate buffer (pH 8.6). The length of these purified peptides was obtained from their amino acid composition. The purified peptides were separated by semi-preparative reversed-phase HPLC. The amino acid composition of each separated peptide was determined. From this composition, the ratio of glutamic acid and cysteine to glycine was determined. Each identified peptide was analyzed by the CE technique..
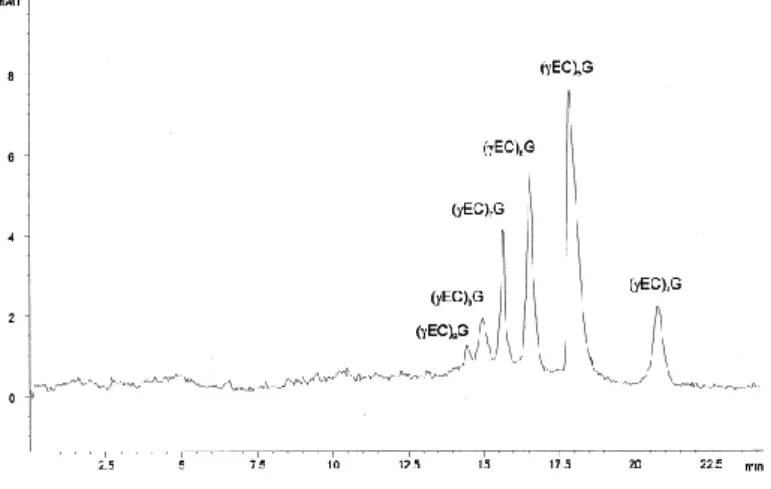
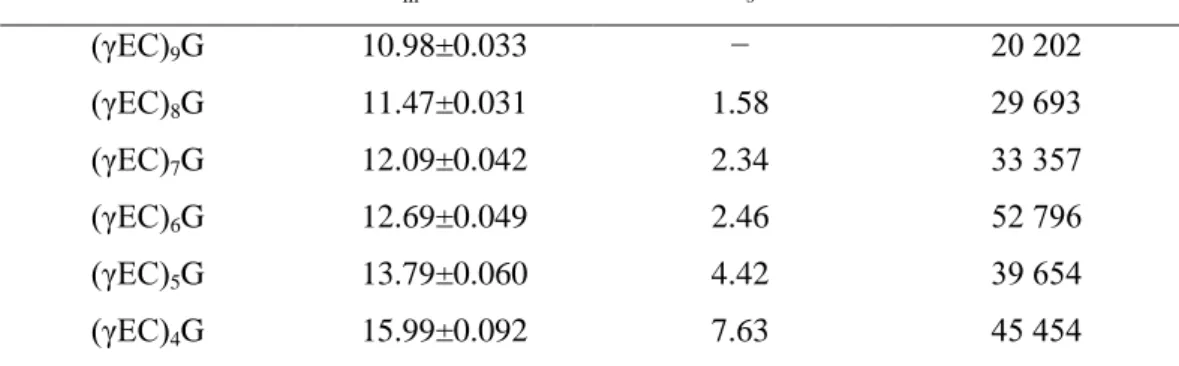
(6) 3. RESULTS AND DISCUSSION Fig. 2 shows the electropherogram of the test mixture of class III MTs containing 6 different polypeptides. The peptides were completely separated within 17 min with good efficiency; the theoretical plate number for peaks was always >20 000.. Fig. 2. Zone electrophoretic separation of six model class III MTs on a 37 cm×50 μm I.D. fused-silica capillary. Metallothioneins were obtained by purification from Phaeodactylum tricornutum cells exposed to 30 mg l−1cadmium for 15 days. Electrophoretic conditions: sample buffer, 75 mM sodium borate (pH 8.6); run buffer, 150 mM sodium phosphate (pH 3.5); separation voltage, −12 kV; detection, 214 nm.. The polypeptides differ in their chain lengths. The elution sequence of the peptides is (γEC)9G,(γEC)8G, (γEC)7G, (γEC)6G..... This order of elution is due to the higher size of the molecules ((γEC)9G>(γEC)8G>(γEC)7G...) because there is an increment of two amino acids (Glu+Cys) in the sequence of these peptides which leads to an increase in the negative charge, mainly due to the additional carboxyl group of the glutamic acid which has negative charge at the electrolyte pH (3.5±0.1). This increase in the negative charge causes a faster migration to the anode. The analytical characteristics of this CZE separation procedure, based on five different analysis are showed in Table 1. The plate numbers were the highest for (γEC)4G peak and in all cases was higher than 20 000. The six peptides were all separated with Rsvalues >1..
(7) Table 1. Migration time (tm), resolution (Rs) and theoretical plates (N) in the CZE analysis of class III MTs Metallothionein. tm±S.D.. Rs. N. (γEC)9G. 10.98±0.033. −. 20 202. (γEC)8G. 11.47±0.031. 1.58. 29 693. (γEC)7G. 12.09±0.042. 2.34. 33 357. (γEC)6G. 12.69±0.049. 2.46. 52 796. (γEC)5G. 13.79±0.060. 4.42. 39 654. (γEC)4G. 15.99±0.092. 7.63. 45 454. These peptides are very acidic and, because of this, it is possible that they elute to the detector under these electrophoretic conditions. At pH 3.5 these molecules have enough negative charge to migrate to the anode and overcome the electroosmotic flow to the cathode. The electroosmotic flow is 30 nl min−1 under these conditions. Because MTs have a negative charge at this pH a reversed polarity was used in the separation, but the electroosmotic flow is in the opposite direction; for this reason it is necessary reduce it. The complete suppression of the electroosmotic flow was avoided because with this flow, the non-charged molecules would migrate to the cathode and they do not interfere with the MTs. A high ionic strength buffer (150 mM sodium phosphate) was used to reduce the electroosmotic flow. Reduction of the electroosmotic flow by operating at low pH should yield more reproducible separations, since changes in silanols groups on the capillary wall result in a variation of the electroosmotic flow and hence, in the elution time of the molecules. But with concentrated buffers the Joule effect is increased. With the 50-μm capillary excessive Joule heat is avoided. The use of a short capillary (37 cm) enables analysis in a short time, even though the resolution can be low. But with the length used in this technique, MTs are well separated in a short time. With these conditions the voltage selected must be −12 kV because at this voltage the Joule heat was not very high. The current obtained was 70 μA. Better resolution is achieved at higher voltages, but excessive generation of heat is caused. With the Quanta 4000 System very high voltages cannot be used in these electrophoretic conditions because the cooling of the capillary is not very efficient..
(8) The sample injection in a buffer with a pH value of 8.6, higher than the run buffer, allows the stacking mechanism which enhances peak compression and yields an enhancement in sample concentration and, hence, sensitivity. Fig. 3 shows the electropherograms of crude extracts from P. tricornutum cells not exposed and exposed to 30 mg l−1 of cadmium for 15 days. The named peaks in Fig. 3b are the class III MTs induced by exposure to cadmium; these peaks do not appear in the chromatogram of crude extract from cells not exposed to cadmium (Fig. 3a) and have the same retention times as the purified MTs represented in Fig. 2, which were analyzed by the same electrophoretic technique.. Fig. 3. Chromatograms of crude extracts from P. tricornutum cells non-exposed (a) and exposed (b) to 30 mg l−1cadmium for 15 days. Conditions are as in Fig. 2..
(9) At a pH value of 3.5 the majority of zwitterions (proteins, peptides...) in the crude extracts have a net positive charge migrating to the opposite extreme of the detector. Molecules without charge also migrate to this extreme because the electroosmotic flow is in this direction. The negatively-charged peptides must have a sufficiently strong charge to overcome the electroosmotic flow to the cathode and migrate to the detector. Due to their properties class III MTs have enough negative charge to migrate to the detector under these conditions and they can be separated from other molecules which also migrate in this direction. In the chromatograms of Fig. 3 it can be observed that other molecules do not interfere with MTs, a few additional peaks are present in the chromatogram. In the crude extracts the concentration of the other molecules is very high because no previous purification step of MTs were made, but with these electrophoretic conditions most of molecules present in the extracts do not migrate to the detector. Class III MTs are molecules synthesized in the presence of heavy metals, in this way their level in the cells depends on the concentration of metal in the environment and on the duration of exposure. The increase of these parameters increases the level of MTs in the cells; this could facilitate their detection. Cells were exposed to 30 mg l−1 of cadmium for 15 days to have a concentration of MTs in the cells that facilitated study by this technique. The sample has a pH value of 8.6 and the change to pH 3.5 in the sample zone could affect the stability of proteins from the crude extracts. In the acid environment, proteins could precipitate and coat/block the capillary, but this effect was not observed. The pH value of 3.5 is probably not low enough to cause this effect. Besides, if any protein was precipitated, the electroosmotic flow to the cathode could drag it outside the capillary. The pH is the most important parameter in this technique; at a pH value of 5 or higher there is an increase in the negative charge of these peptides due to ionization of carboxyl and thiol groups and the migration is faster, but there is a lost in resolution (Fig. 4a), this may be due to the fact that MT complexes are not dissociated at pH values >3.5. At pH 3 the migration is slow, the resolution increases but the peaks are broad and the time of the analysis also increases (Fig. 4b)..
(10) Fig. 4. Electropherograms showing the effect of the electrolyte pH on the separation of class III MTs standard, (a) pH 3, (b) pH 5. The remaining conditions are similar to those in Fig. 2.. At pH 3.5 MT complexes are dissociated. When these molecules were analyzed using a very acidic electrolyte like 100 mM phosphoric acid and positive voltage ( Fig. 5) the same pattern of six peaks was observed, but the position of the peaks was reversed, since at this low pH the charge of MTs are positive. Under very acidic conditions MTs are assumed to be dissociated; since the pattern at pH 3.5 is the same as that obtaining in very acidic conditions, it can be concluded that the peaks observed in the chromatogram at pH 3.5 correspond to the metal-free MT polypeptides..
(11) Fig. 5. Electropherogram of MT standard using a low pH electrolyte. Conditions: run buffer 100 mM phosphoric acid; voltage, +10 kV. The remaining conditions are as in Fig. 2.. It is therefore possible to analyze class III MTs using a very acidic electrolyte and the polypeptides are well separated (Fig. 5), but if the objective is to analyze MTs in crude extracts, proteins may precipitate inside the capillary at this low pH. At a pH value of 3.5 and with the other conditions used this does not happen and MTs are also well separated. MTs can be analyzed in crude extracts with these conditions. This CE technique shows a good separation even when a complex biological sample is injected, because the MTs are separated from other molecules when the crude extract is analyzed. The main advantage of this simple technique is due to the capability to analyze crude extracts without any previous step of purification or derivatization. Other separation techniques like HPLC have serious problems when complex samples are analyzed. The traditional technique to analyze these molecules has been reversed-phase HPLC. The polypeptides forming the metal-binding complexes have been resolved by reversedphase HPLC on C18 columns. The solvents used contain either 0.05% phosphoric acid or 0.1% trifluoroacetic acid 7, 17 and 18. In these solvents the metal-binding complexes are dissociated, yielding metal, sulfide and the MTs. The purified MTs can be injected onto the C18 column and the separated polypeptides detected by means of the absorbance of the peptide bond at 214–220 nm. But when crude extracts are injected, in order to identify the MTs, the separated polypeptides must.
(12) be derivatized with DTNB in a post-column reactor to determine the presence of the thiol groups. Other analytical techniques detect the thiol-containing compounds by means of the precolumn derivatization with a fluorescent compound like monobromobimane [7]. These HPLC techniques give information about the size distribution of the polypeptides comprising metal-binding complexes, but the separation time is long (>25 min) and derivatization necessary when complex samples are injected onto the column. With the capillary technique presented in this paper, class III MTs can be quickly analyzed in crude extracts without derivatization and previous steps of purification and also allows to obtain the size distribution of the polypeptides.. 4. CONCLUSION This CZE procedure is a useful method for the separation of class III MTs with uncoated fused-silica capillaries. This technique has great interest for the rapid analysis of these molecules in complex biological samples. Analysis of such MTs may provide useful information about the response of many organisms (algae, plants…) to the toxic effects of heavy metals.. REFERENCES 1. W.E. Rauser, Annu. Rev. Biochem., 59 (1990), p. 61 2. J.C. Steffens, Annu. Rev. Plant Physiol. Plant Mol. Biol., 41 (1990), p. 553 3. N.J. Robinson, J. Phycol., 1 (1989), p. 5 4. J.H.R. Kagi and Y. Kojima (Editors), Metallothionein II, Birkhauser Verlag, Basel, 1987. 5. A. Tukendorf, T. Baszynski, Plant Physiol., 120 (1985), p. 57 6. R.N. Reese, D.R. Winge, J. Biol. Chem., 263 (1988), p. 12832 7. J.C. Steffens, D.F. Hunt, B.G. Williams, J. Biol. Chem., 261 (1986), p. 13879 8. G.L. Newton, R. Dorian, R.C. Fahey, Anal. Biochem., 114 (1981), p. 383 9. K.D. Lukacs, J.W. Jorgenson, Science, 222 (1983), p. 266 10. M. Yu, N.J. Dovinchi, Anal. Chem., 61 (1989), p. 37 11. M.V. Novotny, K.A. Cobb, J. Liu, Electrophoresis, 11 (1990), p. 735 12. K.J. Lee, G.S. Heo, J. Chromatogr., 559 (1991), p. 317.
(13) 13. J.W. Jorgenson, K.D. Lukacs, J. Chromatogr., 218 (1981), p. 209 14. A. Pessi, E. Bianchi, L. Chiappinelli, A. Nardi, S.J. Fanali, J. Chromatogr., 557 (1991), p. 307 15. J.H. Beattie, M.P. Richards, J. Chromatogr. A, 664 (1994), p. 129 16. V. Virtanen, G. Bordin, A.-R. Rodriguez, J. Chromatogr. A, 734 (1996), p. 391 17. E. Grill, E.L. Winnacker, M.H. Zenk, Science, 230 (1985), p. 574 18. N.J. Robinson, R.L. Ratcliff, P.J. Anderson, E. Delhaize, J.M. Berger, P.J. Jackson, Plant Sci., 56 (1988), p. 197.
(14)
Figure

+3


Documento similar