Advance Access publication 2017 September 25
The central spheroids of Milky Way mass-sized galaxies
Patricia B. Tissera,
1,2‹Rubens E. G. Machado,
1,3,4Daniela Carollo,
5,6Dante Minniti,
1,2,7Timothy C. Beers,
8Manuela Zoccali
2,9and Andres Meza
1,101Departamento de Ciencias Fisicas, Universidad Andres Bello, Av. Republica 220, Santiago, Chile 2Millennium Institute of Astrophysics, Av. Republica 220, Santiago, Chile
3Universidade Federal de Ouro Preto, Departamento de Fisica, Campus Universitario Morro do Cruzeiro, 35400-000 Ouro Preto, Brazil 4Universidade Tecnologica Federal do Parana, Rua Sete de Setembro 3165, 80230-901 Curitiba, Brazil
5INAF – Osservatorio Astronomico di Torino, I-10025 Pino Torinese, Italy 6ARC Centre of Excellence for All-Sky Astrophysics (CAASTRO) 7Vatican Observatory, V00120 Vatican City State, Italy
8Department of Physics and JINA Center for the Evolution of the Elements, University of Notre Dame, Notre Dame, IN 46556, USA 9Institute of Astronomy, Av. Vicu˜na Mackena, Pontificia Universidad Cat´olica de Chile, 7820436 Santiago, Chile
10Facultad de Ingenier´ıa, Universidad Aut´onoma de Chile, Pedro de Valdivia 425, 7500912 Santiago, Chile
Accepted 2017 September 18. Received 2017 September 18; in original form 2017 February 2
A B S T R A C T
We study the properties of the central spheroids located within 10 kpc of the centre of mass of Milky Way mass-sized galaxies simulated in a cosmological context. The simulated central regions are dominated by stars older than 10 Gyr, mostly formed in situ, with a contribution of∼30 per cent from accreted stars. These stars formed in well-defined starbursts, although accreted stars exhibit sharper and earlier ones. The fraction of accreted stars increases with galactocentric distance, so that at a radius of∼8–10 kpc, a fraction of∼40 per cent, on average, is detected. Accreted stars are slightly younger, lower metallicity, and moreα-enhanced than in situ stars. A significant fraction of old stars in the central regions come from a few (2-3) massive satellites (∼1010M). The bulge components receive larger contributions of accreted stars formed in dwarfs smaller than∼109.5M. The difference between the distributions of ages and metallicities of old stars is thus linked to the accretion histories – those central regions with a larger fraction of accreted stars are those with contributions from more massive satellites. The kinematical properties of in situ and accreted stars are consistent with the latter being supported by their velocity dispersions, while the former exhibit clear signatures of rotational support. Our simulations demonstrate a range of characteristics, with some systems exhibiting a co-existing bar and spheroid in their central regions, resembling in some respect the central region of the Milky Way.
Key words: galaxies: abundances – galaxies: evolution – dark matter.
1 I N T R O D U C T I O N
The formation of galaxies in a hierarchical universe involves the continuous accretion of lower mass systems (White & Rees1978). As a consequence, the so-called history of galaxy assembly is a complex process, with large variations at a given mass that also encode the effects of their formation environments. The Milky Way (MW) offers a unique perspective to test models of galaxy forma-tion because stars can be individually observed and their properties, such as kinematics, dynamics and chemical composition, can be more accurately derived in the four main stellar components: bulge, thin and thick discs, and stellar haloes (see Bland-Hawthorn &
E-mial:[email protected]
Gerhard2016, for a detailed discussion of the MW components). The co-existence of these components in the central region is now being explored in more detail as the result of larger and more pre-cise observational data in the bulge (e.g. Gran et al.2016; Zoccali et al.2017), stellar halo (e.g. Santucci et al.2015; Carollo et al.2016; Helmi et al.2017) and the disc (e.g. Minniti et al.2017).
Bulges of galaxies, once thought to be simple systems supported by velocity dispersion, have been reported to be more complex structures, with bars, pseudo-bulges, classical bulges, etc., or even a combination of them (e.g. MacArthur, Gonz´alez & Courteau2009; S´anchez-Bl´azquez et al. 2011; Morelli et al. 2012). The bulge of the MW is a clear example of this complex scenario (Gon-zalez et al.2015). Observational results suggest the co-existence of two stellar populations: low-metallicity,α-enhanced stars as-sociated with an spheroidal component and metal-rich, solar-level
2017 The Authors
[α/Fe] stars related to a bar structure (e.g. Zoccali et al.2008,2017; Babusiaux et al.2010; Johnson et al.2012; Ness et al.2012; Gonza-lez et al.2013). Recent observations have reported the existence of very old stars traced by RR Lyrae populations (Minniti et al.2016), as well as young stars (D´ek´any et al.2015), within the bulge region. Contemporary studies show that the MW halo also comprises diverse stellar populations (Carollo et al.2007,2010), with a sig-nificant number of structures and overdensities related to satellite accretion (Helmi & White1999; Gilbert et al.2013; Ibata et al.2014; Deason, Belokurov & Weisz 2015; Re Fiorentin et al. 2015; Grillmair & Carlin2016; Merritt et al.2016).
Carollo et al. (2007,2010) and Beers et al. (2012) report that stars in the diffuse inner and outer haloes exhibit different spatial distribu-tions, kinematics, dynamics and chemical composition, suggesting different formation mechanisms. According to these works, the in-ner halo population dominates the region within 15–20 kpc, and is composed of stars with metallicities in the range−2.0<[Fe/H]< −1.0; it is – on-average – non-rotating with higher binding energies. The outer halo population is mostly present atr>15–20 kpc, with metallicities [Fe/H]<−2.0; it also exhibits a high net retrograde rotation (∼−80 km s−1) and lower binding energies. These
proper-ties have been confirmed by a number of observational studies (de Jong et al.2010; Nissen & Schuster2010; An et al.2013; Hattori et al.2013; Kafle et al.2013; An et al.2015; Das, Williams & Bin-ney2016). Signatures of retrograde motion and less-bound orbits for outer-halo stars have been recently detected in studies using data from the first release of theGaiamission (Helmi et al.2017), confirming previous claims.
Still in the Local Group, large surveys conducted of the stellar halo of M31 have revealed its properties with unprecedented accu-racy. Gilbert et al. (2013) reports a significant decrease of metal-licity as the projected galactocentric distance increases, going from [Fe/H]∼ −0.4 in the inner-most fields, atr<20 kpc, to [Fe/H] ∼−1.4 in the outer-most fields, atr>90 kpc. Outside the Local Group, observation of six nearby massive disc galaxies with the Hubble Space Telescopehas revealed their stellar haloes with suffi-cient precision to estimate that, in half of them, there exists a clear negative colour gradient, reflecting declining metallicity profiles (Monachesi et al.2016; Harmsen et al.2017).
Different numerical approaches have been used to study the for-mation of bulges. Cosmological simulations predict the action of different channels of bulge formation via major collapse, gas in-flows, mergers and secular evolution (e.g. Tissera & Dominguez-Tenreiro 1998; Governato et al. 2009; Obreja et al. 2013; Okamoto2013). These simulations describe the formation of struc-ture in a cosmological context, including the physics of baryons by applying subgrid modelling. Simulations of individual isolated galaxies are valuable numerical tools. These models consider alter-native processes to explain the formation of the MW bulge from the thin/thick disc, for example (e.g. Di Matteo et al.2015; Debattista et al.2017).
Numerical simulations of MW-like galaxies in a cosmological context show that their stellar haloes formed with significant con-tributions from accreted stars. In particular, the outer regions of the haloes are dominated by this process (e.g. Bullock & John-ston2005; Helmi et al.2011; Tissera et al.2013; Cooper et al.2015). However, the inner regions are found to be assembled from a va-riety of stellar populations formed by different processes, such as in situ star formation from gas accreted into the central re-gions by the merging of more massive, gas-rich satellite galaxies, or in situ star formation from in-falling gas in the main galax-ies (e.g. Zolotov et al.2009; Tissera, White & Scannapieco2012;
McCarthy et al.2012; Obreja et al.2013; Tissera et al.2014). While in global terms there is agreement between numerical results com-ing out of the simulations, there are differences between them when they are examined in detail and compared to observations (Harmsen et al.2017). Therefore, progress remains to be made before a ro-bust description of the stellar haloes is achieved, since simulations still resort to subgrid physics and approximations in order to model the relevant physics (e.g. Tissera et al.2013; Cooper et al.2015; Pillepich, Madau & Mayer2015).
In this paper, we focus our analysis on the central regions of a set of MW mass-sized haloes from the Aquarius project (Scannapieco et al.2009). Special attention is given to old stars that are thought to be formed in the first galaxies. This is of particular interest, given the recent detections of old RR Lyrae stars in the bulge-halo (Minniti et al.2016) and the disc-halo (Minniti et al.2017) regions by the VVV Survey. Furthermore, Santucci et al. (2015) and Carollo et al. (2016) identified the so-called ‘ancient chronographic sphere (ACS)’ in the inner region of the MW’s stellar halo, which is claimed to be populated by stars older than 10 Gyr. The ACS is distinguished from the slightly younger outer halo region, which includes indi-vidual structures as young as 9–9.5 Gyr (Carollo et al.2016).
To carry out our study, we employ a subset of four simulated haloes that have central regions with different characteristics. We stress that these simulations are not expected to reproduce the MW in detail. They are used to learn about the process of galaxy forma-tion and the imprints that they might have left on the properties of galaxies atz=0. Our main focus is to understand to what extent observations can be reproduced, and make predictions that might be tested with on-going or future surveys. We note that the simulated haloes of the Aquarius runs have approximately a factor of two more stellar mass than that expected for the MW (Bland-Hawthorn & Gerhard2016). Nevertheless, there are several properties that can be reproduced by these haloes. From these similarities, and prin-cipally, from the differences, we expect to set contraints on the subgrid physics, and to learn about the assembly of stellar haloes (Tissera et al.2012; Cooper et al.2015; Pillepich et al.2015).
This paper is organized as follows. In Section 2, the main charac-teristics of the analysed simulations, the code used to run them and the analysed haloes are described. In Section 3, we analyse the prop-erties of the in situ and accreted stars in the central 10 kpc region and focus on the properties of the old stellar populations and their formation mechanisms. In Section 4, the velocity distributions of the stars in the central regions are considered. Finally, in Section 5, we summarize our results.
2 N U M E R I C A L E X P E R I M E N T S
In this paper, we analyse a galaxy subset from the Aquarius project performed with a version ofP-GADGET3 (Scannapieco et al.2009). This code includes chemical evolution and supernova (SN) feed-back. The Aquarius haloes have virial masses around 1012 M
, and were selected from the Millenium-II Simulation. The initial conditions are consistent with CDM cosmogony with the fol-lowing adopted cosmological parameters:m=0.25,=0.75,
b=0.04,σ8=0.9,ns=1 andH0=100hkm s−1Mpc−1with
h=0.73. The analysed haloes correspond to level 5 resolution. The dark matter particle masses are of the order of 106M
h−1, and the
initial gas particle masses are about 2×10⁵M
h−1. The maximum
physical gravitational softenings are in the range 0.5–1 kpch−1. The
selected sample has a variety of central regions (e.g. two galaxies with central bars are included), and we analysed the properties of their old stellar populations in detail, including their spatial
distributions. The Aq-C-5 simulation we include in our analysis is often taken as a reference halo (Aumer et al.2013).
As mentioned above, our version ofGADGET-3 (Springel 2005)
considers updated treatments for chemical enrichment, stochastic star formation (SF) and metal-dependent radiative cooling. It also includes a multiphase model for the interstellar medium (ISM), and the SN feedback prescription from Scannapieco et al. (2005,2006). Such SN feedback successfully triggers galactic mass-loaded winds without the need to introduce mass-scale parameters, so that it self-regulates according to the potential well of the systems. The mod-elling of galactic winds contributes to the alleviation of the angular momentum loss problem that produces discs that are too small in the numerical simulations (Navarro & Benz1991; Navarro & Steinmetz2000). As SN feedback models have become more so-phisticated, the resulting simulated galaxies are more comparable to observations (e.g. Dalla Vecchia & Schaye2008; Scannapieco et al.2008; Brook et al.2012).
Here, we also summarize the main aspects. The reader is ref-ereed to Scannapieco et al. (2008) for a detailed explanation of the SN feedback model. The adopted ISM multiphase model per-mits the co-existence of dense and diffuse gas phases (Scannapieco et al.2006). Each gas particle defines its own hot and cold phases, defined by applying local entropy criteria. This allows gas particles to hydrodynamically decouple from the low entropy ones (in the case that they are not in a shock front). The energy for each cold gas particle is stored in a reservoir until it fulfils the required condi-tions to be promoted into the hot phase. The chemical model adopts the nucleosynthesis productions of Woosley & Weaver (1995) and Thielemann, Nomoto & Hashimoto (1993) to describe the enrich-ment by Type II (SNII) and Type Ia (SNIa), respectively. The stars with masses larger than 8 M are assumed to end as SNII, and a value of 0.0015 SNIa per year is adopted for the rate of SNIa, as discussed in Mosconi et al. (2001) and Jimenez, Tissera & Matteucci (2015).We assume a Salpeter Initial Mass Function in order to compute the number of stars of a given mass. The chemical model assumes that the ejection of enriched material and energy by SNIa has a time delay randomly selected in the range [0.1, 1] Gyr (see Jimenez et al.2015, for a discussion on this point), and that the SNII explodes according to the lifetimes of Raiteri, Villata & Navarro (1996). Each SN event releases 0.7×1051erg s−1, which
is distributed into the hot and cold gas surrounding each stellar par-ticle. The energy released by each SN event is injected into the cold gaseous phase as a fractionc=0.5, with the rest being pumped
into the hot medium. Chemical elements are distributed into both the cold and hot gas phases using the samec.
2.1 The simulated galaxies
We study in detail the main galaxies in virialized haloes identi-fied by using a friends-of-friend algorithm andSUBFIND(Springel,
Yoshida & White 2001). A main galaxy is defined as the most massive system within a virial potential well atz=0, SUBFIND program (Springel et al.2001). The physical properties for main galaxies are calculated within the galaxy radius, defined to enclose ∼80 per cent of the baryonic mass of a galaxy. A detailed discussion on the effects of numerical resolution on the dynamics and chemi-cal properties can be found in Scannapieco et al. (2009) and Tissera et al. (2012), respectively.
We use the dynamical decomposition performed by Tissera et al. (2012). There are then three dynamical components for each sys-tem: bulge, disc and stellar halo. For this purpose, we estimate the parameterof the star particles, defined as=jz/jz, max(E), where
jzis the angular momentum component in the direction of the total
angular momentum, andjz, max(E) is the maximumJzover all
parti-cles of a given binding energy,E. A particle on a perfect prograde circular orbit in the disc plane has = 1. We consider particles withgreater than 0.65 to be part of a disc. The particles that do not satisfy this requirement are taken to belong to the spheroidal component. By inspecting the–Eplane, we checked if the adopted limits are suitable to individualize the rotational supported compo-nents. We also distinguish between the bulge and the stellar halo components. The bulge comprises the most gravitationally bound particles, while the less-bound particles are considered to form the stellar halo. For consistency with our previous work, we adopt the criteria defined by Tissera et al. (2012) and also used by Tissera et al. (2013,2014) and Tissera & Scannapieco (2014) to analyse the stellar haloes (see also Scannapieco et al.2009,2010). According to these criteria, the bulges are defined by those particles that have binding energy lower than the lowest found at the half stellar-mass radius of a galaxy. While the stellar haloes are comprised of par-ticles with higher binding energies, the disc parpar-ticles are taken to have >0.65 and located within the 1.5 times the galaxy radius.
In this work, we analyse all stars supported by their velocity dis-persion: the bulge and stellar haloes within the inner 10 kpc region. This region is defined by considering that the effective radius,rb, of
the analysed bulges are∼3–4 kpc, as reported by Scannapieco et al. (2010). In particular, we adopt those obtained from the dynamical decomposition, since they are consistent with our analysis. The de-fined 10-kpc regions represent about three times therb, and ensure
that we include the bulge and the transition bulge-halo region. A single cut-off radius is adopted for the sake of simplicity. These authors also detected bar structures in some of the galaxies of the Aquarius run. In particular, Aq-A and Aq-C have Bar/T ratios of ∼0.23.
The analysis carried out by Tissera et al. (2012), which classifies stellar populations according to their origin as in situ or accreted stars, is applied to the simulated galaxies. Accreted stars are those stars that formed in separate galactic systems (i.e. outside the virial radius of the main progenitor) and were accreted later on by the main progenitor halo. The in situ stars are those formed within the virial radius of the progenitor galaxies from gas that was directly accreted by the main progenitor as gas inflows or was contributed by gas-rich mergers. From Tissera et al. (2014), we know that the stellar haloes of the Aquarius haloes are dominated by accreted stars, and that, in the inner stellar haloes, the fraction of contributed in situ stars increases. These authors showed that the relative contributions of both components depend strongly on the history of formation of the halo and the main galaxy, while the metallicity of the stellar haloes beyond∼20 kpc is determined by the characteristics of the accreted galaxy satellites.
3 T H E I N N E R 1 0 K P C S P H E R O I D
To analyse the stellar populations within 10 kpc supported by ve-locity dispersion, the stellar populations are classified as in situ or accreted subsamples according to the criteria described above. Fig. 1shows the projected density distributions of stars formed in situ (upper panels) and in accreted satellites (lower panels). All galaxies have been rotated so that their reference system is oriented along the main axis of rotation with respect to the disc plane. As can be seen from this figure, two systems exhibit clear bar structures. Scannapieco & Athanassoula (2012) analysed the bars and found that they have lengths and strengths, stellar density profiles, and velocity fields in good agreement with observations
Figure 1. Projected density maps of stars of the inner 10 kpc regions formed in situ (upper panels) and in satellites that were later accreted (lower panels) in the central regions of the four analysed galaxies: Aq-A, Aq-B, Aq-C and Aq-D (from left- to right-hand panels) atz=0.
Figure 2. Upper panels: Mass fractions of all stars (i.e. accreted and in situ stars; black lines) and accreted stars alone (magenta lines) as a function of galactocentric distance in the four analysed haloes (each subsample has been normalized to its total mass). Lower panels: The fraction of accreted stars with respect to the total mass of the spheroidal component (i.e. bulge and stellar halo) as a function of galactocentric distance. The frequency of accreted stars increases with increasing galactocentric distance, as expected (Tissera et al.2013,2014).
(Gadotti2011) and dynamical idealized simulations (Athanassoula & Misiriotis2002). In a previous paper, Scannapieco et al. (2010) identified bars in Aq-A and Aq-C, as mentioned in Section 2. In the case of Aq-D, there is also a very weak elongated distribution (see also Scannapieco et al.2011), although it was not classified as a bar structure by Scannapieco et al. (2010). As can be seen from this figure, the bar structures are clearly present in the in situ stellar populations. However, the accreted stars exhibit more spherical dis-tributions. In the case of Aq-B, the distribution of in situ stars is more
concentrated and spherical, while the accreted stars show a more elongated distribution.
In order to provide insight on the distribution of stars in the central regions of our simulated galaxies, the stellar mass fraction as a function of galactocentric distances for each of the four analysed haloes, and the corresponding calculations considering the accreted stars, are shown in Fig. 2(each subsample has been normalized to its total stellar mass within the defined central region; upper panels). The lower panels show the fraction of accreted stars with
Table 1. Information on the inner 10 kpc regions of the analysed Aquarius haloes: virial mass, stellar mass of the main galaxy, stellar mass within 10 kpc, mass of stars older than 10 Gyr within 10 kpc, mass of stars younger than 8 Gyr within 10 kpc, the mean age of the in situ and accreted stars, the median [Fe/H] and [O/Fe] abundances for the in situ and accreted stars, the fraction of stars older than 10 Gyr, the fraction of the old stars which were accreted by galaxy satellites, the fraction of old, accreted stars which belong to the bulge components, the fraction of stars younger than 8 Gyr and the fraction of young stars formed in situ (from the upper to lower raws).
Aq-A-5 Aq-B-5 Aq-C-5 Aq-D-5
Ageinsitu(Gyr) 11.44 10.82 11.85 11.12
Ageaccreted(Gyr) 12.62 11.26 12.48 11.64
[Fe/H]insitu −1.02 −1.06 −0.81 −0.97
bulge,accreted 0.31 0.72 0.33 0.36
Fyoung 0.04 0.14 0.01 0.03
Fyounginsitu 1 0.93 1 0.99
respect to the total stellar mass at a given galactocentric distance. In all analysed haloes, the frequency of accreted stars increases with increasing galactrocentric distance, as expected (Tissera et al.2013). For the analysed haloes, we found that∼10–25 per cent of the stellar mass at ∼10 kpc corresponds to accreted stars (Table 1). These relative fractions are in global agreement with other previous work, such as Pillepich et al. (2015). We note that these authors included the disc components in their estimations (their fig. 4), and that their definitions of bulge, inner and outer haloes are based on spatial separations. Hence, the comparison can be made only on a generic basis.
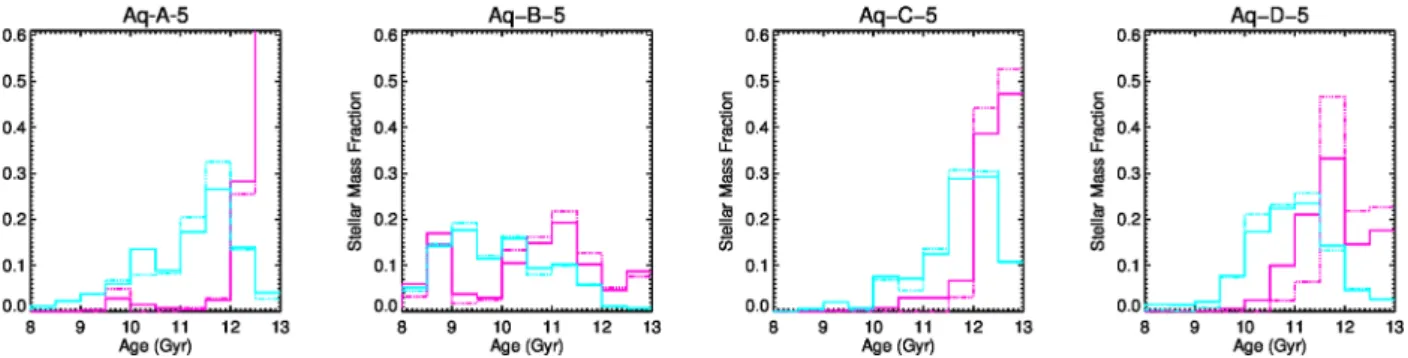
Fig.3shows the distribution of ages for both in situ and accreted stars (each subsample has been normalized to its total stellar mass to highlight the difference in their age distributions). From this fig-ure, we can see that there is a slight difference between the in situ and accreted stars. Aq-A, Aq-D and Aq-C show a clear trend for the accreted stars to be older than the in situ stellar components by
∼1 Gyr, on average. In situ and accreted stars in the central regions formed mainly in starbursts, occurring in the progenitor galaxy and accreted satellites, respectively. The in situ stars have more ex-tended starbursts. Conversely, Aq-B exhibits a more uniform age distributions for both types of stellar populations as the result of its assembly history involving an early massive merger, which reju-venate the central region. In Fig.3, we also show the distributions for the stars classified as belonging to the bulge components (dotted lines). As can be seen, the distributions are quite similar as expected since this component dominates the central regions.
Accreted stars tend to be less chemically enriched, as can be appreciated from Fig.4. For all analysed systems, accreted stars show a higher fraction of metal-poor stars with respect to the [Fe/H] distribution of the in situ components. This is particularly clear for Aq-A and Aq-C. The relative contribution of low- and high-metallicity stars in the accreted components is related to the masses of the contributing satellites, as discussed in Section 3.2. These metallicity characteristics are expected, considering the ages and the trend for these stellar populations to be formed in starbursts. Due to the lifetime delay for SNIa, short-duration starbursts do not allow SNIa to enrich the remaining gas before star formation ceases in small galaxies. The medians [O/Fe] of these stellar populations are super-solar, as expected, except for Aq-B, which exhibits lower mean [O/Fe] ratios as a result of the contribution from a more massive satellite galaxy.
3.1 Old stars within the inner 10 kpc
There is a growing interest in understanding where and when the old stellar populations formed, as they are expected to have formed in the first galaxies. As mentioned above, in this study old stars are defined by assuming a minimum age of 10 Gyr. In observational studies such old stellar populations can be traced by RR Lyraes. As can be seen from Fig.3, most of the stars in the inner spheroids are older than 10 Gyr (except for Aq-B). Within the inner 10 kpc we find that more than∼85 per cent are stars older than 10 Gyr (except for Aq-B, which exhibits a lower value,∼50 per cent of old stars). Such a property is in global agreement with observational results regarding the bulge (Feltzing & Gilmore2000; Zoccali et al.2006) and the inner region of the stellar halo (Santucci et al.2015; Carollo et al.2016) of the MW.
All simulated central regions have a small fraction of stars younger than 108 yr, which represents∼1–3 per cent of the
stel-lar mass in the inner 10 kpc region. Interestingly, most of them are part of the bulge component (i.e. they belong to the most
Figure 3. Stellar-mass weighted distributions of age for in situ (cyan solid lines) and accreted (magenta solid lines) stars for the analysed Aquarius haloes within 10 kpc. We also show the stars classified as part of the bulge components for comparison (dotted lines). Accreted stars tend to be older than in situ stars by∼1 Gyr, on average. Most of the in situ stars in Aq-A, Aq-C and Aq-D formed in a main starburst. Aq-B has wider age distributions for both in situ and accreted stars.
Figure 4. Stellar-mass weighted distributions of [Fe/H] for in situ (cyan lines) and accreted (magenta lines) stars for the analysed Aquarius haloes (normalized to the total stellar mass in each subsample). For all galaxies, the [Fe/H] distributions of accreted stars are shifted towards lower metallicities than the distributions of in situ stars within 10 kpc. The shifts are larger for Aq-A and Aq-C.
Figure 5. Distributions of stellar mass as a function of galactocentric distance for old (blue lines) and old, accreted (magenta lines) stars for the four analysed Aquarius haloes (upper panel) and the fraction of old, accreted stars with respect to old stars as a function of galactocentric distance (lower panels).
gravitationally bound stellar populations). Recent discoveries of cepheids in the bulge of the MW indicate the existence of young stars in the bulge (D´ek´any et al.2015). A census of these young populations would be of utmost importance to set constraints on the formation of the MW and large spirals in general. Our results show that, in the bulge components, these young stars are metal-rich in situ stars, with [Fe/H]∼[−0.1,−0, 4] and sub-solar [O/Fe] abun-dance ratios. They formed from recycled material with a significant contribution from SNIa yields.
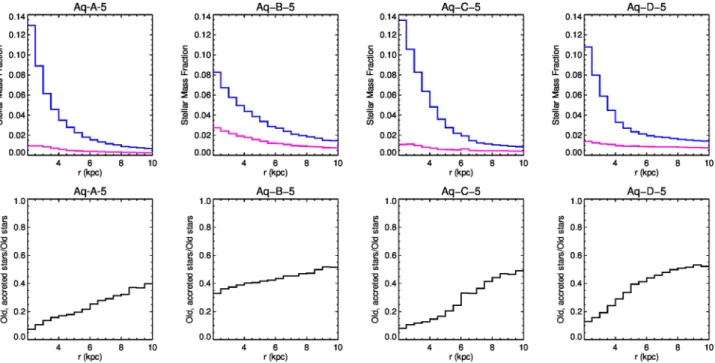
Fig.5(upper panels) shows the distributions of old stars (blue lines) and old, accreted stars (red lines) within the central 10 kpc. They tend to be concentrated in the central regions. However, as one moves to larger radii, the fraction of accreted stars increases systematically, as shown by Tissera et al. (2013,2014). This trend has been also reported by other work, such as Pillepich et al. (2015) and Cooper et al. (2015), where different codes and subgrid physics are adopted. We note that different hydrodynamical simulations do not agree on all the properties predicted for the stellar haloes. But they do agree on the stellar haloes being formed mainly by the aggregation of small galaxies and stars formed in situ. The relative
fractions of these populations are still under debate, as they vary with the subgrid physics adopted (but not in a systematic fashion; Cooper et al.2015).
The lower panel of Fig.5shows the fraction of old, accreted stars with respect to old stars at a given radius. Globally, the mass frac-tion of old, accreted stars is larger at larger galactocentric distances. A more detailed examination reveals that there are two kind of trends – two of the analysed haloes show a monotonically increas-ing fraction of old, accreted stars (Aq-A and Aq-C), while the other two haloes exhibit shallower increases, reaching plateaus at about ∼50 per cent contribution (Aq-B and Aq-D). The latter suggests a significant contribution of old, accreted stars to the more central re-gions. As we show in the next section, these two haloes have a larger contribution from more massive dwarf galaxies contributing to the inner regions. Globally, the mass fractions of the old, accreted stars represent∼10–35 per cent of the total old stars within the central 10 kpc.
Our simulations indicate that∼40 per cent of the old stars would be accreted stars at∼10 kpc. This fraction is in agreement with the observational results for the MW reported by An et al. (2015) for
Figure 6. Mass-weighted distribution of [Fe/H] for old stars (blue lines) and old, accreted stars (magenta lines) in the central region of the four analysed Aquarius haloes (right-hand panels). Each subsample has been normalized to the its corresponding total mass. This figure shows that old stars have metallicity distributions around [Fe/H]∼ −1 and that accreted old stars might be displaced towards lower metallicities ([Fe/H]∼[−1.2,−1.5]) depending on the history of assembly of the inner regions.
Figure 7. Cumulative mass fractions of old stars (>10 Gyr) within the inner 10 kpc regions, as a function of the dynamical mass of the accreted satellite where they formed, at the time the satellite galaxies enter the virial radius of the main galaxy (black lines). The distributions for accreted stars in the bulges (green), inner haloes (blue) and outer haloes (red) are also included. The central regions receive significant contributions of stars from smaller satellites, while more than 50 percent arrives from a few more massive systems,Mdyn>109.5M.
the solar neighbourhood. We find that the old, accreted stars are well-mixed within the central regions and less gravitational bound than in situ stars.
An important aspect that can be appreciated from inspection of Fig. 5is that the relative contributions of old, accreted stars is different for different haloes, pointing to a strong dependence on their assembly histories. The relative contributions of accreted to in situ stars in the stellar haloes are important constraints for both improving the subgrid physics modelling in numerical simulations and for understanding the assembly history of galaxies. There are on-going surveys that will provide unprecedented information for the MW (e.g. Helmi et al. 2017) to contrain the models and the subgrid physics beyond what is currently possible.
In agreement with the global trends of Fig.4, we find that old, accreted stars tend to be lower metallicity. Fig.6displays the mass fraction of old stars (blue) and old, accreted stars (red lines). Two of our haloes (Aq-B and Aq-D) exhibit a very weak shift towards lower [Fe/H] abundances, while the other two (Aq-A and Aq-C) have a larger contribution of low-metallicity, accreted stars. Once again, this points to different histories of assembly. As can be seen, the distributions in Fig.6are only slightly different to those of the total stellar populations shown in Fig. 4. This is due to the fact that most of the stars in the central regions are older than 10 Gyr, in agreement with recent results reported for the MW by Santucci et al. (2015) and Carollo et al. (2016).
For the set of analysed galaxies, we estimate that old, accreted stars are older by∼0.5–1.5 Gyr compared to old, in situ stars. Old, accreted stars tend to be less iron enriched, with median [Fe/H]
lower by∼0.26 dex, and moreα-enriched by∼0.13 dex than old, in situ stars.
These trends suggest that the old, accreted stars formed in smaller systems at early times, which merged within the central bulk of the forming galaxy. The quenching of star formation occurred at early times, which explains both the lower metallicity content and highα-element enrichment. Old, in situ stars formed during more extended starburst that occurred in the progenitor(s). This led to higher metallicities and lowerα-element enrichments (see Table1).
3.2 History of assembly
To search for the satellites that contributed the old stars, we fol-lowed back each of the stars with ages larger than 10 Gyr within the central 10 kpc regions, identifying the galactic systems where they originally formed. Fig.7shows the contributions of old stars as a function of the dynamical mass of the accreted satellite galaxies. The dynamical masses are taken at the time the satellite galaxy enters the virial radius of the main galaxy. Dynamical friction will modify the mass of the accreted satellites as they fall in, depositing stars in the outer regions of the haloes before they reach into the cen-tral regions (Amorisco2017). As can be seen from Fig.6, haloes with larger fractions of accreted, low-metallicity stellar popula-tions in the central regions have a larger contribution from ac-creted satellites withMdyn <1010M(Aq-A and Aq-C). When
massive satellites contribute significantly more stars, then their [Fe/H] distributions appear more similar to the total abundance distributions with a smaller contribution of low-metallicity stars
Figure 8. Galactocentric rotational velocities (VGC) and velocity dispersions (σGC) for the in situ stellar populations in the central regions of the analysed
Aquarius haloes. Upper panel: The projected meanVGCandσGCas a function of galactrocentric longitude and latitude. Middle and lower panels: 2D projected
maps ofVGCandσGC, respectively, within the inner 10 kpc regions. In the cases where there is a clear bar structure (Aq-C and Aq-D), the simulated velocity
distributions are in agreement with observations of the MW (Zoccali et al.2017).
[Fe/H]< −1.1. In this case, we found that more than ∼50 per cent of the accreted stellar mass in the central regions arrives from satellites withMdyn>1010M(Aq-B and Aq.D).
Fig.7also includes the stellar mass fractions of accreted stars identified as belonging to the bulge (green lines), inner halo (blue lines) and outer halo (red lines) as a function of the dynamical mass of the parent satellites. Recall that this classification is based on a binding energy criterion, so that stellar particles in the bulge com-ponents are those that are more gravitationally bound than those in the inner and outer haloes (see Section 2). As can be seen from this figure, the most bound accreted particles (associated with the bulge component) are contributed by smaller satellites, with a significant impact from those aroundMdyn ∼109–9.5M. The exception is
Aq-B, which received contributions from more massive satellites in the inner regions as well as in the most bound component. In the central regions, the three dynamical components co-exist, and each of them have different fractions of in situ and accreted stars. As first shown by Tissera et al. (2012), the bulges have the small-est contributions of accreted stars, followed by the inner and the outer haloes, in increasing order. Considering the old, accreted stars within the inner 10 kpc, we found that for Aq-A, Aq-C and Aq-D, most of them (∼65 per cent) belong to the inner region of the stellar haloes, with∼0.35 per cent forming part of the bulges. Aq-B shows
a larger contribution to the bulge (∼72 per cent), as a consequence of its particular history of formation.
We calculated that, for Aq-A, Aq-C and Aq-D, the accretion of satellites into the inner 10 kpc regions occurred atz>4, and most of the mergers involved small satellites (Mdyn<108M), with only a
few (∼2–3) being in the rangeMdyn∼109.5–1010M. These few
more massive mergers contribute a significant fraction of stars to the central regions, as can be seen from Fig.7. Aq-B experienced more massive accretion at a lower redshift (z∼3), which determines their different properties in comparison with the rest of the analysed haloes.
3.3 Kinematics of the central regions
In the previous sections, we analysed the spatial, age and metallicity distributions of stars in the central regions, finding a difference between accreted and in situ stars. Accreted stars were found to form spheroidal distributions, with lower metallicities and older ages, on average. We showed that the differences can be ascribed to their different assembly histories.
Here, we focus on the kinematical properties of stars in the cen-tral regions. To make the analysis similar to Galactic observations (Zoccali et al.2017), Figs8and9show the galactocentric rotational
Figure 9. Galactocentric rotational velocities (VGC) and velocity dispersions (σGC) for theaccretedstellar populations in the central regions of the analysed
Aquarius haloes. Upper panel: The projected meanVGCandσGCas a function of galactrocentric longitude and latitude. Middle and lower panels: 2D projected
maps ofVGCandσGC, respectively, within the inner 10 kpc egions. Accreted stars are dominated by velocity dispersion.
velocities, as seen from a location at a disc scalelength away from the galactic centre as given in Scannapieco et al.2010, and the ob-servers is located at a 20 degree angle with respect to the bar. The mean rotational velocities and dispersions are shown as a function of galactic longitude,l, for different ranges of galactic latitude,b (top rows). We also include their 2D projected maps (middle rows and bottom rows), where each frame is approximately 10 kpc wide. For the in situ stellar populations, the central regions exhibit different levels of rotation, while the velocity dispersions have a maximum in the very central regions, as expected, since they are the most dense and concentrated (Fig.8). However, for Aq-B, there is no clear central concentration, which is consistent with the star formation history being more extended in time, as shown in Fig.3. Aq-C and Aq-D show the presence of the bar structure in the ve-locity dispersion maps. The central regions of Aq-C best resemble the results reported by Zoccali et al. (2017). However, we note that the velocity dispersions are larger than those reported for the MW. This may be due to an excess of stars in the central regions com-pared to observationally motivated results (Scannapieco et al.2009; Moster, Naab & White2013). Nevertheless, it is very encouraging that hydrodynamical cosmological simulations within the current cosmological framework are able to naturally reproduce the co-existence of a bar and spheroidal component.
Accreted stars are dominated by velocity dispersion, as can be appreciated from Fig.9. Aq-C and Aq-D exhibit more spherical
distributions, with weaker signs of rotation and an increase of the central velocity dispersion. However, there is only a weak depen-dence on galactic latitude, in contrast to the trends found for the in situ components (Fig.8).
Observationally, it is not possible to easily distinguish between accreted and in situ stars. Hence, for the purpose of providing a more suitable comparison with observations, we estimate the kinematic distributions selecting stars according to [Fe/H]<−1.1 (similar results are found by using Fe/H]< −0.5) and stellar ages older than 10 Gyr, separately, and without distinguishing between ac-creted and in situ components. Fig.10shows these distributions for Aq-C, the halo that best reproduces the co-existence of a bar and a spheroidal component. As can be seen from this figure, old stars follow more closely the distributions determined for the total in situ component. In fact, this halo has a clear, old central knot. Low-metallicity stars also show a central concentration and veloc-ity dependence in agreement with the presence of a bar, but the signal is weaker.
4 C O N C L U S I O N S
We have analysed the inner 10 kpc spheroid of four haloes of MW mass-size galaxies simulated within a cosmological context. We focused our study on the spatial distributions, ages, metallicities and velocity distributions of the in situ and accreted stars in these
Figure 10. Galactocentric rotational velocities (VGC) and velocity
disper-sions (σGC) for the stellar populations in the central spheroid region of the
analysed Aq-C-5 halo, selected according to [Fe/H]< −1.1 (right-hand column) and age>10 Gyr (left-hand column). Upper panel: The projected meanVGCandσGCas a function of galactocentric longitude and latitude.
Middle and lower panels: 2D projected maps ofVGCandσGC, respectively,
within the inner 10 kpc region.
central regions. Special attention was paid to old stars (>10 Gyr). These stars can be traced by RR Lyraes, and constitute a window into the first stages of the evolution of galaxies. Our knowledge of the central region of the MW has improved dramatically in the last few years, providing insights on the bulge (e.g. Gran et al.2016; Zoccali et al.2017) and the stellar halo (e.g. An et al.2015; Santucci et al.2015; Carollo et al.2016; Das et al.2016).
The analysis of the simulated stellar populations in the context of these new observations, as well as forthcoming from theGaia mission (e.g. Helmi et al.2017), is of utmost importance to interpret them within a cosmological framework. It is not only relevant to understand the properties of the bulge and the stellar haloes sep-arately, but also together. It is also vital to confront models that set constraints on the subgrid physics used in the simulations, since present numerical codes show agreement in their global behaviours, but important differences when examined in more detail (e.g. Harmsen et al.2017).
For the central spheroid region defined within the inner 10 kpc of the analysed Aquarius subsample, we find the following results:
(i) The central regions of the simulated MW mass-sized galaxies are found to be populated mainly by stars older than 10 Gyr in three of the analysed haloes (Aq-B has∼50 per cent of its stars>10 Gyr).
Most of these stars formed in situ, with a fraction of old stars in the range∼0.10–0.35 contributed by satellite accretion. The spatial distributions of in situ and accreted stars are different – accreted stars form centrally concentrated spheroidal distributions, while the in situ components exhibit clear bar structures or elongated distribu-tions. The predicted kinematics are consistent with these properties. In particular, the rotational velocity and velocity dispersion distri-butions of the central region of Aq-C resemble those reported by Zoccali et al. (2017).
(ii) Both in situ and accreted stars in the central regions formed in main starbursts (in the progenitor and accreted satellites, respec-tively). However, accreted stars formed early, so that there is mean age difference of∼0.5–1 Gyr between the in situ and accreted stars. The age distributions of in situ stars exhibit a tail towards younger ages. Aq-B has a more uniform star formation history for both in situ and accreted stars, since it is affected by a more recent merger event. The age distributions are consistent with the central regions being dominated by stars older than 10 Gyr. This finding is in agreement with the observational results of Santucci et al. (2015) and Carollo et al. (2016), who identified an ACS in the MW, extending out to beyond the Sun’s location.
(iii) The metallicity distributions of the in situ and accreted stars are slightly different. The metallicity distributions of the accreted stars are shifted towards lower abundances than those of the in situ stars, and the former have higherα-element enhancements. These trends are consistent with their formation history, since the accreted stars are formed in satellite galaxies with dynamical masses smaller than 1010M
(Tissera et al.2014), while the in situ stars formed in the main progenitors.
(iv) Regarding the old stars, they represent most of the stars in the central regions, on average. In our simulations, old, accreted stars belong preferentially to the stellar haloes within the inner 10 kpc. A mass fraction of∼35 per cent is part of the bulge components. The accretion histories show that Aq-A and Aq-C received larger contributions from smaller satellites. On the other hand, the central regions of Aq-B and A-D experienced a greater contribution from a few massive accreted dwarf galaxies. As a consequence, the former have more metal-poor andα-element enhanced stellar populations. At a fiducial solar radius, we estimate that∼40 per cent of the old stars are accreted. This fraction is in reasonable agreement with the recent results of An et al. (2015) for the solar neighbourhood.
(v) All the analysed central regions have a small fraction of stars younger than 0.1 Gyr, ∼3 per cent, on average. These stars are formed in situ, and have high metallicity and lowα-element en-hancements; they formed from heavily recycled material. It would be of great interest to measure the chemical abundances of the cepheids stars that have been detected in the bulge of the MW (D´ek´any et al.2015).
(vi) Among the analysed simulated galaxies, Aq-C is found to exhibit kinematical distributions that are broadly similar to those reported for the MW, albeit with a higher velocity dispersion. De-spite this, the Aq-C halo is a clear example of an inner region where a bar structure and a spheroidal component co-exist. The former is dominated by in situ stars, while the latter hosts old stars formed in the first stages of its assembly. The kinematic distribution shows a concentration of old stars in the very central region of this halo.
AC K N OW L E D G E M E N T S
PBT, DM and AM acknowledge partial support from the Nucleo UNAB 2015 DI-677-15/N of Universidad Andres Bello. PBT ac-knowledges partial support from Fondecyt Regular 1150334 and
the Southern Astrophysics Network (SAN) collaboration funded by Conicyt, and PICT 2011-0959 and PIP 2012-0396 (Mincyt, Argentina). DM and MZ are supported by the BASAL Center for Astrophysics and Associated Technologies (CATA) through grant PFB-06, and the Ministry for the Economy, Development, and Tourism, Programa Iniciativa Cientifica Milenio through grant IC120009, awarded to the Millennium Institute of Astrophysics (MAS), and by FONDECYT Regular grant No. 1130196. DC and TCB acknowledge partial support for this work from grant PHY 14-30152; Physics Frontier Center/JINA Center for the Evolution of the Elements (JINA-CEE), awarded by the US National Sci-ence Foundation. REGM acknowledges support from Ciˆencia sem Fronteiras (CNPq, Brazil).
R E F E R E N C E S
Amorisco N. C., 2017, MNRAS, 464, 2882 An D. et al., 2013, ApJ, 763, 65
An D., Beers T. C., Santucci R. M., Carollo D., Placco V. M., Lee Y. S., Rossi S., 2015, ApJ, 813, L28
Athanassoula E., Misiriotis A., 2002, MNRAS, 330, 35
Aumer M., White S. D. M., Naab T., Scannapieco C., 2013, MNRAS, 434, 3142
Babusiaux C. et al., 2010, A&A, 519, A77 Beers T. C. et al., 2012, ApJ, 746, 34
Bland-Hawthorn J., Gerhard O., 2016, ARA&A, 54, 529 Brook C. B. et al., 2012, MNRAS, 426, 690
Bullock J. S., Johnston K. V., 2005, ApJ, 635, 931 Carollo D. et al., 2007, Nature, 450, 1020 Carollo D. et al., 2010, ApJ, 712, 692 Carollo D. et al., 2016, Nature Phys., 12, 1170
Cooper A. P., Parry O. H., Lowing B., Cole S., Frenk C., 2015, MNRAS, 454, 3185
Dalla Vecchia C., Schaye J., 2008, MNRAS, 387, 1431 Das P., Williams A., Binney J., 2016, MNRAS, 463, 3169
de Jong J. T. A., Yanny B., Rix H.-W., Dolphin A. E., Martin N. F., Beers T. C., 2010, ApJ, 714, 663
Deason A. J., Belokurov V., Weisz D. R., 2015, MNRAS, 448, L77 Debattista V. P., Ness M., Gonzalez O. A., Freeman K., Zoccali M., Minniti
D., 2017, MNRAS, 469, 1587 D´ek´any I. et al., 2015, ApJ, 812, L29 Di Matteo P. et al., 2015, A&A, 577, A1 Feltzing S., Gilmore G., 2000, A&A, 355, 949 Gadotti D. A., 2011, MNRAS, 415, 3308 Gilbert K. et al., 2013, BAAS, 221, 146.16
Gonzalez O. A., Rejkuba M., Zoccali M., Valent E., Minniti D., Tobar R., 2013, A&A, 552, A110
Gonzalez O. A., Zoccali M., Debattista V. P., Alonso-Garc´ıa J., Valenti E., Minniti D., 2015, A&A, 583, L5
Governato F. et al., 2009, MNRAS, 398, 312 Gran F. et al., 2016, A&A, 591, A145
Grillmair C. J., Carlin J. L., 2016, in Newberg H. J., Carlin J. L., eds, Astrophysics and Space Science Library, Vol. 420, Stellar Streams and Clouds in the Galactic Halo. Springer-Verlag, Berlin, p. 87
Harmsen B., Monachesi A., Bell E. F., de Jong R. S., Bailin J., Radburn-Smith D. J., Holwerda B. W., 2017, MNRAS, 466, 1491
Hattori K., Yoshii Y., Beers T. C., Carollo D., Lee Y. S., 2013, ApJ, 763, L17
Helmi A., White S. D. M., 1999, MNRAS, 307, 495
Helmi A., Cooper A. P., White S. D. M., Cole S., Frenk C. S., Navarro J. F., 2011, ApJ, 733, L7
Helmi A., Veljanoski J., Breddels M. A., Tian H., Sales L. V., 2017, A&A, 598, A58
Ibata R. A. et al., 2014, ApJ, 780, 128
Jimenez N., Tissera P. B., Matteucci F., 2015, ApJ, 810, 137
Johnson C. I., Rich R. M., Kobayashi C., Fulbright J. P., 2012, ApJ, 749, 175
Kafle P. R., Sharma S., Lewis G. F., Bland-Hawthorn J., 2013, MNRAS, p. 745
MacArthur L. A., Gonz´alez J. J., Courteau S., 2009, MNRAS, 395, 28 McCarthy I. G., Font A. S., Crain R. A., Deason A. J., Schaye J., Theuns T.,
2012, MNRAS, 420, 2245
Merritt A., van Dokkum P., Abraham R., Zhang J., 2016, ApJ, 830, 62 Minniti D., Contreras Ramos R., Zoccali M., Rejkuba M., Gonzalez O. A.,
Valenti E., Gran F., 2016, ApJ, 830, L14 Minniti D. et al., 2017, AJ, 153, 179
Monachesi A., Bell E. F., Radburn-Smith D. J., Bailin J., de Jong R. S., Holwerda B., Streich D., Silverstein G., 2016, MNRAS, 457, 1419 Morelli L., Corsini E. M., Pizzella A., Dalla Bont`a E., Coccato L.,
M´endez-Abreu J., Cesetti M., 2012, MNRAS, 423, 962
Mosconi M. B., Tissera P. B., Lambas D. G., Cora S. A., 2001, MNRAS, 325, 34
Moster B. P., Naab T., White S. D. M., 2013, MNRAS, 428, 3121 Navarro J. F., Benz W., 1991, ApJ, 380, 320
Navarro J. F., Steinmetz M., 2000, ApJ, 538, 477 Ness M. et al., 2012, ApJ, 756, 22
Nissen P. E., Schuster W. J., 2010, A&A, 511, L10
Obreja A., Dom´ınguez-Tenreiro R., Brook C., Mart´ınez-Serrano F. J., Dom´enech-Moral M., Serna A., Moll´a M., Stinson G., 2013, ApJ, 763, 26
Okamoto T., 2013, MNRAS, 428, 718
Pillepich A., Madau P., Mayer L., 2015, ApJ, 799, 184 Raiteri C. M., Villata M., Navarro J. F., 1996, A&A, 315, 105
Re Fiorentin P., Lattanzi M. G., Spagna A., Curir A., 2015, AJ, 150, 128 S´anchez-Bl´azquez P., Ocvirk P., Gibson B. K., P´erez I., Peletier R. F., 2011,
MNRAS, 415, 709
Santucci R. M. et al., 2015, ApJ, 813, L16
Scannapieco C., Athanassoula E., 2012, MNRAS, 425, L10
Scannapieco C., Tissera P. B., White S. D. M., Springel V., 2005, MNRAS, 364, 552
Scannapieco C., Tissera P. B., White S. D. M., Springel V., 2006, MNRAS, 371, 1125
Scannapieco C., Tissera P. B., White S. D. M., Springel V., 2008, MNRAS, 389, 1137
Scannapieco C., White S. D. M., Springel V., Tissera P. B., 2009, MNRAS, 396, 696
Scannapieco C., Gadotti D. A., Jonsson P., White S. D. M., 2010, MNRAS, 407, L41
Scannapieco C., White S. D. M., Springel V., Tissera P. B., 2011, MNRAS, 417, 154
Springel V., 2005, MNRAS, 364, 1105
Springel V., Yoshida N., White S. D. M., 2001, New Astronomy, 6, 79 Thielemann F., Nomoto K., Hashimoto M., 1993, in Prantzos N.,
Vangioni-Flam E., Casse M. eds, Origin and Evolution of the Elements. Cambridge Univ. Press, Cambridge, p. 297
Tissera P. B., Dominguez-Tenreiro R., 1998, MNRAS, 297, 177 Tissera P. B., Scannapieco C., 2014, MNRAS, 445, L21
Tissera P. B., White S. D. M., Scannapieco C., 2012, MNRAS, 420, 255 Tissera P. B., Scannapieco C., Beers T. C., Carollo D., 2013, MNRAS, 432,
3391
Tissera P. B., Beers T. C., Carollo D., Scannapieco C., 2014, MNRAS, 439, 3128
White S. D. M., Rees M. J., 1978, MNRAS, 183, 341 Woosley S. E., Weaver T. A., 1995, ApJS, 101, 181 Zoccali M. et al., 2006, A&A, 457, L1
Zoccali M., Hill V., Lecureur A., Barbuy B., Renzini A., Minniti D., G´omez A., Ortolani S., 2008, A&A, 486, 177
Zoccali M. et al., 2017, A&A, 599, A12
Zolotov A., Willman B., Brooks A. M., Governato F., Brook C. B., Hogg D. W., Quinn T., Stinson G., 2009, ApJ, 702, 1058
This paper has been typeset from a TEX/LATEX file prepared by the author.

![Figure 6. Mass-weighted distribution of [Fe/H] for old stars (blue lines) and old, accreted stars (magenta lines) in the central region of the four analysed Aquarius haloes (right-hand panels)](https://thumb-us.123doks.com/thumbv2/123dok_es/3781130.647089/7.892.96.801.83.263/figure-weighted-distribution-accreted-magenta-central-analysed-aquarius.webp)


![Figure 10. Galactocentric rotational velocities (V GC ) and velocity disper- disper-sions ( σ GC ) for the stellar populations in the central spheroid region of the analysed Aq-C-5 halo, selected according to [Fe/H] < −1.1 (right-hand column) and age &g](https://thumb-us.123doks.com/thumbv2/123dok_es/3781130.647089/10.892.69.429.87.597/galactocentric-rotational-velocities-velocity-populations-spheroid-analysed-according.webp)
