Public Sector Reform in Spain:
Views and Experiences from Senior Executives
Country Report as part of the COCOPS Research Project
José M. Alonso
Judith Clifton
May 2013
About COCOPS
The COCOPS project (Coordinating for Cohesion in the Public Sector of the Future) seeks to comparatively and quantitatively assess the impact of New Public Management-style reforms in European countries, drawing on a team of European public administration scholars from 11 universities in 10 countries. It analyses the impact of reforms in public management and public services that address citizens’ service needs and social cohesion in Europe. Evaluating the extent and consequences of NPM’s alleged fragmenting tendencies and the resulting need for coordination is a key part of assessing these impacts. It is funded under the European Union’s 7th Framework Programme as a Small or Medium-Scale Focused Research Project (2011-2014).
About the Authors
Professor Judith Clifton is Senior Lecturer at the Department of Economics, University of Cantabria. Jose M. Alonso is Researcher and PhD candidate in Economics at the University of Cantabria.
The research leading to these results has received funding from the European Union’s Seventh Framework Programme under grant agreement No. 266887 (Project COCOPS), Socio-economic Sciences & Humanities.
1. Introduction
1Coordinating for Cohesion in the Public Sector of the Future (COCOPS), as one of the largest comparative public management research projects in Europe, intends to provide a comprehensive picture of the challenges facing the public sector in European countries and to systematically explore the impact of New Public Management (NPM)-style reforms in Europe. The project brings together public administration scholars from eleven universities in ten countries2 and is funded as part of the European Union’s 7th Framework Programme between January 2011 and June 2014.3 The research is comparative and evidence-based, drawing on both existing data and innovative new quantitative and qualitative data collection, at both national and policy sector levels. A cornerstone of the project is the COCOPS Executive Survey on Public Sector Reform in Europe: an original, large-scale survey of public sector top executives in ten European countries, exploring executives’ opinions and experiences with regards to public sector reforms in general government, as well as more particularly in the health and employment policy sectors.
Scholars within the public administration discipline have long underlined the need for more quantitative and rigorous comparative research, going beyond single-country and single-organization approaches (see Derlien 1992; Fitzpatrick et al 2011; Pollitt 2011; Raadschelders and Lee 2011). Moreover, few research initiatives have explored in depth the transformation of public administrations as triggered by NPM reform discourses in a systematic comparative form (Van de Walle and Hammerschmid 2011). Responding to such concerns, this survey offers systematic evidence regarding the dynamics of public administration reform in Europe, with the goal to create an encompassing and systematic picture of public administration after more than two decades of NPM reforms.
From a theoretical perspective the survey builds on the perception of three major reform paradigms (New Public Management, Public Governance and the Neo-Weberian State) as described by Pollitt and Bouckaert (2011). Focusing on top executives, it follows pioneering elite studies such as those of Aberbach, Putnam and Rockman (see Putnam 1976, Aberbach et al. 1981, and Aberbach and Rockman 2006), which lay the foundation for many other both national and cross-national executive surveys (e.g. Mayntz and Derlien 1988; Christensen and Laegreid 2007; Bertelli et al. 2007; Trondal 2010; Bauer et al. 2009; COBRA survey; UDITE survey).
Methodologically it also draws inspiration from cross-national population surveys such as the European Social Science Survey, European Values Survey, the International Social Survey Program; as well as from experiences with cross-national surveys such as those of the Survey Research Centre at the University of Michigan (2010).
As set out by the project's terms of reference the goal of this large-scale survey is to analyse national administrations (both ministries and agencies) in the participating countries and also to take a closer look at the policy fields employment and health. The survey aims to explore public sector executives´ perceptions, experiences and opinions with regards to their work context and administrative
1
This introduction is based on Hammeschmid, Görnitz, Oprisor and Stimac (2013), and appears in the same form in all WP3 COCOPS country reports.
2
Erasmus University Rotterdam, Hertie School of Governance Berlin, University of Bergen, Bocconi University, University of Cantabria, Cardiff University, CNRS Paris, Corvinus University Budapest, University of Exeter, KU Leuven, Tallinn University of Technology
3
reforms, but also on other factors such as values and identities and the impact of the fiscal crisis. The core survey implemented in all participating countries consists of 31 questions structured in four parts (I) General information; (II) Management and Work Practice of Your Organization; (III) Public Sector Reform and the Fiscal Crisis; (IV) Attitudes, Preferences and Personal Information. The survey is a result of the joint work of all the national research teams within the COCOPS project and under the leadership of a team of researchers at the Hertie School of Governance in Berlin. In addition, further universities from other European countries were included as strategic partners to replicate the survey in these countries.4
Three essential challenges connected to the design of the questionnaire and the survey methodology had to be handled by the research team: a sample design that would allow systematic comparative analyses; an access strategy to produce (statistically sufficient) high response rates; and a questionnaire design and translation that would assure conceptual equivalence between all countries. As a general principle, the survey team opted for a balanced and pragmatic approach with a view on a maximum of quality and comparability, while still allowing for sufficient flexibility within each country’s context. A core questionnaire developed by the survey team in English was translated into country-specific versions by the respective national research teams and – if assumed helpful – optional questions were added. With regards to the population definition, the research team targeted a group with relevant experience to assess overall developments and trends both on an organizational and policy field level. In general, top executives are viewed as such informants regarding the state of administration, given their privileged vantage point (Walker and Enticott 2004), but also, with the blurring of the classical boundaries between politicians and civil servants (Aberbach et al. 1981), due to their own role in policy-making and their influence on the choice and implementation of reforms (Christensen and Lægreid 1999; Ridder et al. 2006). A major critique raised against elite surveys however (see in particular Enticott et al. 2008) is that they usually focus on a limited selection of individuals at the top of the organization. As these individuals are relatively disconnected from processes at lower levels in the organizations, and also due to issues of desirability, such an approach is bound to provide a biased image of the respective organization(s). These are important points to take into consideration when interpreting the results.
In order to avoid random sampling and issues of representativeness, the COCOPS executive survey is based on a full census of all central government ministries and agencies. It covers all high level public sector executives who in their respective positions can be expected to be involved in public administration reform processes. A core set of binding sample principles, based on a detailed mapping of national administrative structures, was followed by all teams in all central government areas and especially in the case of employment and health. Deviations were only allowed if precise equivalence could not be established due to the specificity of administrative structures. Local government and service delivery levels were excluded for the purpose of this survey. Generally, within all central government ministries and subordinated agencies the two top-administrative levels were addressed; in some cases invitations were also sent to executives on the third level if, due to their policy relevance, this was deemed appropriate. State-owned enterprises and audit courts were not included due to their different task repertoire. In the fields of employment and health, as special
4 The Vienna University of Economics and Business for Austria, the Kaunas University of Technology for
Lithuania, the Technical University of Lisbon for Portugal, Copenhagen Business School, the Belgrade Fund for Political Excellence for Serbia and the University of Bern for Switzerland
focus areas, regional and state government ministries and agencies were also included if relevant – without addressing however direct service delivery levels (e.g. hospitals, job centers).
Moreover, the survey explicitly covers different units of analysis (see Pollitt 2011: 121, on units of analysis in comparative public administration research) to allow for multi-level analyses: policy field, organization and individual experiences of the respondent. These are explored through the (self)perceptions of public sector executives, acknowledged in research as the closest channel into objective processes and developments within public organizations and, at least in the absence of stringent limitations, as reliable predictors of administrative behaviour (see Aberbach et al. 1981; Bauer et al. 2009).
The survey was implemented online, with standardized webpages being built in the national language(s) for each country. Flexibility was allowed, and even recommended, in the data collection strategies used by national teams, due to major differences in administrative cultures between the countries. A major emphasis was put on a thorough data cleaning and harmonization at the end of the survey, to make sure that final results were comparable across countries and that any deviations allowed during the implementation process were explained and controlled.5
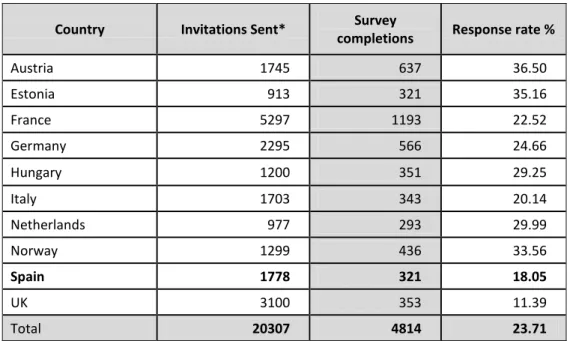
The survey was launched in May 2012 and implemented in two rounds (May-July 2012, and September-November 2012). In these two rounds combined, the survey was sent out to over 20.000 high ranking civil servants in the ten participating countries via post and email (using either a personalized access link or an anonymous one), depending on each country´s predefined access strategy. Invitations were followed by reminders and, in cases where response rates were low, teams took additional measures, such as phone or postal reminders, to increase the number of survey participants. In the beginning of November 2012, all surveys were closed, and all datasets were cleaned, checked and harmonized according to a standardised procedure for all countries.
Table 1. Number of invitations and response rates of the COCOPS survey (by end of December 2012)
Country Invitations Sent* Survey
completions Response rate %
Austria 1745 637 36.50 Estonia 913 321 35.16 France 5297 1193 22.52 Germany 2295 566 24.66 Hungary 1200 351 29.25 Italy 1703 343 20.14 Netherlands 977 293 29.99 Norway 1299 436 33.56 Spain 1778 321 18.05 UK 3100 353 11.39 Total 20307 4814 23.71
*The invitations sent represent the final number of invitations that has reached respondents, after the exclusion of any failure deliveries, wrong addresses etc.
5
The details of the survey design and implementation process can be found in the survey Research Report (see Hammerschmid, Oprisor, Stimac, 2013).
By the end of 2012 there were 4814 valid answers available from ten participating countries
and an overall response rate of 23.7% (for details see Table 1). These answers are the basis
for the respective country reports. The data in both the national and the integrated datasets
are subject to strict anonymity regulations, to protect individual respondents, whereas
aggregate data will be published according to a set of rules commonly agreed upon by the
research teams involved.
The current country report summarizes the findings for Spain, along with some comparisons with the results from all the surveys carried out in Austria, Estonia, France, Germany, Hungary, Italy, Netherlands, Norway, Spain and the UK.
2. Context and Status Quo of Public Administration Reform in Spain
Throughout the period covering the transition to democracy to the present, the Spanish public sector has undergone major changes and reforms, in some cases resulting from the aim to change the
Francoist public administration model and, in other cases, with the main goal of public administration
modernization (Prats, 2010). For the following brief summary of the Spanish public sector reforms, we rely mainly on Alba and Navarro (2011), Sevilla et al (2010), Ongaro (2009) and Parrado (2008).
In the past 30 years, Spain has undergone a deep process of public administration reforms. The first period corresponds to the late 1970s, when Spain began a series of reforms with the aim of changing the highly bureaucratized public administration and, in order to build a new relationship with its citizens, trying to change the traditional inaccessibility of centralized national bureaucracies. At this time, an important process of reform of the administrative red tape was introduced, focusing on the reform of the organization of ministerial and administrative bodies, a legacy of the Francoism. In general, and with slight changes, the current governance structure is virtually identical to that established at this stage of the transition to democracy.
In the 1980s and mid 1990s, the main measures of administrative reform focused on the decentralization process with the creation and operation of regional governments and the establishment of the basic regulation of local governments. Surprisingly, the traditional Napoleonic model was reproduced by the new regions, as well as developing its own bureaucratic system. At the same time, a profound reform of the legislation relating to public servants took place, to give answer to the new demands of a democratic administration and to eliminate some perceived pathologies of a closed model with roots in the Francoist administration.
In the 1990s the concept of “reform” changed to the concept of “modernization”, whose focus would be to improve administration-citizen relations. The 1988 Spanish edition of the OECD document The
administration as service: The public as client, served as a starting point — to some extent — for new
lines of public sector reform. A new vision of ”managing” staff began, in line with what had already happened in other European countries, based on the idea that citizens were increasingly treated as consumers, or users of the services of the Administration, in line with the NPM concept.
In 1989, the Ministry of Public Administration began a process of internal debate about public management modernization through the elaboration of the "Delphi Study on modernization of operating procedures in public administration." As a result of this process in 1992 the Plan for Modernization of the Central Government was approved.
With these reforms the government intended that concepts such as efficiency, quality and effectiveness were to become priority values of administrative action. This reform process tried to improve and simplify administrative procedures, the use of ICTs and the concern about the recruitment and training of public managers, among other issues. From a practical standpoint, this modernization process provided some necessary elements to address posterior administrative reform actions and had — to some extent — a clear political impulse and leadership.
However, the implementation of the Plan for Modernization of the Spanish public administration did not respond to the high expectations of change, because of, at least partially, the resistance from the public servants elites to confront the profound changes of the organizational model, through the adoption of NPM-related mechanisms, such as management by objectives, management autonomy, results orientation, etc.
At a later stage6 and, with the consolidation of the autonomous communities — with transfers in education and health and the promotion of the Local Agreement (the so-called "second decentralization") — the actions in the reform and modernization have focused on five strategies: (1) To set up a flexible, agile and efficient organizational structure; (2) To reform the administrative courts; (3) To establish a new regulatory framework for human resources; (4) To promote efficiency and quality in service delivery; and (5) To incorporate new technologies inside public administration.
In addition to these specific measures, a Committee of Experts was constituted in April 2003, constituted of professors and senior officials, to advance public sector modernization. Finally, in 2005 the Spanish government approved the National Reform Program based on the Lisbon Strategy, including measures that, even if they were economic policies in its broadest sense, has been the basis for many administrative reforms in the last 7 years as, for example, the development of the Law of State Agencies, which was considered one of the key element in the attempt to modernize the Spanish Public Administration. Following Alba and Navarro (2011), the new law of State Agencies has the following focus: (1) transparency of public services; (2) to implement NPM-related policies such
as managing by results; (3) to improve policy design within agencies; (4) to favor cooperation and collaboration among different bodies; and (5) to promote the evaluation of public services.
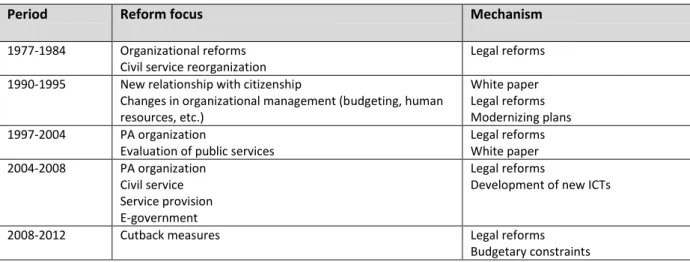
From 2008 onwards — as a result of the ongoing financial and economic crises — reforms were mainly driven by budgetary pressures. The main reform actions taken by the Spanish Government over the past years were mainly austerity measures in order to cope with the concurrent problems of lower revenues and higher public debt.
Table 2. Spanish key administrative reforms
Period Reform focus Mechanism
1977-1984 Organizational reforms Civil service reorganization
Legal reforms 1990-1995 New relationship with citizenship
Changes in organizational management (budgeting, human resources, etc.)
White paper Legal reforms Modernizing plans 1997-2004 PA organization
Evaluation of public services
Legal reforms White paper 2004-2008 PA organization Civil service Service provision E-government Legal reforms
Development of new ICTs
2008-2012 Cutback measures Legal reforms
Budgetary constraints Based on Alba and Navarro (2011)
3. Data and Method
3.1 Sampling and Access Strategy and Survey Implementation
The Spanish COCOPS survey was conducted by a team of researchers at the Department of Economics, University of Cantabria. In keeping with the survey’s general sampling principles and population definition, the Spanish sample represents almost the full census, with the exception of Health services because of lack of contact data.
In line with the sampling strategy the survey invitations were sent to the first three — and in some cases four — levels of public sector executives in all regional government ministries, the Central Government and agencies directly subordinated to central government ministries.
As regards central government, firstly we addressed the mentioned three hierarchical levels in ministries and agencies; State Secretaries7, General Secretaries and General Directorates (departmental heads) of each ministry. However, due to the lack of responses we addressed the second round of the survey to the next hierarchical level, that is, general sub- directorates, which are in charge of policy implementing and should be free of political interference. For the employment sector, we addressed the aforementioned three hierarchical levels of the Central Ministry of Labor and regional ministries of labor, plus directors of the 50 provincial SEPE 8 offices, and directors of the 17 regional employment services. Similarly, for the health sector we addressed three hierarchical levels of the Central Ministry of health and regional ministries, including 13 of the 17 regional health services. The main issue with regional health services was we did not get contact data for 4 of them.
With regards to access, for Spain an e-mail distribution seemed the best option to achieve high response rates. However, because of the difficulty of getting personal email addresses of many of the components of the sample, we decided to complement the distribution via e-mail with postal letters in cases where the e-mail distribution was not possible. The invitations were therefore sent by e-mail and regular post, including a link to the survey webpage and instructions on how to fill in the answers: either directly online –using the Spanish webpage –or by returning the filled in questionnaire received via post, fax or email. A PDF version of the questionnaire was also available on the survey webpage for download.
The Spanish survey was kept quite close to the core questionnaire, with only three optional question added. These questions were added to get additional information about the cutback measures addressed by the Spanish Government and, to assess the influence of international and supranational organizations — such as the IMF, the OECD or the EU — on the reform process.
The first round of email and postal invitations for the Spanish survey were distributed to respondents 4-5 June 2012, with the deadline of 29th June. Email reminders were sent 19th June before the deadline on 29th June. Initial invitations were sent to 451 contacts from the three sectors analyzed, due to lack of contact data. Three months before launching the survey the whole government in Spain was changed and most of the contact details from practitioners were removed from the websites as the government underwent reorganization. Though new staff was recruited, unfortunately the new policy of the incoming PP government was to not list the emails of most
7 States Secretaries were only included in the case of financial, employment and health services due to their relevance for the survey.
government representatives online. Fortunately, through an update of a top public servants database, we got access to the names and postal addresses of almost all the target population. Thanks to this database and through phone calls and contacts with different public administration departments we increased the sample in 1327 people, to which the survey was sent in a second round on September 12th, with the deadline of 10th October. Again, email remainders were sent 24th September to the second subsample, summing up a total of 1778 invitations after the two rounds.
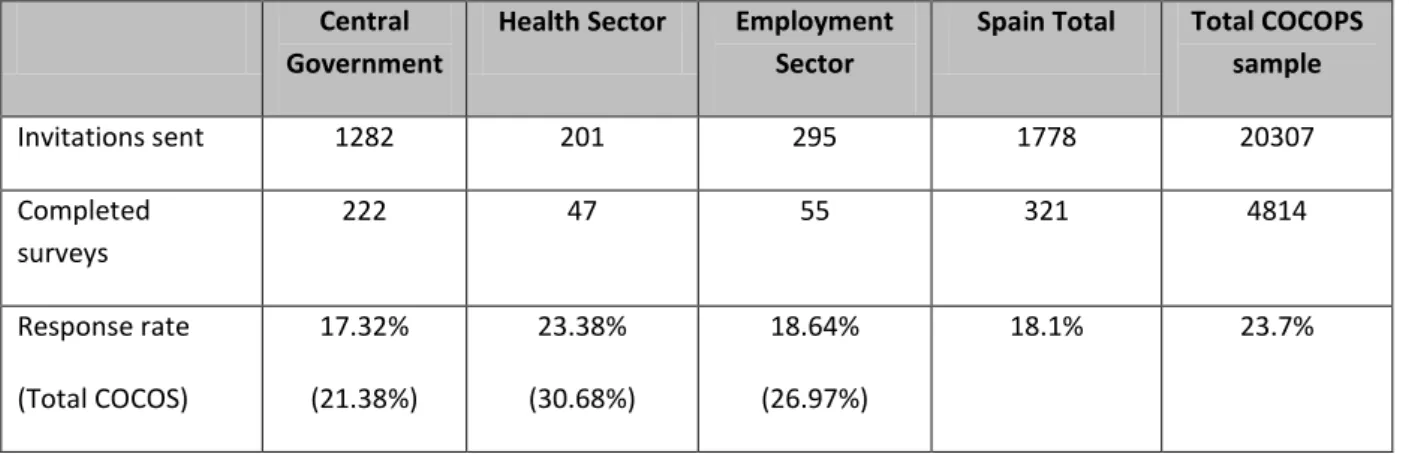
Overall, a total of 1778 invitations were sent out: 1282 to central government executives, 201 to health sector executives, and 295 to executives in the employment sector. In total the survey received 321 partially or fully filled out answers, which leads to an overall response rate of around 18.1%, as shown in Table 2 below. Total response rates in the Spanish case, as well as those at central government level are relatively lower than those from the overall COCOPS survey (18.1% Spain vs. 23.7% in overall COCOPS sample). For the health sector the Spanish response rate is again relatively lower (23.4% vs. 30.7%) like for the employment sector (18.6% vs. 26.9%).
Table 3. Sample size and response rates
Central Government
Health Sector Employment
Sector
Spain Total Total COCOPS sample Invitations sent 1282 201 295 1778 20307 Completed surveys 222 47 55 321 4814 Response rate (Total COCOS) 17.32% (21.38%) 23.38% (30.68%) 18.64% (26.97%) 18.1% 23.7%
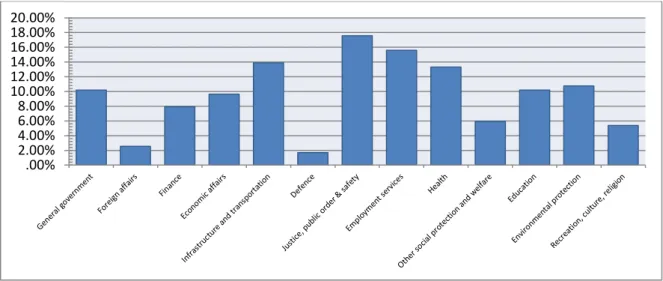
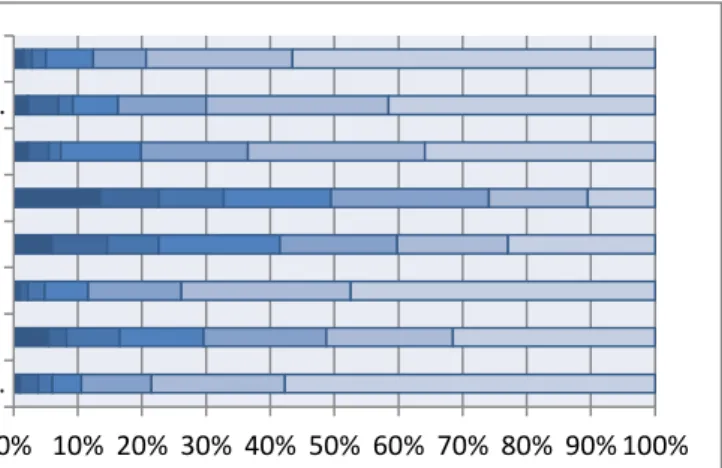
Looking at the survey results and their distribution across policy fields (see Figure 1 – please note that respondents were allowed to select more than one option), we can see how a considerable share of responses comes from the areas of justice, public order and safety (17.6%), employment services (15.6%), infrastructure and transportation (13.9%) and health (13.3%). The lowest response rates are found in the fields of defense (1.7%) and foreign affairs (2.5%), indicating a somewhat more closed administrative culture in these two areas.
Figure 1. Policy field sample shares
Unless otherwise indicated, the following categories are used to interpret the results: if a scale ranging from 1 to 7 is used, 1 meaning ‘Strongly disagree’ and 7 meaning ‘Strongly agree’, the percentage shares for scale numbers 1 and 2 (vs. 6 and 7) are added and interpreted as ’disagree’ (vs. ‘agree’).
3.2 Organizational Context of Respondents
Before exploring respondents' opinions and attitudes towards their role and work in public administration, here we establish some of the key contextual features that set the organizational and personal background of the respondents as described in chapters 4 to 8.
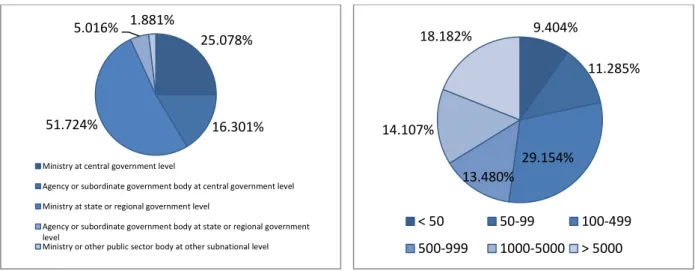
Organization type (see Figure 2). Among the respondents, the greatest share (51.72%) come from
ministries at the regional level (Comunidad Autónoma); this in line with the relative share of invitations sent to regional level executives (62.77%) and with the overall population since, in Spain, almost 80% of public servants work for sub-central government levels (OECD, 2011). 25.08 % of respondents work at the central ministry level, while only a 16.3% work for agencies or subordinate government body at the central government level (vs. 32.4% for the overall COCOPS sample), which may be explained by the relatively small number of agencies existing in Spain. The share of answers coming from executives at the state level agencies is even lower (5.02%) and from levels beyond state government the response share was only a small 1.88% of total responses.
Organization size (see Figure 2). Almost 50% of respondents work in organizations with up to 500
employees, similar to the overall COCOPS sample (where 50.9% come from such organizations). Another 27.6% work in larger organizations of 500-5000 employees (vs. 32.2% in the overall COCOPS
.00% 2.00% 4.00% 6.00% 8.00% 10.00% 12.00% 14.00% 16.00% 18.00% 20.00%
sample). Finally, around 18.8% of respondents come from organizations with over 5000 employees (vs. 16.9% in the overall COCOPS sample).
Figure 2. Organization type and size shares
3.2 Socio-demographic Background of Respondents
Gender (see Figure 3). Over two thirds of respondents are men (67.88%), and only 32.12% are
women, a share which shows how, despite the efforts of the former socialist government to promote gender equality, there is still a long way to go to promote gender equality in the Spanish Public Administration. By comparison, Spain is in line with the overall COCOPS sample, in which over a third (32.1%) of the respondents are women.
Age (see Figure 3). 72.31% of respondents are of an age between 36-55 years (vs. 61.6% in the
overall COCOPS sample), with another 20.86% being aged between 56-65 years. 5% of the Spanish respondents are under 35, in line with the 5.8% in the overall COCOPS sample.
Hierarchical level (see Figure 3). With regard to their position in the hierarchy most respondents
(51.4%) are executives at the third hierarchical level (General directorates and sub-directorates or similar). Over a third of the respondents (39.88.1%) are at the second level, and the remaining 8.72% are at the top hierarchical level. The overall COCOPS sample has a higher share of respondents from the first level (24.2%), more or less the same answers from the second level (40.4%) and considerably lower from other hierarchical levels (35.4%).
25.078%
16.301% 51.724%
5.016% 1.881%
Ministry at central government level
Agency or subordinate government body at central government level Ministry at state or regional government level
Agency or subordinate government body at state or regional government level
Ministry or other public sector body at other subnational level
9.404% 11.285% 29.154% 13.480% 14.107% 18.182% < 50 50-99 100-499 500-999 1000-5000 > 5000
Figure 3. Socio-demographic shares (f.l.t.r.) Gender, Age, Hierarchy in organization, Educational background
Education (see Figure 3). Almost two thirds of all respondents (61.25%) have a university degree only
at Bachelor level. The shares of top executives with university degrees at Master (25.46%) or PhD level (13.28%) are considerably lower than the COCOPS sample (68.8% and 15.5%), which may reflect a below average education level of Spanish public sector executives.
As to the disciplinary field of education (see Figure 4), the highest percentage of respondents still comes from the field of law (34.6%), which may reflect the legalistic tradition of the Spanish Napoleonic administrative culture. In the late 1980s the Spanish Government attempted to break with the long legalistic tradition by introducing new management practices (Alba and Navarro, 2011), which may be reflected by the fact that the second education field from respondents was business, management and economics (23.4%). However, despite the changes made in the Spanish public administration towards its modernization, the legal profession is still the majority among top public executives. Other fields represented in the Spanish sample were natural sciences and engineering (18.5%), other social sciences and humanities (12.2%), political science and public administration (9.4%), or medical science (4.5%). 67.883% 32.117% Male Female 5.036% 30.216% 42.086% 20.863% 1.799% 35 or less 36-45 46-55 56-65 66 or older 8.723% 39.875% 51.402%
Top hierarchical level in organisation Second hierarchical level in organisation Third hierarchical level in organisation
61.255% 25.461%
13.284%
Graduate degree (BA level) Postgraduate degree (MA level) PhD/doctoral degree
Figure 4. Educational fields (respondents could check more than one field)
Tenure (see Figure 5).The results related to the respondents´ tenure and sector experiences show
many characteristics of the Spanish public administration, such as life-long careers in the civil service and lack of experience on the private sector. A share of 65.9% of the respondents has worked in the public sector for more than twenty years (vs. 58.2% in the overall COCOPS sample, and only 4.9% have a public sector experience of less than five years (vs. 13.8% in the overall COCOPS sample). A share of 52.2% of respondents have been working in the current organization for more than 10 years, but only a 11.6% declared to work in the same position for more than 10 years (vs. a 16.0% for the COCOPS sample), which may indicate a rather low mobility within the sector but, a higher degree of mobility within positions.
When looking at the respondents’ experience outside the public sector, we see that over a quarter of public sector executives have little private sector experience, with 25.9% of the respondents having no previous private sector experience and a 56% with less than five years experience. Previous experience in the non-profit sector is not common in Spain, with 71.4% of respondents declaring no experience in the non-profit sector (considerably higher to 55.9% in the overall COCOPS sample.
Figure 5. Tenure of respondents .00% 5.00% 10.00% 15.00% 20.00% 25.00% 30.00% 35.00% 40.00% Law Business/ management/ economics Political science/ public administration Other social sciences and humanities
Medical science Natural sciences and engineering
0% 10% 20% 30% 40% 50% 60% 70% 80% 90% 100% …in the public sector
…in your current organisation …in your current position …in the private sector …in the non-profit sector
4. Values and Attitudes of Public Sector Executives
After describing the respondents with regard to their organizational and socio-demographic background, the following section will present some data on how public sector executives in Spain perceive their role as executives, their motivation and social values and preferences.
Identity and role perception as executive (see Figure 6). When asked about their self-understanding
as public sector executives, a majority of the respondents confirms ensuring an efficient use of resources (79.4.%), ensuring impartial implementation of law and rules (78.5%) and achieving results (73.9%), finding joint solutions to solve problems of public concern (70%) and providing expertise and technical knowledge (63.5%) as central for their role. Other aspects such as getting public organizations to work together (51.3%) and providing a voice for societal interests (40.2%) are also strongly anchored but to a much lesser degree. Interestingly, only a 25.9% agree on developing new public agendas as part of their role as executives, which may indicate the low degree of autonomy of Spanish executives.
Figure 6. Identity and self-understanding (Q: I mainly understand my role as public executive as)
Value preferences for public sector priorities (see Figure 7). In another question the survey asked for more general preferences with regard to public sector priorities based on polarizing options. With regard to values, we do not find clear preferences between traditional civil service and new managerial views. However, we see values such as citizen orientation over customer orientation (agreement 52.3% vs. 10.5% disagreement), state provision of public services over market provision (35.5% agrees with state provision vs. a 14.4% which prefers market provision), equity over efficiency (26.7% vs. 18.1%) and tax financed services over user fees (26.4% vs. 18.1%), which may indicate some degree of preference for traditional public service delivery. On the other side a substantial
0% 10% 20% 30% 40% 50% 60% 70% 80% 90% 100% Ensuring impartial implementation of laws and…
Getting public organisations to work together Achieving results Providing a voice for societal interests
Developing new policy agendas Providing expertise and technical knowledge Finding joint solutions to solve problems of…
Ensuring efficient use of resources
share of respondents shows a positive assessment of efficiency (23.5%) vs. quality (14.1%) of public service delivery, which seems a bit contradictory with other responses.
Figure 7. Priorities as public servants (Q: Public services often need to balance different priorities. Where would you place
your own position?)
Motivation (see Figure 8). As regards public sector motivation and, following the common distinction
of extrinsic, altruistic and intrinsic motivation, our results confirm a clear prevalence of intrinsic and altruistic motivations among Spanish public sector executives. The greatest importance is given to interesting work (88.9% agreement vs. 0.7% disagreement) followed by doing something useful for society (76.7% vs. 0.4%) and opportunities to help other people (62.8% vs. 1.1%). However, there is also one extrinsic factor such as job security (60.9%) of special relevance for Spanish public servants. Other extrinsic factors do not seem as relevant as those mentioned, such as good opportunities for promotion (49.3%), high income (47.7%), flexible working hours (31.9%) and social status (18.8%).
Figure 8. Motivation (Q: How important do you personally think it is in a job to have)
0% 10% 20% 30% 40% 50% 60% 70% 80% 90% 100% Quality - Efficiency
Equity - Efficiency Following rules - Achieving results Customer focus - Citizen orientation State provision - Market provision Tax financed services - User charges / fees
0% 10% 20% 30% 40% 50% 60% 70% 80% 90% 100% Interesting work
High income Opportunities to help other people Job security Room to make decisions Good opportunities for promotion Doing something that is useful to society Flexible working hours Status
5. Characteristics of the Work Context in Public Administration
The success of introducing management practices like performance management to the public sector depends on the extent to which the specific work context in public administration resonates with the logic behind the NPM paradigm. This chapter analyses how Spanish top civil servants perceive their work context and evaluates to what extent the results indicate that management practices can be transferred successfully to Public Administration.
Performance management and result-orientation is difficult to implement if goals are perceived to be ambiguous and activities are less measureable and easy to observe (Rainey and Jung 2010). To reliably measure performance, goals would have to be limited, clearly stated and communicated, and activities would have to be easily observed and monitored. When asked about these characteristics of their work context (see Figure 9), there appears to be a high degree of discrepancy among Spanish public sector executives about the possibility of observing and measuring their organization’s activities: 27.4% of respondents agree that their activities can be observed and measured easily, while 25.2% disagree. Similarly, a 28.6% of the respondents agree that their organization has a high number of goals, while a 22.0% perceive their number of goals to be rather limited.
It seems that respondents agree that organization goals are clearly stated (50.5%), while only 10.9% disagree with that statement. However, transparency does not seem to be one of the “strong” points in Spanish Public Administration; 35.3% of the respondents report that their goals are clearly communicated to all staff, while a relatively high 23.4% believe that this is not the case.
Public executives from the overall COCOPS sample are more positive about the clear statement (77.6%) and, particularly about the clear communication of goals (73 % for the COCOPS sample vs. 35.3% for Spain)
Figure 9. Goal ambiguity (Q: To what extent do the following statements apply to your organization?)
0% 10% 20% 30% 40% 50% 60% 70% 80% 90% 100%
Our goals are clearly stated Our goals are communicated to all staff
We have a high number of goals It is easy to observe and measure our activities
Management autonomy is a further variable influencing the transferability of management practices
to the public sector. The less autonomy top executives enjoy in managing their organization, the less they can be made accountable for successes or failures. The results (see Figure 10) show that, in general, Spanish executives perceive they enjoy a very low degree of autonomy. Only a 17.7% of the respondents perceive a rather high degree of autonomy in choosing and designing policies which is a very low value compared with the overall COCOPS sample (40% of respondents perceived a rather high degree of autonomy), and a 27.5% concerning the implementation of policies (61.7 % internationally). Managerial autonomy is also lower as regards changes in the structure of their organization (12.6% think they have a lot of autonomy) and contracting out services (12.0% think they have a lot of autonomy). Autonomy in Human Resource decisions is extremely low in Spanish Public Administration, and the share of respondents who believe they have a high degree of autonomy, as regards promoting, hiring or removing personnel, is only between 4% and 6%. Finally, autonomy in allocating budget is also relatively low (only a 20.1% of respondents believe they have high autonomy about budget allocation).
Figure 10. Degree of management autonomy (Q: In my position, I have the following degree of autonomy with regard to)
Interaction frequency is a way to measure the coordination intensity of public sector executives and
also could be seen as an indicator for fragmentation challenges. If the different organizations that are relevant to provide public goods tend to work in a relatively isolated atmosphere and do not regularly work together, the public sector is characterized by a ‘silo culture’. The Spanish public sector — due to the decentralization process implemented over the last few decades — would be expected to be rather fragmented and our results tend to support this diagnosis (see Figure 11): not surprisingly, Spanish public sector executives interact most often with the actors within their own
0% 10% 20% 30% 40% 50% 60% 70% 80% 90% 100% Budget allocations
Contracting out services Promoting staff Hiring staff Dismissing or removing staff Changes in the structure of my organisation Policy choice and design Policy implementation
organization – 87.2% interact daily with their direct staff, 88.9% interact at least weekly with their administrative superiors and higher administrative levels and 74.0% interact weakly or daily with administrative units within their organizations. Interaction with subordinate agencies and bodies does not occur as often (only 54.4% have at least weekly contact) and interaction with their responsible minister is rather rare (18.2 have at least monthly contact). Among the outside actors, such as other government bodies, private sector, other government tiers and audit organizations, low levels of interaction take place in all the areas surveyed. Low levels of interaction take place also with international bodies, trade union representatives and European Union institutions.
A comparative perspective reveals significant lower degrees of Spanish top executives’ interaction with their minister, international bodies and European Union institutions.
Figure 11. Interaction frequency (Q: Please indicate how frequently you typically interact with the following actors or bodies)
In contrast to interaction frequency, coordination quality is a more qualitative than quantitative measure of fragmentation in public administration. Among those who answered (see Figure 12), only 16.1% perceive the collaboration between government bodies, private and voluntary sector stakeholders as good. Similar shares praise the collaboration between national and local/regional government bodies (17.7%) and between national government bodies within the same policy area (16.9%). Considerably lower shares are observed between national and supranational bodies or international organizations (6.2%) and between national government bodies from different policy areas (6.3%). It is of interest that other countries’ executives evaluate coordination quality much more favourably in all cases, particularly as regards collaboration between government bodies.
0% 10% 20% 30% 40% 50% 60% 70% 80% 90% 100%
My responsible Minister Other politicians My direct staff Subordinate agencies and bodies Administrative units within my organisation such as…
Other government departments outside my own… Local/regional government
Private sector companies Trade union representatives European Union institutions International bodies (e.g. IMF, OECD, ILO)
Media
In summary, and inline r with previous question results, public sector executives perceptions may indicate that in Spain there is a big coordination deficit and fragmentation is a major concern in Spanish public administration.
Figure 12. Coordination quality (Q: How would you characterize collaboration in your own policy field between)
The degree of politicization indicates to what extent public sector institutions can make decisions on
technical criteria or are subject to being influenced by political processes. In the Spanish sample, politicization does not seem to be present in routine activities; only 24.1% agree that politicians interfere in these (see Figure 13). However, only 27.1% of the senior executives feel that politicians respect their technical expertise and, interestingly, 76.3% of respondents agree that politicians regularly influence senior-level appointments, and reforms are more likely to be initiated by politicians than by senior executives (only 11.1% think that senior executives and not politicians initiate reforms or new policies). In addition, 35.1% of respondents agree that removing issues and activities from the realms of politics produces better policies (vs. 27.0% disagreeing).
A comparative perspective reveals the relatively high degree of politicization of the Spanish public administration. For example, 53.9 % of European respondents feel that politicians respect their technical expertise in comparison with 27.1% for the Spanish case. Also, the perception that politician regularly influence senior-level appointments is much higher in Spain than in the overall COCOPS sample.
These results take into account the perceived extensive politicization of Spanish public organizations. As described by Nieto (1996), the 1980s reforms generated a "spoil system" model, where the political party winning the election holds a leadership position in the public sector. As a result, it is common that leading political party members replace — or displace — experts and/or top-qualified public servants in the upper levels of the public administration. Due to the characteristics of the
0% 10% 20% 30% 40% 50% 60% 70% 80% 90%100% National government bodies within the same
policy area
National government bodies from different policy areas
National and local/regional government bodies National and supra-national bodies/international
organisations
Government bodies and private and voluntary sector stakeholders
Spanish university system, professorial posts can be “frozen” when scholars pass to politics. Thus it is common that Ministers are former university professors, and vice versa. This has perverse effects on the university as a department becomes heavily represented by Socialists when the conservative PP are in power, and vice versa!
Figure 13. Degree of politization (Q: What is your view on the following statements)
In sum, coordination deficits and fragmentation are clearly observable in the respondents´ answers and seem to be a major challenge, whereas lack of autonomy and politicization seem to be even a bigger concern for the Spanish respondents.
6. Relevance of NPM and post NPM Reforms
This chapter provides information on public sector executives’ perception of the implementation of NPM and post NPM reforms which are characterized by a stronger emphasis on coordination and networked forms of governance. The respondents have been asked to assess the type and character of reform trends in their policy field (6.1.), their organization (6.2.) and in their own work (6.3.).
6.1. Policy field level
Public sector reform trends can have very different characteristics. While classical NPM reforms include measures like performance management, contracting out, privatization or flexible employment, other reforms aim at enhancing transparency, citizen participation or reducing bureaucracy. With regard to the reform trends at the policy field level (see Figure 14) we see how some of NPM types of reform, such as privatization or agentification are of only limited relevance in Spain; 50% of the respondents state that privatization occurs rarely (vs. 15.7% who think that important privatization policies have been carried out), and 54.3% of respondents think that
0% 10% 20% 30% 40% 50% 60% 70% 80% 90%100% Politicians respect the technical expertise of
senior executives
Politicians regularly influence senior-level appointments in my organisation In my organisation politicians interfere in routine
activities
Senior executives and not politicians initiate reforms or new policies
Removing issues and activities from the realms of politics produces better policies
agentification occurs rarely (vs. 12.1% thinking the opposite). A third clearly NPM-related policy, such
as the use of contracting out, seems to have been carried out in Spain in a more systematic way; only a 31.7% of respondents state that contracting out polices occur rarely. These perceptions make sense because privatization is associated with the sale of public utilities and industrial firms, whilst outsourcing is a form of privatization more prevalent in the Public Administration sector. In addition, it seems that state provision is also not extended into new areas; only 8.6% of the respondents state that this happens to a large extent (percentage share for scale numbers 6 and 7). Moreover, the public sector is clearly subject to considerable downsizing; 52.4% of the respondents state that this occurs to a large extent making this the most prominent reform trend in Spain (together with digital e-government and transparency and open government). Other reform trends which have a moderately high prominence in Spain are cutting red tape (46.6%) and customer orientation (40.7%).
From an international comparative perspective, public sector executives from other countries perceived, in general, a much more frequent implementation of, particularly, flexible employment, agentification, customer orientation and citizens’ participation. While reform trend such as public sector downsizing and e-government initiatives seem to be in line with the overall COCOPS sample. Overall, the results may suggest the latecomer position of the Spanish public administration as regards public sector reforms.
Figure 14. Importance of reform trends (Q: How important are the following reform trends in your policy area?)
0% 10% 20% 30% 40% 50% 60% 70% 80% 90% 100%
Public sector downsizing Citizen participation methods/initiatives Creation of autonomous agencies or corporatization Contracting out Focusing on outcomes and results Extending state provision into new areas Treatment of service users as customers Collaboration and cooperation among different… Internal bureaucracy reduction / cutting red tape
Flexible employment Privatisation Digital or e-government External partnerships and strategic alliances Mergers of government organisations Transparency and open government
When asking for the dynamics of public sector reform (see Figure 15), we are interested in finding out how public sector executives evaluate the reforms that have been implemented. With regard to the overall assessment of the success of public administration reforms in Spain the overall picture is clear: 31.9% of the respondents perceive the reforms as not successful (scales 1-3), while only 10.8% of respondents is of the opinion that the reforms were successful (scales 8-10). As regards the consistency of the reforms, the results are rather mixed and equal. The same is true for the categories substantial vs. symbolic and demanding vs. not demanding enough. Turning now to the drivers and dynamics of the reforms the picture is again clear. Public sector reform in Spain seems to be implemented predominantly without public involvement (65.7% agreement), top-down (56.2%), driven by politicians (59.6%) and for the crisis (64.9%), and clearly contested by the unions (65.8%). In addition, reforms seem to be more about cost-cutting and savings (65.2% agreement) than about service improvement (10.5% agreement).
Figure 15. Dynamics of public sector reform (Q: Public sector reforms in my policy area tend to be)
6.2. Organizational level
From the survey results we see how management instruments have only a rather low relevance at the level of organizations. There is not any concept systematically implemented and used in the Spanish public administration (see Figure 16). The only instrument used by a relatively high share of the respondents is the use of service points to customers (43.2% of respondents agree). Extremely infrequent are performance related pay and risk management (71.4% and 60.0% of the Spanish respondents state that they do not use these kind of instruments). Instruments fostering management autonomy such as the decentralization of staffing decisions or financial decisions are uncommon as well (50.3% and 48.2% of respondents do not use them respectively). Other
0% 10% 20% 30% 40% 50% 60% 70% 80% 90%100% Top down - Bottom up
Consistent - Inconsistent Comprehensive- Partial Driven by politicians- Driven by senior executives
Crisis and incident driven- Planned Substantial - Symbolic Contested by unions - Supported by unions About cost-cutting & savings - About service… No public involvement - High public involvement
Unsuccessful - Successful Too demanding- Not demanding enough
managerial tools such as cost accounting systems and benchmarking do not seem to be used much, with 53.5% and 40.9% of respondents stating they do not rather use these instruments. With regard to codes of conduct and quality management systems, no clear patterns are observable here even their implementation and usage also seem to be limited.
Public sector executives in the overall COCOPS sample use these instruments to a much greater extent than Spanish executives, particularly as regards the use of performance appraisals, business/strategic planning, management by objectives, performance related pay and benchmarking. This clearly confirms our previous results about the low degree of implementation of managerial reforms in the Spanish public administration.
Figure 16. Relevance of different management instruments (Q: To what extent are the following instruments used in your organization?)
Regarding the use of performance management tools – with measurement and goals/targets as core elements – our results are shown in Figure 17. Neither goal achievements are rewarded nor non-achievement sanctioned. Politicians do not use indicators to monitor performance and only outcome orientation seems to be used to a certain —but relatively low — extent (23.1% of respondents agree about this, which is the highest share of the five items analyzed).
0% 10% 20% 30% 40% 50% 60% 70% 80% 90% 100% Business/strategic planning
Customer/ user surveys Service points for customers (e.g. one stop shops) Quality management systems
Codes of conduct Internal steering by contract Management by objectives and results Benchmarking Cost accounting systems Decentralisation of financial decisions Decentralisation of staffing decisions Performance related pay Staff appraisal talks / performance appraisal
Risk management
Figure 17. Relevance of performance management (Q: To what extent do the following statements apply to your organization?)
A question on the use of different coordination solutions (see Figure 18) tries to capture to what extent post NPM reforms in the form of new coordination mechanisms and measures to counter fragmentation have been implemented. As already observed in chapter 5, fragmentation and a hierarchical work culture are apparent in Spain. This is also supported by the current data. In the case of coordination problems, the most common action is to refer the issue upwards in the hierarchy (58.3% do this often) and only 24.7% of the respondents would decide on one lead organization. The other more post-NPM led proposals are quite unpopular among the Spanish executives; they would not set up a permanent special purpose body (68.0%), consult civil society organizations (62.3%), set up a cross-cutting working group (51.2%), set up a cross-cutting policy arrangement (47.3%) or consult relevant experts (45.7%).
Figure 18. Coordination solutions (Q: To resolve coordination problems when working with other organizations, we typically)
0% 10% 20% 30% 40% 50% 60% 70% 80% 90% 100% We mainly measure inputs and processes
We mainly measure outputs and outcomes We are rewarded for achieving our goals We face clear sanctions for not achieving our
goals
Politicians use indicators to monitor our performance
Thus, at the organizational and policy field level, we can say that Spanish executives do not perceive many public sector reform trends have been implemented in their policy field, and classical performance management reforms are weekly institutionalized on the organizational level. The next sub-chapter provides information on the use of performance indicators at the level of individual senior executives
6.3. Individual level
Enquiring on the use of performance indicators (see Figure 19) is to identify the fields of application where public sector executives are most likely to use performance indicators. We already know that these do not seem to be used extensively in Spanish public administration. This observation is not as clear for the individual level of public sector executives; the response rates are widely dispersed among the different response options (that is, between not at all and to a large extent), making it difficult to establish a clear pattern, so we cannot get clear conclusions about the use of performance indicators at an individual level.
7. Impact of the Fiscal Crisis on Public Administration
After a relatively long period of economic growth, with growth rates above the average of the EU economies, the first symptoms of the international financial crisis began to be visible in Spain in 2008, and at the same time the first effects of the crisis began to hit the Spanish economy, as a result of high financial exposure to the housing sector. The ongoing economic crisis resulted in a reduction of financial and economic activity, with a significant drop in GDP per capita, a significant increase in public debt and deficits, and a marked increase in the unemployment rate.
This significant worsening of socio-economic conditions was caused, to a great extent, by the outbreak of the international financial crisis in 2008, but also because of the intrinsic characteristics of the Spanish growth model, whose main pillars were the housing sector and an increasing domestic demand, combined with the high sensitivity of the Spanish economy to foreign demand. The current weakness of the Spanish economy made it especially vulnerable to the intensification of the sovereign debt crisis in August 2011 and its extension to several countries in the Euro area. Moreover, intensification of fiscal adjustment plans developed by the Government to meet the deficit target assumed by Spain in the Stability Programme, is having a clear contractive impact on investment and spending, both public and private.
As a result, the GDP per capita (in real terms) has fallen about 5% between 2008 and 2011, the unemployment rate has risen from 8.3% in 2007 to 21.7% in 2011, and 26.6% in November, 2012, being one of the highest unemployment rates in the EU (together with Greece). The Government deficit went from 1.9% surplus in 2007 to 8.5% deficit in 2011, with a maximum peak of 11.2% in 2009.
Given this situation — and following EU recommendations — the Spanish Government adopted a series of cutback measures to contain public debt and government deficit, which included freezing or reducing public employee wages and public employment offer, 20% reduction of organic structures of the General State Administration, plus Regional and Local Governments, cutting unemployment benefits, cuts in public investment in infrastructure and foreign aid, cutting expenditures in medicines, cuts in provision of basic public services, such as libraries and health clinics, among other cutback measures.
Given the drastic and largely non-consensual, cutback program conducted by the Spanish government in the last three years, it is not surprising that the COCOPS survey responses by Spanish executives assert as a general finding that most of the respondents have observed some kind of
cutbacks (see Figure 20). Over two thirds of respondents (64.77%) perceive that the Government performed targeted cuts according to priorities rather than across-the-board savings (24.2%). Interestingly, a very small percentage of respondents consider that saving strategies were focused on improving efficiency and productivity, which shows the low prevalence of managerial ideas within the Spanish public administration and, gives an idea of the short-term, reactive, nature of Spanish policy-makers.
Figure 20. Overall saving strategy (Q: In response to the fiscal crisis how would you describe the broader approach to realizing savings in your policy area?)
With regard to the more specific approaches to implementing cutbacks (see Figure 21) the survey clearly confirms that the leading cost-cutting measures have been the following: hiring freezes (79.2% agree), wage freezes (85.0%) and pay cuts (79.9%) — including bonuses —, cutbacks in existing programs (62.5%) and postponing or cancelling new programs (69.7%). In relation to offices reduction and increased user fees, we see how there is a large answer dispersion, which may suggest that the measures have not been implemented equally in all public administration areas. Finally, it seems that staff layoffs were not one of the major cost-cutting measures undertaken by the Government, mainly due to the special legal status of most of the public servants. Just over half of the survey participants (53.88%) stated that in their area this measure has not been taken at all (associated values 1 or 2), values mean being equal to 2.8, indicating the low incidence of this measure.
24.199%
3.559% 64.769%
7.473%
Proportional cuts across-the-board over all areas
Productivity and efficiency savings
Targeted cuts according to priorities
Figure 21. Cutback measures at organizational level (Q: In response to the fiscal crisis, to what extent has your organization applied the following cutback measures?)
8. Outcomes of Public Administration Performance
One main goal of the present study is to obtain systematic information on how public sector executives assess the impact of the various managerial reforms at organizational level but also other public sector reforms on a policy level. In this chapter, we present the results of such evaluative questions.
8.1 Overall
As concerns an overall assessment of public administration (see Figure 22), a relatively low share of respondents state that the way public administration is run in Spain has clearly improved (only 11.7% marked 8-10 on a 10 digit scale) over the last 5 years. 50.7% respondents rather assess it as more or less the same (marked 4-7), whereas a relatively high share of respondents observes a clear deterioration of public administration in Spain over the last 5 years (37.6% marked 1-3), which may be directly linked with the cutback program conducted by the Spanish government on the past two or three years.
Interestingly, the Spanish case is the only one in the whole COCOPS sample in which a greater number of respondents feel that the public administration performance has worsened in the last five years in relation to those who believe that the public administration performance has improved.
0% 10% 20% 30% 40% 50% 60% 70% 80% 90% 100% Staff layoffs
Hiring freezes Pay cuts Pay freezes Cuts to existing programmes Postponing or cancelling new programmes Downsizing back office functions Reducing front line presence Increased fees and user charges for users
Figure 22. Overall PA assessment (Q: Compared with five years ago, how would you say things have developed when it comes to the way public administration runs in your country?)
8.2 Policy Field
It may be misleading, however, to measure outcomes of public administration in such a one-dimensional way. We therefore provided the respondents with a more nuanced question addressing a spectrum of different performance dimensions as found in public management literature (see figure 23).
The most positive results can be found for ethical behavior among public servants, equal access to services and fair treatment of citizens (34.2%/37.5%/32.1% of respondents think that these dimensions improved), which is of great interest since equity should be a key performance dimension. Relatively positive results can be observed for service quality, transparency and openness, and innovation (26.3%/25.4%/24.4%).
However, we cannot observe such positive results for other key dimensions; one concern is that 58.7% of respondents state that citizens’ trust in Government has deteriorated (vs. only a 5% which state that trust improved). In addition, 30.6% of respondents believe that the public servants motivation towards work has deteriorated, and the same applies for attractiveness of the public sector as employer (29.8). A second — and major — concern is the vision that public executives have on the evolution of relevant dimensions such as social cohesion and citizen participation. A 33.3% believe that social cohesion has deteriorated, while 29.3% considered the same for the case of citizen participation. With regard to the other aspects such as cost and efficiency, policy effectiveness or cutting red tape, the assessments are rather diverse with similar shares of respondents observing improvements and deteriorations.
Again, the results for the overall COCOPS sample are remarkably different. Most of the different performance dimensions are perceived more positively in the overall sample, particularly as regards service quality, cost and efficiency, staff motivation and policy effectiveness. An exception of interest
0% 10% 20% 30% 40% 50% 60% 70% 80% 90% 100%
is the attractiveness of the public sector as an employer, which is perceived slightly more positively than the overall COCOPS sample. This fact may be explained by the different legal status of public servants in terms of labour relationships.
Figure 23. Different performance dimensions (Q: Thinking about your policy area over the last five years how would you rate the way public administration has performed on the following dimensions?)
As regards social capital and trust, Spanish executives assess nearly all aspects of social capital and trust as positive (See Figure 24). This is especially the case for their assessment of trustworthiness of their colleagues (50.7% assess this as positive) and open and honest communication (38.5%). Also overall positive, albeit to a lesser degree, is the assessment of all other dimensions (sharing same ambitions and vision, team spirit, mutual confidence, information sharing, constructive criticisms) with only three exceptions: a rather low share of respondents (17.7%) state that personnel on their organization share the same ambitions and vision for the organization; only 18.2% view themselves as partners in charting the organization’s direction (vs. 24.3% disagreeing), and 18.7% agree that they enthusiastically pursue collective goals and mission.
Figure 24. Social capital and trust (Q: People in my organization)
8.3 Individual Level
Similarly interesting is whether public administration reforms have a positive or negative impact on
job satisfaction at the individual level. The results confirm a relatively high level of job satisfaction
among Spanish executives (see Figure 25): 50.2% agree that they get a sense of satisfaction from their work (vs. 5.7% disagreeing). Also a relatively high share of 48.0% feels valued for the work they do, and interestingly, the lower positive share was observed when recommending their organization as a good place to work (40.5% agree vs. 10.1% disagree).
Figure 25. Job satisfaction (Q: When thinking about my work and the organization I work for)
0% 10% 20% 30% 40% 50% 60% 70% 80% 90% 100%
Engage in open and honest communication with one another Share and accept constructive criticisms without making it personal Willingly share information with one another Have confidence in one another Have a strong team spirit Are trustworthy Share the same ambitions and vision for the organisation Enthusiastically pursue collective goals and mission View themselves as partners in charting the organisation’s direction
Strongly disagree … … … Strongly agree
0% 10% 20% 30% 40% 50% 60% 70% 80% 90% 100% I get a sense of satisfaction from my work
I feel valued for the work I do I regularly feel overloaded or unable to cope I would recommend it as a good place to work