Methodology for the development of a new Sustainable
1
Infrastructure Rating System for Developing Countries
2
(SIRSDEC)
3
4
Jose Manuel Diaz-Sarachaga, Daniel Jato-Espino, Daniel Castro-Fresno*
5
6
GITECO Research Group, Universidad de Cantabria, Avd. de los Castros s/n, 39005 Santander, Spain
7
E-mail addresses: jose-manuel.diazs@alumnos.unican.es (J.M. Diaz-Sarachaga); daniel.jato@unican.es (D.
8
Jato-Espino); daniel.castro@unican.es (D. Castro-Fresno)
9
10
* Corresponding Author: Tel: +34 942 201550; Fax: +34 942 201703
11
12
Abstract
13
14
The improvement of infrastructures in developing countries has become a priority for the most advanced
15
economies, which have founded a broad range of international development organizations to undertake
16
infrastructure projects worldwide. Infrastructure is the key driver that can accelerate the balance among
17
the economic, social and environmental aspects forming the Triple Bottom Line (TBL) in these countries.
18
Given the lack of appropriate tools to ensure the achievement of this goal, this paper describes the
19
methodology conceived for the development of a Sustainable Infrastructure Rating System (SIRSDEC)
20
aimed at promoting the design, construction and operation of sustainable infrastructure projects in these
21
geographical areas. SIRSDEC is structured into a hierarchical decision-making tree consisting of three
22
levels of elements (requirements, criteria and indicators) selected to assess infrastructure systems
23
according to sustainability principles. The methodology on which SIRSDEC is based combines the
24
action of two multi-criteria decision-making methods (MCDM) such as the Analytical Hierarchy Process
25
(AHP) and the Integrated Value Model for Sustainable Assessment (MIVES). AHP is proposed to weight
26
the elements forming the decision-making tree after processing the opinions provided by a group of
27
international experts regarding the importance of requirements, criteria and indicators, whilst MIVES is
28
suggested to value infrastructure projects according to their contribution to the TBL. The article
29
emphasizes the added value provided by the combination of AHP and MIVES in the design of an
ad-30
hoc rating system aimed at fostering the implementation of sustainable infrastructure projects in
31
developing countries.32
33
Keywords
34
35
AHP; MCDM; MIVES; Rating System; Sustainable Infrastructure.
36
37
1. Introduction
38
39
The third of the 27 principles proclaimed in the final Declaration of Rio+20 United Nations Conference
40
on Sustainable Development held in June 2012 stated that the right to development must be fulfilled to
41
meet developmental and environmental needs of present and future generations. This principle
42
reaffirmed the key role of sustainability in contemporary society and promoted the urgent need for
43
developing effective frameworks to balance long-term economic, environmental and social aspects in
44
construction processes (UN, 1992).
45
46
A sustainability rating system can be defined as a set of best practices that evaluates sustainability
47
through the scoring of a series of indicators (Hart, 2006). Furthermore, this framework enables diverse
48
indicators measured in different units (e.g. pollutants/carbon emitted to atmosphere, renewable energy
49
used, recycled materials, energy consumption/conservation, ecosystem/biodiversity preservation,
culture heritage maintenance, etc.) to be integrated into a single analysis aimed at rating infrastructure
51
projects in terms of their contribution to sustainability.
52
53
Property industry was the pioneer in the development of sustainability rating systems for buildings in
54
advanced economies, such as Leadership in Energy and Environmental Design (LEED) in the U.S.
55
(USGBC, 2009), Building Research Establish Environmental Assessment Method (BREEAM) in the
56
U.K. (BRE, 2014) and Comprehensive Assessment System for Building Environmental Efficiency
57
(CASBEE) in Japan (IBEC, 2011). A few years later, the transportation community designed its own
58
specific systems too. At present, there are a significant number of national and international rating
59
systems oriented to evaluate green buildings and only a few focused on analysing infrastructures from
60
the point of view of sustainable development. These systems vary in terms of scope and complexity but
61
are generally designed to provide guidance, scoring and potential rewards for using sustainable best
62
practices. Rating systems usually focus on practices that are compatible with current regulations but are
63
beyond existing minimum regulatory requirements. The main purpose of most sustainability rating
64
systems is not to set a scientifically defensible taxonomy of sustainability, but rather a tool to encourage
65
the implementation of sustainability practices beyond regulatory minimum targets and communicate
66
sustainability concepts in a comprehensible manner to all stakeholders, from construction professionals
67
to citizens.
68
69
Rating systems are often criticized because they tend to minimize the appraisal of economic and social
70
aspects in detriment of environmental issues (Gibberd, 2005). In addition, international development
71
agencies and organizations have not broadly incorporated rating systems into the assessment of their
72
project processes (UNOPS, 2012), whilst the evaluation of the economic benefits derived from their
73
implementation is very complicated (FIDIC, 2012). In relation to the context of this research, rating
74
systems are also deficient due to their focus on developed economies and omission of specific features
75
of third world countries (EAP & ARUP, 2011).
76
77
There are three main rating systems that assess infrastructure projects following the principles of
78
sustainability: ENVISION (USA) (ISI, 2012), Civil Engineering Environmental Quality (CEEQUAL) (BRE
79
Group, 2015) and Infrastructure Sustainability (IS) Rating Tool (Australia) (ISCA, 2012). A review of
80
these rating systems revealed that they are imbalanced in relation to the importance given to the three
81
pillars of sustainability, also known as the Triple Bottom Line (TBL), since the number of environmental
82
credits considered are more numerous than those assigned to economic and social aspects
(Diaz-83
Sarachaga et al., 2016). Commercial reasons are the main goal of infrastructures rating systems in
84
richer nations, in order to advertise the quality of projects and the interest of clients, designers and/or
85
builders in sustainability, whereas the context of developing countries requires a different approach for
86
evaluating the whole sustainability contribution of projects to the development of these nations. The lack
87
of data related to the indicators included in existing frameworks and the disregard for management
88
practices are another setbacks which hinder the accurate implementation of these tools in developing
89
countries.
90
91
Moreover, these systems were found to be mainly oriented to their countries of origin and omit most of
92
both the Millennium Development Goals (MDGs) established in the United Nations (UN) Millennium
93
Declaration (UN, 2000) and the Sustainable Development Goals (SDGs) adopted by the UN General
94
Assembly on 25 September 2015 (UN, 2015). MDG 1 (Eradicate Extreme Poverty & Hunger), MDG 3
95
(Promote Gender Equality and Empower Women) and MDG 7 (Ensure Environmental Sustainability)
96
should be included in rating systems for infrastructure projects in developing countries. SDGs 4, 5, 11
97
and 16 address social issues such as the search for education equality in terms of gender and quality,
98
the transformation of cities and human settlements in safe, inclusive and resilient places. The promotion
99
of sustainable economic growth and employment and resilient infrastructure and industrialization are
100
targeted by SDGs 8 and 9. The governance area, which corresponds to SDGs 12 and 17, involves the
101
use of sustainable consumption and production patterns and the strengthening of the global partnership
102
for sustainable development.
104
The scarcity of definitive management guidelines to establish key elements for assessing the degree of
105
sustainability of a project confuses owners, consultants and other stakeholders. The implementation of
106
sustainability management practices and reporting systems is also crucial to meet project goals for
107
sustainable development and measure progress towards the achievement of these aims (FIDIC, 2012).
108
109
As a contribution to enhance the field of sustainable rating systems, this paper proposes a methodology
110
and a set of TBL indicators to create a new Sustainable Infrastructure Rating System for Developing
111
Countries (SIRSDEC) through the combination of two multi-criteria decision-making methods: Analytic
112
Hierarchical Process (AHP) and Integrated Value Model for Sustainable Assessment (MIVES). The
113
combination of AHP and MIVES has been used successfully in the past to appraise the contribution to
114
sustainability provided by different construction alternatives (San-Jose Lombera et al., 2010; Pons and
115
Aguado, 2012), to the extent of being included in the Spanish Structural Concrete Standard (EHE-08)
116
(Aguado et al., 2012). AHP is used to weight the elements into which the system is structured according
117
to the opinions returned by a group of international experts regarding their relative importance, whilst
118
MIVES provides value functions to transform indicators measured in different units into a value index
119
(Jato-Espino et al., 2014). SIRSDEC arises as an effective response to the weaknesses detected in
120
current infrastructure rating systems and seeks to create, develop and implement a tool capable of
121
guiding and promoting sustainable development in poorer countries through the implementation of
122
infrastructure projects.
123
124
125
2. Sustainable Infrastructure in Developing Countries
126
127
The United Nations (UN) created the Human Development Index (HDI), based on the consideration of
128
a series of criteria such as life expectancy, per capita income and literacy rate, to classify countries into
129
categories according to their economic development. Countries with an HDI below 0.8 are generally
130
considered as Developing Countries. UN has 193 member states, of which 53 and 140 are classified as
131
developed and developing countries, respectively. Developing countries include Albania, Bosnia and
132
Herzegovina, Serbia and Macedonia in Europe, Africa, Asia (except Japan, South Korea, Hong Kong,
133
Singapore, Qatar, Brunei and Bahrein) and South America (excluding Chile and Argentine) (UN-Habitat,
134
2015).
135
136
Developing countries require a major increase in infrastructure investment to reduce growth constraints,
137
contribute to urbanization needs and meet their development, inclusion and environmental goals. Global
138
trade plays an outstanding role in countries development and consequently in infrastructure. This
139
includes traditional transport infrastructure such as roads, railways and ports, and information
140
technology infrastructure. World population is expected to increase from 6.1 to 8.1 billion between 2010
141
and 2030 (UN-Habitat, 2011). Most of this rise corresponds to urban settlements located in developing
142
countries, which accelerates more the need of sustainable urban infrastructure (UN-DESA, 2014).
143
144
Infrastructure role is also essential to ensure the sustainability of economies through the limitation of
145
environmental impacts of infrastructure assets, mitigation of Climate Change and fostering of
146
sustainable practices (Ebobisse, 2015). The rise of investment budget has been estimated from $1
147
trillion per year nowadays to approximately $1.8-2.3 trillion per year by 2020, assuming 4% of Gross
148
Domestic Product (GDP) annual growth rate, which means about 3-8% of total GDP (Fardoust et al.,
149
2010). In addition, $200-300 billion are destined for measures aimed at ensuring lower emissions and
150
more resilience to climate change. Figure 1depicts pie charts indicating the investment required in 2020
151
according to regions and sectors. East Asia Pacific (EAP) is expected to require most of this investment,
152
followed by South Asia (SA) and Latin America and The Caribbean (LAC). Regarding the distribution by
153
sectors, basic infrastructure such as Electricity, Water and Transportation monopolize most of the
154
budget. An estimate of 1.4 billion people still has no access to electricity, whilst 0.9 billion do not have
access to drinkable water and 2.6 billion lack basic sanitation, which justify the importance of focusing
156
on the first two sectors (Bhattacharya et al., 2012).
157
158
159
Figure 1. Estimated annual infrastructure investment in 2020 split by a) Region b) Sector ($ trillion)
160
161
Infrastructure projects have a prominent impact on determining environmental sustainability. Between
162
10 and 15% of the required infrastructure investment can be assigned to make such investment
163
sustainable by ensuring lower emissions, higher efficiency and resilience to Climate Change (UNCTAD,
164
2014). Despite this additional cost, the net effect of these investments is very positive from social,
165
economic and environmental perspectives (UN-DESA, 2015). The rise of economic growth and the
166
change from primary to secondary and tertiary economic industries are evident consequences of
167
infrastructure development, which also reduce levels of inequality and give added social returns to the
168
community (UNOPS, 2012).
169
170
An increasing number of international development organizations are managing a wide range of projects
171
in developing countries over the last decades to foster social, economic and environmental
172
development. Amongst them, the role of Multilateral Development Banks (MDBs) is highly remarkable.
173
MDBs delivered a joint statement Commitment to Sustainable Transport during the Rio+20 Conference,
174
with the aim of strengthening the role of transportation infrastructure in sustainable development by
175
providing $175 billion of loans and grants to develop projects in developing countries from 2012 to 2022.
176
At present, more than 200 projects have been approved, including 115 for roads, 39 for urban transport,
177
24 for rail, 13 for airports and 5 for inland waterway and maritime projects (MDBs, 2015). Furthermore,
178
the MDB Infrastructure Action Plan (MDBs, 2011) reflects extensive analysis and collaboration among
179
the MDBs through a background report on infrastructure issues in third world countries provided to the
180
Group of 20 (G20) in June 2011. This plan describes an ambitious set of initiatives aimed at unlocking
181
the infrastructure project pipeline, in order to enable both increasing the participation and financing in
182
the private sector and improving the efficiency of infrastructure spending.
183
184
Despite the huge budget destined for the development of infrastructures in developing countries, no
185
global Sustainability Infrastructure Rating System has been created to manage and monitor them. The
186
Sustainable Transport Appraisal Rating (STAR) framework (Veron-Okamoto et al., 2014), created by
187
the Asian Development Bank and used by the MDBs, includes criteria to assess the social, economic
188
and environmental sustainability of transportation projects. Engineers against Poverty and Arup worked
189
on a Sustainability Poverty and Infrastructure Routine for Evaluation (ASPIRE) (EAP & ARUP, 2011)
190
that appraises projects qualitatively according to the TBL, but does not rate them. The International
Federation of Consulting Engineers (FIDIC) elaborated Project Sustainability Management Guidelines
192
in 2004 to provide some guidelines about what a sustainable project consists of (FIDIC, 2004).
193
194
3. Methodology
195
196
A literature review was conducted to collect information related to existing Sustainable Infrastructure
197
Rating Systems, multi-criteria decision-making methods, sustainable development goals established by
198
international organizations and needs of developing countries in terms of the TBL. Once the objectives
199
to be achieved by SIRSDEC were established, the decision-making problem was defined according to
200
a hierarchical three-level scheme, usually called decision-making tree, consisting of a series of
201
requirements, criteria and indicators. A questionnaire form was distributed to international experts to
202
collect their opinion regarding the relative importance among the elements in the decision-making tree.
203
The Analytic Hierarchy Process (AHP) was selected to transform the linguistic pairwise comparisons
204
provided by the experts into the weights of requirements, criteria and indicators. The Integrated Value
205
Model for Sustainable Assessments (MIVES) (ETCG, 2015) was proposed to convert the ratings of the
206
indicators across the indicators into value indices reflecting the satisfaction degree they produced. The
207
definition of different feasible alternatives to the decision-making problem allows their appraisal from the
208
perspective of multiple criteria and objectives (Janssen, 1992) and the subsequent determination of their
209
contribution to sustainability. Figure 2 illustrates the research methodology used to conceive SIRSDEC.
210
211
212
Figure 2. Research methodology developed for this paper
213
214
3.1. SIRSDEC design
215
216
Sustainability assessments consist of the identification, prediction and evaluation of the potential impact
217
of different solutions or alternatives across the TBL (Devuyst, 2000). Developing countries emphasise
218
socio-economic development over environmental aspects when formulating their sustainability agenda
219
(Ugwu and Haupt, 2005). Therefore, the achievement of sustainable development goals in these areas
220
requires a balance among environmental awareness and the specific socio-economic demands of
221
citizens (incomes, employment, shelter, basic services, social infrastructure and transportation)
222
(Hiremath et al., 2013). Consequently, the assessment of sustainability in poorer nations requires the
223
design of decision support tools to facilitate the selection of indicators based on country and
specific needs through the study of the local priorities in relation to the sustainability agenda and the
225
incorporation of international indicators (Diaz-Sarachaga et al., 2016).
226
227
Under these premises, SIRSDEC was designed to include indicators mainly referred to Agenda 21
228
issues (UN, 1992),in order to achieve a balance between the three pillars of sustainable development.
229
Therefore, these indicators focused on the particular context of developing countries and considered all
230
the stages of a long-term project life-cycle such as design, construction, operation, renovation and
231
demolition/reuse. The management dimension was also considered to overcome the existing shortage
232
of guidelines to interconnect the overall goals of sustainable development in poorer countries (Hiremath,
233
2013). Furthermore, additional overarching features were also taken into account in the selection
234
process of the set of criteria and indicators to characterize SIRSDEC.Amongst them, the relevance of
235
the principles of sustainability reflects the whole performance of the rating system and its orientation to
236
policy issues, which enables identifying the changes required to promote progress towards sustainability
237
goals (Hart, 2006). The breakdown of the SIRSDEC decision-making tree is shown in Table 1, including
238
4 requirements, 23 criteria and 29 indicators.
239
240
Table 1. SIRSDEC decision-making tree
241
R# Requirement C # Criteria I # Indicator
R1 Management
C1.1 International Standards I1.1.1 ISO 9001 or equivalent I1.1.2 ISO 14001 or equivalent
C1.2 Project Sustainability Management (PSM) plan I1.2.1 Project Sustainability Management plan C1.3 Sustainability Risk Management (SRM) plan I1.3.1 Sustainability Risk Management plan C1.4 Sustainable Procurement plan I1.4.1 Sustainable Procurement plan C1.5 Inspection & Auditing (I&A) plan I1.5.1 I&A plan
C1.6 Reporting & Lessons Learned (R&LL) I1.6.1 I1.6.2 Periodic reports distribution Lessons Learned Log
R2 Society
C2.1 Community & Stakeholders involvement I2.1.1 Stakeholders involvement ratio C2.2 Role of indigenous people I2.2.1 Indigenous involvement ratio C2.3 Equitable development I2.3.1 Gender average wage ratio (f/m) C2.4 Social impacts & benefits I2.4.1 Population impacted by project
I2.4.2 Settlements area disturbed C2.5 Cultural Heritage I2.5.1 Local cultural assessment
R3 Environment
C3.1 Natural Ecosystem conservation I3.1.1 Impacted ecosystem area ratio C3.2 Biodiversity Ecosystem I3.2.1 Endangered species ratio C3.3 Greenhouse gases emissions I3.3.1 GHG emissions reduction rate C3.4 Energy consumption I3.4.1 I3.4.2 Energy savings rate Renewable energy use rate
C3.5 Water management I3.5.1 Fresh water consumption I3.5.2 Runoff water stored C3.6 Flooding risk I3.6.1 Floodplains area C3.7 Air Quality I3.7.1 Air pollutants reduction C3.8 Waste management I3.8.1 Waste production decrease
I3.8.2 Recycled/reused waste
R4 Economy
C4.1 Combating poverty I4.1.1 Local economic assessment C4.2 Agriculture impacts I4.2.1 Farmland area impacted C4.3 Local materials consumption I4.3.1 Local materials use rate C4.4 Local employment I4.4.1 Local employment rate
242
Each of the 23 criteria that forms SIRSDEC corresponds to an objective that infrastructure projects must
243
achieve to be considered “sustainable” in developing countries. As a prerequisite, SIRSDEC has 13
244
mandatory criteria to ensure all projects face key issues related to sustainability in less developed
245
countries. In the domain of management, there are 4 compulsory criteria: International Standards (C1.1),
246
Project Sustainability Management (PSM) plan (C1.2), Sustainable Procurement plan (C1.4), and
247
Inspection & Auditing (I&A) plan (C1.5). The social aspect encompasses 3 additional mandatory criteria,
248
such as Community & Stakeholders involvement (C2.1), Equitable development (C2.3) and Culture
249
Heritage (C2.5). The environmental requirement includes 4 indispensable criteria: Natural Ecosystem
250
conservation (C3.1), Greenhouse gases emissions (C3.3.), Water management (C3.5), and Flooding
risk (C3.6). Combating poverty (C4.1) and Local employment (C4.4) in the economic requirement
252
complete the set of 13 essential criteria demanded for all projects.
253
254
SIRSDEC includes a set of 29 measurable indicators that represent key issues in infrastructure project
255
delivery, in order to monitor the performance, sustainability understanding and appropriate linkage
256
between stakeholders. The management requirement consists of 8 indicators. I1.1.1 evaluates the
257
implementation and maintenance of ISO 9001 (or equivalent) to align project team members with
258
international quality management standards, whilst I1.1.2 plays the same role with ISO 14001 (or
259
equivalent) to fulfil a set of environmental management practices. I1.2.1 rewards the ability to design
260
and implement projects integrating social, environmental and economic aspects. The use of the
261
Sustainability Risk Management (SRM) plan monitored through I1.3.1 targets the identification,
262
assessment, prioritization and implementation of an action plan for sustainability risks. The
263
consideration of the Sustainable Procurement plan scored by I1.4.1 aims to manage procurement and
264
supply chains through the balance of social, economic and environmental aspects. The implementation
265
of the I&A plan to ensure the compliance of sustainable practices, the distribution of progress reports to
266
stakeholders and the recording & outreach of lessons learned are the goals sought by I1.5.1, I1.6.1 and
267
I1.6.2, respectively.
268
269
Six indicators are considered in the social requirement. I2.1.1 and I2.2.1 assess the degree of
270
involvement of stakeholders and indigenous community in the project with respect to the total affected
271
stakeholders and population. Gender wage equality is evaluated using I2.3.1 as the ratio of average
272
female wages to male salaries. I2.4.1 shows the proportion of population negatively impacted by the
273
infrastructure under analysis over its life-cycle in social, environmental and economic terms. The ratio
274
of housing temporary and/or permanently affected by the project is monitored by I2.4.2. I2.5.1 awards
275
the identification, assessment, management and maintenance of cultural heritage as defined in the
276
United Nations Educational, Scientific and Cultural Organization (UNESCO) (UNESCO, 1972).
277
278
The environmental dimension contains 11 indicators affecting the whole life-cycle of the project. I3.1.1
279
and I3.1.2 reflect the proportion of ecosystem area and endangered species impacted negatively during
280
the development and operation of projects, respectively. I3.3.1 and I3.4.1 appraise the reduction of GHG
281
emissions and used energy with respect to standard estimates. The ratio of consumed fresh water in
282
comparison with available water resources is assessed by I3.5.1, whilst the capability to store runoff is
283
rewarded by I3.5.2. The rate of land area in the project sensitive to suffer damage by flooding is
284
assessed through I3.6.1. I3.7.1 and I3.8.2 award actions taken to decrease air pollutant emissions and
285
waste production in comparison with standard values (NEC, 2001).
286
287
The economic requirement is characterized in SIRSDEC through 4 indicators. I4.1.1 rewards the
288
assessment of the economic benefits added by the project that can contribute to reducing levels of
289
poverty and promoting economic growth in the region. The impact of the project on land where
290
permanent crops are located is measured by I4.2.1. Finally, the fostering of local materials and
291
manpower use is appraised by I4.3.1 and I4.4.1, respectively.
292
293
SIRSDEC is a system designed to help users to evaluate the sustainability of any infrastructure project
294
developed in developing countries at any stage in their life cycles. The total score of the system amounts
295
29 points, each of them related to the fulfilment of the objectives measured through the set of indicators,
296
so that each indicator scores in a range between 0 and 1. There are 13 compulsory criteria that represent
297
15 points which must be necessarily achieved to pass evaluation. The accomplishment of the remaining
298
indicators can lead to reach the two other levels of achievement considered in SIRSDEC: Pass (15
299
points), Silver (16 to 22 points) and Gold (22+ points).
300
301
Despite SIRSDEC tries to fill the existing gap of sustainability frameworks to rate infrastructure projects
302
in developing countries, some aspects limit its standardized application. SIRSDEC aims to appraise
303
sustainability in all different stages of a project, including operation. Hence, this system requires a
permanent source of relevant and reliable information which might be difficult to acquire at the present
305
time. Furthermore, no systematic management practices are implemented in these countries, which
306
hinders the use of SIRSDEC as the cornerstone of a general sustainability framework. Finally, although
307
SIRSDEC was originally designed as an easy-to-use tool to be widely deployed worldwide, the specifics
308
of some geographical areas might require the customization and reweighting of indicators in very
309
particular cases.310
311
3.2. Data collection
312
313
An on-line questionnaire was prepared using Google Forms to collect and summarize the opinions from
314
international leading experts belonging to several countries worldwide in an easy and automatic manner.
315
This approach facilitated the distribution of the survey among a larger number of participants located in
316
different continents and the quick integration of the data received using the same tool. The questionnaire
317
is expected to be sent to more than a hundred of professionals related to the assessment of
318
sustainability, so that a response rate of about 25% could be considered enough to validate its
319
representativeness. The profiles sought to form the panel of respondents should include international
320
leading experts in the domain of sustainability and environmental assessment systems such as
321
professionals from academia, industry, public development institutions and research organizations.
322
323
The survey was divided into three parts. The first part defined the purpose of each element in the
324
decision-making tree represented in Table 1, guided the respondents about how to fill in the
325
questionnaire and requested some information related to their profile for making statistics. The second
326
section invited the experts to answer several general questions related to sustainability and its
327
assessment, whilst the last part focused on the pairwise comparisons between indicators, criteria and
328
requirements according to questions like “How important is element i with respect to element j?”.
329
330
3.3. Weighting of the elements in the decision-making tree
331
332
Weighting is a key factor in sustainability assessments, since it has a great influence on the overall
333
score reachable by a project (Lee et al., 2002). SIRSDEC has been designed as a generic framework
334
valid for all developing countries, which implies that weighting re-assessment is not necessary for
335
evaluating a project to be implemented in any country included in this category. The comparisons
336
provided by the experts in the last step of the questionnaire were processed to obtain weights of the
337
elements in the decision-making tree using the Analytic Hierarchy Process (AHP) (Saaty, 1980). This
338
method was selected for weighting because of its simplicity and flexibility to be combined with other
339
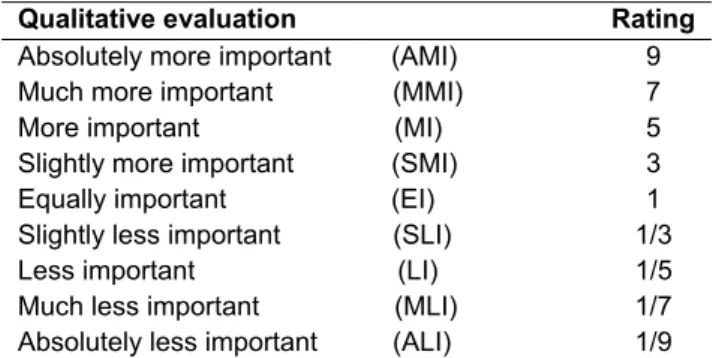
multi-criteria methods (Vaidya et al., 2006). Table 2 shows the numerical scale considered in the AHP
340
method to quantify a list of pairwise comparisons as that collected from the questionnaires returned by
341
the experts.
342
343
Table 2.AHP pairwise comparison scale
344
Qualitative evaluation Rating
Absolutely more important (AMI) 9 Much more important (MMI) 7 More important (MI) 5 Slightly more important (SMI) 3 Equally important (EI) 1 Slightly less important (SLI) 1/3 Less important (LI) 1/5 Much less important (MLI) 1/7 Absolutely less important (ALI) 1/9
345
The application of the comparison scale shown in Table 2 enables the construction of a n x n reciprocal
346
matrix of pairwise comparisons (Skibniewski et al., 1992). Its consistency is evaluated throughout the
347
maximum matrix eigenvalue λ , so that the matrix is completely consistent when λ and
348
becomes increasingly inconsistent as the eigenvalue grows, according to the consistency ratio (C.R.)
349
defined in Eq. (1).350
351
C. R. . . . 0.1(1)
352
353
where C.I. is the consistency index and R.I. is the random consistency index. A matrix is considered
354
consistent when the ratio between C.I. and R.I. is less than 0.1, with C.I. being expressed as in Eq.
355
¡Error! No se encuentra el origen de la referencia.. The values of R.I. listed in Table 3 represent the
356
average C.I. for 500 randomly generated matrices of the same order.
357
358
C. I. (2)
359
360
Table 3. Random consistency index
361
Matrix size (n) 2 3 4 5 6 7 8 9 10
R.I 0.00 0.58 0.90 1.12 1.24 1.32 1.41 1.45 1.49
362
363
The method proposed by Jato-Espino et al. (2016), which is based on the Generalized Reduced
364
Gradient (GRG) algorithm (Abadie et al., 1968) and an aggregation system according to the proximity
365
between the judgments of each pair of respondents, was used to adjust possible inconsistencies in the
366
questionnaires and synthetize they all into a consensual set of weights.
367
368
Therefore, if A is the inconsistent comparison matrix related to a set of criteria C 〈C , C , … , C 〉
369
and A ′ is the objective consistent matrix being sought, the algorithm minimizes the differences between
370
the upper right triangles of both matrices to fulfil Eq. (2), with the limitation of remaining within the
371
corresponding lower and upper threshold values of the AHP comparison scale. The differences between
372
both matrices are measured using the Root Mean Square Error (RMSE) (Chai et al., 2014). A logarithmic
373
scale is applied to equalize the differences between lower and higher thresholds, so that the
374
minimization problem is expressed as shown in Eq. (3).
375
376
377
378
379
380
381
382
383
The Euclidean distance, a common metric to assess similarities between datasets (Xing et al., 2003), is
384
proposed to evaluate the affinity between the judgments provided by the respondents, so that a
385
symmetric
n x n
matrix N is obtained from the Euclidean distances between each pair of experts, with386
n
being the number of respondents. Therefore, the weight for each expert is determined as the inverse387
of the sum of the distances from each respondent to the remaining ones.
388
389
These weights were aggregated using the geometric mean, which has been proven to be the proper
390
method to integrate a set of n individual opinions into a unique agreed judgment a , as the nth root
391
of their product (Aczél et al., 1983), (Aczél et al., 1987). Finally, the weights w of the elements in the
392
decision-making tree can be calculated through Eq. (5), whose application must be preceded by the
393
Minimize 1 n , ln a ln a (3) subject to: C. R. 0.1 ln a ln ln anormalization (a , ) of the values in the consensual comparison matrix formed of n values of a , as
394
shown in Eq. (4):395
a , a , ∑ a, (4)396
w ∑ 1 ∑ a , ∑ ∑ 1 ∑ a , (5)397
3.4. Valuation of indicators
398
399
MIVES is a multi-criteria decision-making (MCDM) method that emerged as the result of initial
400
researches conducted by three Spanish institutions: Universidad del País Vasco (UPV), Universitat
401
Politècnica de Catalunya (UPC) and LABEIN-Tecnalia. MIVES was developed through two projects
402
approved in public competitions organized under the Spanish National Research Plan, using value
403
analysis as a platform for decision-making for evaluating alternatives and evaluating sustainability
404
quantitatively (San-Jose et al., 2010). Value functions are the key elements of MIVES, since they enable
405
the transformation of the ratings of alternatives across the indicators, which are commonly measured in
406
different units, into non-dimensional values in the range between 0 and 1 that represent the degree of
407
satisfaction they provide.
408
409
Value functions are defined by five parameters (K , C , X , X and P) which determine four different
410
shapes to model these transformations: linear, concave, convex and S-shape. Figure 3 illustrates the
411
parameters to be taken by these functions, as well as the shapes in which they result. S-shape functions
412
include the most relevant increase in satisfaction in the central zone of the curve. On the contrary,
413
convex and concave curves reveal increases in satisfaction in areas close to X and X , depending
414
on whether the function is increasing or decreasing. Linear functions consist of a steady increasing or
415
decreasing of satisfaction regardless of the value of the abscissa.
416
417
418
Figure 3. Different shapes and parameters of MIVES value functions
419
420
Value functions for increasing indicators are calculated according to Eqs.(6)and(7). If the value of the
421
indicator decreases as its rating increases, X is replaced by X in both formulations.
422
423
V B ∗ 1 e ∗ | | (6)
424
425
where X is the abscissa for the minimum value reachable by the indicator, X is the actual rating of
426
the alternative with respect to the indicator, P is the form factor and C and K are the abscissa and
427
ordinate in the inflection point of the curve, respectively. B is an adjusting to ensure that value indices
428
remain in the range 0,1 and is determined by Eq.(7):
429
430
B 1 e ∗ | | (7)431
432
where X is the abscissa for the maximum value the indicator might achieve. The overall sustainability
433
index V of an alternative is calculated through the aggregation of the value indices from the lower
434
(indicators) to the upper (requirements) levels of the decision-making tree:
435
436
V ∑ V ∗ W (8)
437
438
where V and W are the sustainability index and weight for an alternative in relation to the
i
level in the439
decision-making tree and
m
is the number of elements in each level forming the decision-making tree.
440
441
Binary stepped value functions (0 or 1) were assigned to those indicators that does not consider
442
intermediate values and are simply evaluated according to whether their purpose is met or not (I1.1.1,
443
I1.12, I1.2.1, I1.3.1, I1.4.1, I1.5.1, I1.6.1, I1.6.2, I2.5.1 and I4.1.1). The parameters to characterize the
444
remaining indicators using the value functions depicted in Figure 3 were defined from data found in
445
international development organizations such as the World Bank, the International Labour Office (ILO),
446
the United Nations Environment Programme (UNEP), the United Nations Development Programme
447
(UNDP), the United Nations Human Settlements programme (UN-HABITAT) and the United Nations
448
Educational Scientific and Cultural Organization (UNESCO). Since these data were collected by
449
international agencies to monitor specific metrics which can differ from the goals sought by some of the
450
indicators included in SIRSDEC, additional information corresponding to developed countries in relation
451
to similar parameters could be considered instead. Furthermore, data included in existing sustainable
452
rating systems were another reference to be used in the definition of value functions if international data
453
did not positively correlate to the set of indicators considered in SIRSDEC.
454
455
4. Conclusions
456
457
This article presents the methodology to develop a rating tool to appraise infrastructure projects in
458
developing countries (SIRSDEC) according to their contribution to the Triple Bottom Line through the
459
combination of two multi-criteria analysis methods such as AHP and MIVES. In contrast to existing rating
460
systems, which weight criteria and indicators related to sustainability by direct allocation, SIRSDEC uses
461
the judgments received from international experts to determine these weights through an on-line
462
questionnaire based on the AHP pairwise comparison scale. The contribution of infrastructure projects
463
in developing countries to sustainable development across the weighted indicators and criteria is
464
assessed using the value functions provided by MIVES, which facilitate the standardization of indicators
465
and their subsequent unrestricted integration into an overall sustainable value index.
466
467
SIRSDEC emphasizes the role of social and economic aspects, including the management dimension
468
as the linkage between the three pillars of sustainable development. In contrast to existing overarching
469
frameworks, which are substantially oriented to environmental issues, the particular context of poorest
470
economies requires balancing the importance of the criteria and indicators belonging to these four
aspects, in order to conduct a feasible sustainability assessment. In this line, the proposed tool has
472
established specific criteria and indicators to enhance social and economic impacts of projects on
473
communities. Hence, in the absence of scoring guidelines for developing countries, SIRSDEC provides
474
an effective decision-making tool to be used by public and private not-for-profit organizations, in order
475
to promote the sustainable development of poorer nations through the assessment of infrastructure
476
projects.
477
478
Indicators derived from Agenda 21 and the Millennium and Sustainable Development Goals, which are
479
the flagship of sustainable development assessment, have been found to not evaluate properly the
480
sustainable performance in less developed countries. Information collected from public development
481
institutions, United Nations agencies and development banks are mainly focused on health and
482
education, whilst only a minority of indicators refers to relevant factors concerning the Triple Bottom
483
Line. This circumstance hinders the definition of the value functions required to characterize the set of
484
indicators forming SIRSDEC. Consequently, new additional indicators related to social, economic and
485
environmental domains should also be considered in the short time by public institutions to monitor the
486
achievement of sustainable development goals in developing countries accurately.
487
488
SIRSDEC can be considered as the starting point of future researches. UN agencies and multilateral
489
banks require effective rating systems to tangibly assess how the large number of infrastructure projects
490
in which they invest every year in poorer countries contribute to sustainable development. The
491
international standardisation of sustainable development indicators involving a balanced consideration
492
between social, economic and environmental aspects, as well as the inclusion of the management
493
dimension as the linkage between them, are the key factors to consider in the analysis of sustainable
494
development. The growing relevance of urbanization trend in developing countries brings a new
495
opportunity to promote the application of frameworks like SIRSDEC for measuring sustainable urban
496
development.497
498
References
499
500
Abadie J and Carpentier J (1968) Generalization of the Wolfe reduced gradient method to the case of
501
nonlinear constraints, 37-47.
502
Aczél J, Saaty TL (1983) Procedures for synthesizing ratio judgements. J. Math. Psychol. Vol. 27,
93-503
102.
504
Aczél J, Alsina C (1987) Synthesizing judgements: a functional equations approach. Mathematical
505
Modelling. Vol. 9, 311-320.
506
ADB Sustainable Development Working Paper Series, Nº 31. January 2014. Asian Development Bank.
507
Aguado A, Caño AD, De la Cruz MP, Gomez D and Josa A (2012) Sustainability assessment of concrete
508
structures within the Spanish structural concrete code. Journal of Construction Engineering and
509
Management 138 (2), pp. 268-276.
510
Bhattacharya A, Romani M and Stern N (2012) Infrastructure for development: meeting the challenge.
511
Policy paper. Centre for Climate Change Economics and Policy Grantham Research Institute on Climate
512
Change and the Environment in collaboration with Intergovernmental Group of Twenty-Four.
513
BRE (2014) BREEAM (Building Research Establish Environmental Assessment Method). Retrieved
514
from https:// www.breeam.com on 28th December 2015.
515
BRE Group (2015). CEEQUAL. Retrieved from http://www.ceequal.com on 19th January 2016.
516
Chai T, Draxler RR (2014) Root mean square error (RMSE) or mean absolute error (MAE)? -Arguments
517
against avoiding RMSE in the literature. Geoscientific Model Dev. Vol. 7, 1247-1250.
518
Devuyst D (2000) Linking impact assessment and sustainable development at the local level: the
519
introduction of sustainability assessment systems. Sustainable Development, 8(2), 67-78.
520
Diaz-Sarachaga JM, Jato-Espino D, Alsulami B and Castro-Fresno D (2016) Evaluation of existing
521
sustainable infrastructure rating systems for their application in developing countries. Ecological
522
Indicators 71, 491-502.
EAP, Engineers against poverty & ARUP (2011) ASPIRE A Sustainability Poverty and Infrastructure
524
Routine for Evaluation. Research and Development.
525
http://www.engineersagainstpoverty.org/documentdownload.axd?documentresourceid=29
526
EAP, Engineers against poverty & ARUP (2011) ASPIRE A Sustainability Poverty and Infrastructure
527
Routine for Evaluation. User Manual. Retrieved from
https://www.oasys-528
software.com/media/Manuals/Latest_Manuals/aspire1.1_manual.pdf
529
Ebobisse A (2015) The IFC Global Infrastructure Project Development Fund. IFC Infraventures,
530
Washington.
531
ETCG (2015) Integrated Value Model for Sustainable Assessments (MIVES). Retrieved from
532
https://www.etcg.upc.edu/prj/mives on 4th November 2015.
533
FIDIC, International Federation of Consulting Engineers (2004) Project Sustainability Management
534
Guidelines. Retrieved from http://fidic.org/books/project-sustainability-management-guidelines-2004.
535
FIDIC, International Federation of Consulting Engineers (2012) The State of the World Report 2012
536
Sustainable Infrastructure. http://fidic.org/sites/default/files/sow2012-0822-electronic.pdf
537
Fardoust S, Yongbeom K and Paz-Sepulveda C (2010) Post-crisis Growth and Development: A
538
Development Agenda for the G-20. World Bank Publications.
539
Gibberd J (2005) Assessing sustainable buildings in developing countries - the sustainable building
540
assessment tool (SBAT) and the sustainable building lifecycle (SBL). Proceedings of the world
541
sustainable building conference. Pages 1605-12.
542
Hart M (2006) Guide to sustainable community indicators (Second ed.). West Hartford, CT: Sustainable
543
Measures.
544
Hiremath RB, Balachandra P, Kumar B, Bansode SS. and Murali J (2013). Indicator-based urban
545
sustainability- a review. Energy for Sustainable Development 17(6), 555-563.
546
IBEC (2011) CASBEE (Comprehensive Assessment System for Building Environmental Efficiency).
547
Retrieved from https://www.ibec.or.jp/CASBEE/english/ on 12th January 2016.
548
ISCA (2012). IS (Infrastructure Sustainability Rating Tool). Retrieved from http://www.isca.org.au on 12th
549
ISI (2012). ENVISION. Retrieved from http://www.sustainableinfrastructure.org on 23rd November 2015.
550
December 2015.
551
Janssen R (1992) Multi-objective Decision for Environmental Management. Kluwer Academic,
552
Dordrecht.
553
Jato-Espino D, Castillo-Lopez E, Rodriguez-Hernandez J, Canteras-Jordana JC (2014) A review of
554
application of multi-criteria decision making methods in construction. Automation in Construction 45, pp.
555
151-162.
556
Jato-Espino D, Indacoechea-Vega I, Gaspar L and Castro-Fresno D (2016) Decision support model for
557
the selection of asphalt wearing courses in highly-trafficked roads. Expert Systems with Applications.
558
Under review.
559
Lee WL, Chau CK, Yik FWH, Burnett J and Tse MS (2002) On the study of the credit-weighting scale in
560
a building environmental assessment scheme. Building and Environment 37, 1385-1396.
561
Litman T (2015) Well measured: Developing indicators for Sustainable and Liveable Transport Planning.
562
Retrieved from http://www.vtpi.org/wellmeas.pdf
563
MDBs, Multilateral Development Banks (MDB) working Group on Infrastructure (2011) Infrastructure
564
Action Plan. Paper 65561 v1. World Bank Publications.
565
MDBs, Multilateral Development Banks (MDB) Working Group on Sustainable Transport (2015)
566
Progress Report (2013-2014). United Nations Sustainable Development Knowledge Platform. Retrieved
567
from www.sustainabledevelopment.un.org.
568
NEC, National Emission Ceilings for certain pollutants (2001) Directive 2001/81/EC of the European
569
Parliament and the Council on National Emission Ceilings for certain pollutants. Retrieved from
570
http://eur-lex.europa.eu/legal-content/EN/TXT/?uri=celex%3A32001L0081http://eur-lex.eu
571
Pons O and Aguado A (2012) Integrated value model for sustainable assessment applied to
572
technologies used to build schools in Catalonia, Spain. Building and Environment 53, 49-58.
573
Saaty TI (1980) The Analytic hierarchy process: Planning, priority setting, resource allocation.
McGraw-574
Hill.
San-Jose Lombera JT and Garrucho Aprea I (2010) A system approach to the environmental analysis
576
of industrial buildings. Building and Environment 45, 673-683.
577
Skibniewski M and Chao L (1992) Evaluation of advanced construction technology with AHP method.
578
Journal of Construction Engineering and Management 118 (3), 577-593.
579
Ugwu OO and Haupt TC (2005) Key performance indicators for infrastructure sustainability - a
580
comparative study between Hong Kong and South Africa. Journal of Engineering, Design and
581
Technology, 3(1), 30-43.
582
UN, United Nations (1992) Rio Declaration on Environment and Development. The United Nations
583
Conference on Environment and Development. Rio de Janeiro.
584
UN, United Nations (1992) Agenda 21 Contents. United Nations Conference on Environment &
585
Development. Rio de Janeiro. 3 to 14 June 1992. Retrieved from
586
https://sustainabledevelopment.un.org/content/documents/Agenda21.pdf
587
UN, United Nations (2000) UN Millennium Declaration. Millennium Summit. www.unmilleniumproject.org
588
UN, United Nations (2015) Transforming our World: the 2030 Agenda for Sustainable Development.
589
Retrieved from http://www.un.org/ga/search/view_doc.asp?symbol=A/RES/70/1&Lang=E
590
UNCTAD, United Nations Conference on Trade and Development (2014) World Investment report in
591
2014. Investing in the SDGs: An Action Plan. New York and Geneva. Retrieved from
592
http://unctad.org/en/PublicationsLibrary/wir2014_en.pdf
593
UN-DESA, United Nations Department of Economic and Social Affairs (2014) World Urbanization
594
Prospects. The 2014 Revision. Highlights. New York. Retrieved from
595
https://esa.un.org/unpd/wup/Publications/Files/WUP2014-Highlights.pdf
596
UN-DESA, United Nations Department of Economic and Social Affairs (2015) World Population
597
Prospects. Key findings and advance tables. 2015 Revision. Retrieved from
598
https://esa.un.org/unpd/wpp/Publications/Files/Key_Findings_WPP_2015.pdf
599
UNESCO, United Nations Educational, Scientific and Cultural Organization (1972) The Convention for
600
the Protection of the World Cultural and Natural Heritage. Paris. Retrieved from
601
http://whc.unesco.org/en/convention/
602
UN-Habitat, United Nations Habitat (2011) Infrastructure for Economic Development and Poverty
603
Reduction in Africa. Nairobi. Retrieved from
http://www.uncsd2012.org/content/documents/UN-604
HabitatReport.pdf
605
UN-Habitat, United Nations Habitat (2015) E-Governance and Urban Policy Design in Developing
606
Countries. Retrieved from
http://unhabitat.org/books/e-governance-and-urban-policy-design-in-607
developing-countries/
608
UNOPS, United Nations Office for Project Services (2012) UNOPS Policy for sustainable infrastructure.
609
https://www.unops.org/SiteCollectionDocuments/Multimedia/Rio/unops_policy_for_sustainable_infrastr
610
ucture.pdf
611
USGBC (2009) LEED (Leadership in Energy and Environmental Design). Retrieved from https://
612
www.usgbc.org/leed on 10th February 2016.
613
Vaidya OS and Kumar S (2006) Analytic hierarchy process: An overview of applications. European
614
Journal of Operational Research, 169 (1), 1-29.
615
Veron-Okamoto A and Sakamoto K (2014) Toward a Sustainability Appraisal Framework for Transport.
616
Viñolas B, Cortes F, Marques A, Josa A and Aguado A (2009) MIVES: Modelo Integrado de Valor para
617
evaluaciones de sostenibilidad. II Congres Internacional de Mesura i Modelitzacion de la Sostenibilitat
618
(ICSMM), Barcelona.
619
Wolfe P (1963) Methods of nonlinear programming in: Graves RL, Wolfe P (Eds.) (1963) Recent
620
Advances in Mathematical Programming. McGraw-Hill, New York (U.S.), pp. 67-86.
621
Xing EP, Ng AY, Jordan MI, Russell S (2003) Distance metric learning, with application to clustering
622
with side-information. Adv. neural inf. process. syst.
623
Yeniay O (2005) A comparative study on optimization methods for the constrained nonlinear
624
programming problems. Math. Probl. Eng. Pages 165-173.
625
View publication stats View publication stats