UNIVERSIDAD DE VALLADOLID
ESCUELA DE INGENIERIAS INDUSTRIALES
Grado en Ingeniería Química
Testing a Pilot Wastewater Treatment Plant
in Laboratory Scale
Autor:
Rodríguez del Egido, Miguel Guillermo
Silvia Bolado Rodríguez
Tampere University of Applied Sciences TAMK
TFG REALIZADO EN PROGRAMA DE INTERCAMBIO
TÍTULO: Testing a Pilot Wastewater Treatment Plant in Laboratory Scale ALUMNO: Miguel Guillermo Rodriguez del Egido
FECHA: 20/05/2015
RESUMEN
Los objetivos de este proyecto son poner en marcha la planta de tratamiento de aguas residuales a escala de laboratorio, realizar test cambiando diferentes factores y analizar la calidad del agua centrándose en la eliminación de nutrientes.
Los experimentos se realizaron en los laboratorios de la Universidad de Ciencias Apli-cadas de Tampere TAMK, concretamente en los laboratorios de medioambiente y de procesos, durante 4 meses.
La información y resultados obtenidos pueden ser usados para cursos prácticos de asig-naturas para futuros estudiantes y nuevos proyectos relacionados con el tratamiento de aguas.
En la planta, se llevan a cabo procesos biológicos, químicos y mecánicos. El sistema consiste en diferentes módulos en los que hay procesos de denitrificación y nitrifica-ción, aireación y clarificación.
Los resultados muestran que la eliminación de fósforo se consigue correctamente, mien-tras que la eliminación de nitrógeno es confusa debido a las diferentes formas en las que aparece el nitrógeno en el proceso.
Finalmente, este proyecto debe ser continuado. Nuevos y más profundos experimentos pueden ser realizados cambiando varios factores, analizando diferentes parámetros y usando otros métodos de análisis.
ABSTRACT
Tampereen ammattikorkeakoulu
Tampere University of Applied Sciences
Degree programme in Environmental Engineering
Miguel Guillermo Rodríguez del Egido:
Testing a Pilot Wastewater Treatment Plant in Laboratory Scale
Bachelor's thesis 28 pages July 2015
The aims of this project were taking the laboratory-scale wastewater treatment plant into use, make test runs by changing several factors and analyze the wastewater quality fo-cusing on nutrient removal.
Experiments were carried out in the laboratories of TAMK, concretely in the environ-mental and process laboratories, during 4 months.
The information and results obtained can be used for laboratory courses for future stu-dents and new projects related to water treatment.
At the plant, biological, chemical and mechanical processes are carried out. The system consists of different modules in which there are processes of denitrification and nitrifi-cation, aeration and clarification.
The results show that phosphorus removal of the system is done properly, while regard-ing to nitrogen removal seems to be confused because of the different forms in which nitrogen appears in the process.
Finally, the testing project should be continued. Further experiments may be performed by changing various factors, analyzing different parameters and using others methods of analysis.
CONTENTS
1 INTRODUCTION ... 7
1.1. Wastewater Treatment ... 7
1.2. Removal of Nitrogen by biological Nitrification/Denitrification ... 8
1.3. Removal of Phosphorus ... 9
2 OBJECTIVES ... 12
3 SYSTEM DESCRIPTION ... 13
3.1. Description of the system ... 13
3.2. Flow diagram ... 14
3.3. Description of equipments ... 15
4 PROCESS AND METHODS ... 18
4.1. Collecting inoculum of activated and return sludge ... 18
4.2. Synthetic waste water ... 18
4.3. Methods ... 19
4.3.1 Nitrate ... 20
4.3.2 Orthophosphate ... 20
4.3.3 Dissolved oxygen and pH ... 20
5 RESULTS ... 22
6 DISCUSSION AND CONCLUSIONS ... 26
ABBREVIATIONS AND TERMS
P Phosphorus
N Nitrogen
NH4+ Ammonia
NO3- Nitrate
NO2- Nitrite
BOD Biological Oxygen Demand
COD Chemical Oxygen Demand
1 INTRODUCTION
Wastewater is any water that has been modified by human action making it inappropri-ate or dangerous for human consumption, industry, agriculture, etc. Different types of wastewater can be defined according to the source and contaminants of them: domestic wastewater, industrial wastewater, agricultural wastewater, and storm wastewater. (Torre, R., 2014)
Domestic wastewater contains mainly organic matter (proteins, lipids, carbohydrates, etc), phosphorus, solids, ammonia, pathogens; industrial wastewater is characterized by chemicals, hydrocarbons, etc; agricultural wastewater contains mostly pesticides and fertilizers; and storm wastewater is based on rainfall and snowmelt. (Torre, R., 2014)
The main problem of the wastewater is the high amount of carbon, nitrogen and phos-phorus, which causes the consumption of dissolved oxygen and the eutrophication of lakes and rivers. Eutrophication means a nutrient enrichment of an ecosystem, it is a massive supply of nutrients in an aquatic ecosystem. Eutrophication comes from the excess of supply of nutrients, which leads the extremely fast growth of plants and algae that, when these organisms die, they consume oxygen in the water, creating an anoxic state.
This is the reason why wastewater treatment is necessary. (Torre, R., 2014)
1.1.Wastewater Treatment
The secondary treatment is based on the removal of the organic matter (BOD) and nu-trients. Chemical and biological processes are used in this phase. The common proc-esses used are lagooning (small scale), activated sludge systems and trickling biofilters. Finally there may be a tertiary treatment in which pathogens are removed.
Picture 1. Block diagram (Picture modified of Raul Muñoz, 2014)
1.2.Removal of Nitrogen by biological Nitrification/Denitrification
The removal of Nitrogen in standard wastewater treatment plant is based on the conver-sion of organic and inorganic N (NH4+, NO3-, NO2-) into N2, which is released into the
atmosphere.
This process is the most widely used because of: high potential removal efficiency, high process stability and reliability, relatively easy process control, low land area require-ments and moderate cost. (Tchobanoglous & Burton, 1991)
Nitrification is a biological process in which ammonia or ammonium are oxidized to nitrite or nitrate. This process is slow and sensitive to environmental conditions such as low temperatures, presence of heavy metals and high concentration of NH3.
Regarding to pH, optimal nitrification happens between 7.5 and 8, and a pH of 7 to 7.3 is usually used.
Two groups of bacteria are necessary; in a first step, ammonia is oxidized to nitrite by
groups of bacteria are autotrophic. The impact of the nitrification during the aerobic treatment is the increase of the demand of O2 and the increase of the production of
sludge (less significant). (Torre, R., 2014)
Denitrification is based on the reduction of nitrate to nitrous oxide, nitric oxide and ni-trogen gas. Two kinds of denitrification process can be used as it can be observed in Picture 2. The most common process is that which consists of an anoxic chamber where denitrification occurs followed by an aerobic chamber where nitrification happens and a final chamber to separate effluent and sludge, a part of this sludge will be recirculated and the other part is a system outflow. The other process consists of an aerobic tank before the anoxic tank and, as in the previous process, a chamber to separate effluent and sludge. (Tchobanoglous & Burton, 1991)
Picture 2. Different nitrogen removal processes (Tchobanoglous & Burton, 1991)
1.3.Removal of Phosphorus
Phosphorus removal can be done in two ways, chemically and biologically.
It occurs in two stages. First stage is an anaerobic process: Acetate is released as a product of fermentation of organic matter or chemical oxygen demand (COD). PAOs assimilate acetate as polyhydroxybutyrate (PHB) using the stored energy in the links of P present in the internal polyphosphate reserves, and PO43- is released to the
extracellu-lar medium. The second stage is an aerobic process where the stored PHB is metabo-lized as an energy source in the presence of O2 and new cellular material is formed. The
energy produced is stored as polyphosphates. The biomass removal process involves the removal of P. (Torre, R., 2014)
There are several typical processes in the phosphorus treatment such as Anoxic/Oxic (A/O) Process, PhoStrip Process and Sequencing Batch Reactor, etc.
Regarding to the chemical elimination, chemicals are added to wastewater in order to produce insoluble salts when reacting with phosphorus. The typical chemicals used to achieve the aim are alum, sodium aluminate, ferric chloride or sulphate and lime.
Factors which affects the choice of the chemical for the treatment are: influent phospho-rus level, wastewater suspended solids, alkalinity, chemical cost, reliability of chemical supply, sludge handling facilities, ultimate disposal methods and compatibility with other treatment processes. (Tchobanoglous & Burton, 1991)
Reactions during the precipitation and chemical species in sludge according to Tcho-banouglus & Burton,1991.
- Lime
- Alum
- Iron Fe (III)
2 OBJECTIVES
The aims of this project are taking the laboratory-scale wastewater treatment plant into use, make test runs by changing factors of pH, flow rate, oxygen concentration and dos-ing of coagulant and analyze the wastewater quality focusdos-ing on nutrient removal, and making user instructions for the device.
As it is previously discussed in Introduction Chapter, the nutrient removal is carried out by chemical and biological processes.
3 SYSTEM DESCRIPTION
3.1.Description of the system
As in the real wastewater treatment plants, in the pilot plant wastewater is purified by chemical, biological and mechanical processes. Four modules can be identified:
The first chamber is the pre-clarification, this module is used when wastewater contains a large amount of organic and solid matter, which sediments by gravity. Due to the rec-ipe used to create synthetic wastewater, this does not contain large amounts of organic and solid matter so this chamber is bypassed.
Next step is the denitrification chamber, as the name of the module expresses, the proc-ess of denitrification happens here by which nitrate (NO3-) and nitrite (NO2-) become in
nitrogen. Denitrification involves anoxic conditions which are fulfilled as the oxygen concentration is around 0.13 mg/L.
Chemical action is carried out in this chamber since coagulant and sodium hydroxide are added.
The coagulant used is a coagulant based on ferric sulphate, its trade name is PIX. Using this coagulant, the highest maximum adsorption of phosphorus is achieved. (Smoczyn-ski et al., 2014)
Biomass formed in the aeration tank and inorganic precipitates from the clarification module are recirculated to this chamber.
Third module is the aeration/nitrification chamber where activated sludge is found, op-timal condition for growth is an oxygen concentration of 3-4 mg/L according to instruc-tions given by pilot wastewater treatment plant manual, in order to fulfil this condition airflow is continuously bubbled into the module. Air flow is controlled by a valve and the pressure that arrives from air system. Activated sludge is collected from Hatanpää wastewater treatment plant.
3.2.Flow diagram
In this chapter, the system is presented as a flow diagram in which the different flows between chambers and instrumentation can be observed in Picture 3.
The instrumentation in the system consists of a valve, pumps, sensors indicators and aerators, which are represented by their symbols.
3.3.Description of equipments
In this section, all the equipment is described. All the equipment has a purpose which will be explained in the individual description of each equipment. The system equip-ment can be observed in Picture 4.
Picture 4. Working place (Miguel Rodríguez del Egido, 2015)
The different parts that make up the system are: The Pilot Plant which is the main part of the system where the purification process is carried out, it is divided in different chambers as it can be observed in Picture 5.
There are different kind of pumps, one of them is the Solenoid Metering Pump, Promi-nent Beta b 5, which is the pump used to inject air into the system in order to keep clean the aerators and provide an extra supply of air, it can be seen in Picture 6. Another are the Peristaltic Pumps, Watson Marlow 520u which are used to boost the synthetic water along the system, they can be observed in Picture 7. The other type of pump is Grundfos Alldos dda, these pumps are used to boost the coagulant and NaOH to the denitrification chamber and are shown in Picture 8.
Picture 6. Air pump (Miguel Rodríguez del Egido, 2015)
The rest of the system consists of a bucket, with a volume of 80L, which is the space from which synthetic waste water is injected into the system. The Controller Hach Lange sc200 is the controller which collects data of oxygen and pH from different sen-sors and displays it. The dissolved oxygen sensor, Hach Lange LDO Sensor is the in-strument which measures the oxygen in the aeration/nitrification chamber. The last equipment is a pH Sensor, Hach Lange phD sc Digital Differential pH/ORP Sensor is the device which measures the pH in the aeration/nitrification chamber.
4 PROCESS AND METHODS
4.1.Collecting inoculum of activated and return sludge
An important action is to collect the inoculum, from the conventional wastewater treat-ment plant, which will be used in the pilot plant and containing the necessary microor-ganisms to carry out the biological process. Half a litre of activated sludge and return sludge were collected each time.
For this objective, containers such as those that appear in Picture 9 are used.
Picture 9. Collecting samples in wastewater plant (Google Images)
4.2.Synthetic waste water
During the realization of the experiments, two different recipes have been used to make synthetic water. The first one was composed, for 6 litres, of 1300 grams of treacle, 22 grams of urea, 25 grams of dishwater and fill with water to 6 litres. The second recipe was composed, for 900 litres, of 900 grams of glucose or sugar, 42.9 grams of urea, 1161.7 grams of a commercial product called BioBact, 40 grams of sodium hydrophos-phate and fill with water to 900 litres.
Picture 10. Some components of the recipe (Miguel Rodríguez del Egido, 2015)
4.3.Methods
The methods used have helped to measure nitrate, phosphorus, and pH and dissolved oxygen. Whatever it was the substance to be measured, there have always been a num-ber of common steps.
The first step is to collect a representative sample of the different modules from the pilot plant as it is shown in Picture 11.The numbers observed in the beakers correspond to a simplified way to differentiate the samples that have been taken from different cham-bers. The number 1 is the synthetic wastewater, number 2 is denitrification chamber, number 3 is aeration/nitrification chamber and finally number 4 is from clarification chamber. The following step is to prepare the sample to bring them to the centrifuge, they are taken to the centrifuge so that the solids settle to the bottom, and thereby the solids do not interfere with the results. The samples have been treated in the centrifuge with 2000 rpm for 5 minutes.
The following analyzing methods have been used to measure several parameters.
4.3.1Nitrate
Nitrate has been analysed with Spectrophotometer HACH Lange DR 2800 according to Cadmium Reduction Method by which cadmium metal reduces nitrates in the sample to nitrite. Complete instructions can be found in HACH DR 2800 Procedures Manual, Method 8039, Nitrate. This device can be observed in Picture 12.
Picture 12. Spectrophotometer HACH (Miguel Rodríguez del Egido, 2015)
4.3.2Orthophosphate
Orthophosphate has been analysed with Spectrophotometer HACH Lange DR 2800 according to PhosVer 3 (Ascorbic Acid) Method by which orthophosphate reacts ob-taining finally an intense blue colour. Complete instructions can be found in HACH DR 2800 Procedures Manual, Method 8048, Phosphorus Reactive (Orthophosphate). This spectrophotometer can be observed in Picture 12.
4.3.3Dissolved oxygen and pH
Sensor, and monitored with Hach Lange sc200. The controller displays the data on a screen like the one shown in Picture 13.
5 RESULTS
The results obtained during the experiments will be developed in this section.
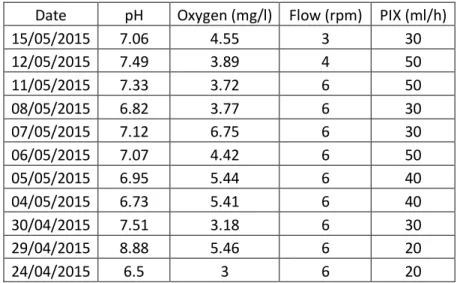
Oxygen and pH have been measured in aeration/nitrification chamber. These variables are less important in others chambers, even though they have been measured. The measured oxygen in the denitrification module was 0.13 mg/l. The influent conditions were 0.14 mg/l O2 and pH 6.25. The conditions under which the experiments have been
carried out can be observed in Table 1.
Table 1. Working conditions
Date pH Oxygen (mg/l) Flow (rpm) PIX (ml/h) 15/05/2015 7.06 4.55 3 30 12/05/2015 7.49 3.89 4 50 11/05/2015 7.33 3.72 6 50 08/05/2015 6.82 3.77 6 30 07/05/2015 7.12 6.75 6 30 06/05/2015 7.07 4.42 6 50 05/05/2015 6.95 5.44 6 40 04/05/2015 6.73 5.41 6 40 30/04/2015 7.51 3.18 6 30 29/04/2015 8.88 5.46 6 20
24/04/2015 6.5 3 6 20
Table 2. Concentrations obtained from the different modules Date SAMPLE NO3-N (mg/l) PO4 (mg/l) PO4-P (mg/l)
15/05/2015
Influent 11 38.4 12.52 Denitrification 6 29.4 9.58
Aeration 9 27.8 9.06
Effluent 7 28.4 9.26
12/05/2015
Influent 5.25 15.2 4.96 Denitrification 4 21.6 7.04
Aeration 5 23.2 7.56
Effluent 3 24.8 8.08
11/05/2015
Influent 3.5 24.8 8.08 Denitrification 4 26.2 8.54
Aeration 8 26.4 8.61
Effluent 4 30 9.78
08/05/2015
Influent 2.75 31.9 10.39 Denitrification 5 31.3 10.20 Aeration 11 34.9 11.38
Effluent 7 29.4 9.58
07/05/2015
Influent 2.5 37.9 12.36 Denitrification 6 29.1 9.49
Aeration 12 30.3 9.88
Effluent 9 30.6 9.98
06/05/2015
Influent 2.25 40.4 13.17 Denitrification 5 30.9 10.07
Aeration 9 28.8 9.39
Effluent 4 27.7 9.03
05/05/2015
Influent 6 66 21.52
Denitrification 4 20.5 6.68
Aeration 5 21.2 6.91
Effluent 2 24.3 7.92
04/05/2015
Influent 4.25 352 11.48 Denitrification 1 30.5 9.94
Aeration - 23.6 7.69
Effluent - 24.7 8.05
30/04/2015
Influent 3.25 33.2 10.82 Denitrification 2.25 17.7 5.77
Aeration 1,5 13.9 4.53
Effluent 1.5 13 4.24
29/04/2015
Influent 3.25 33.2 10.82 Denitrification 2.25 9.1 2.97
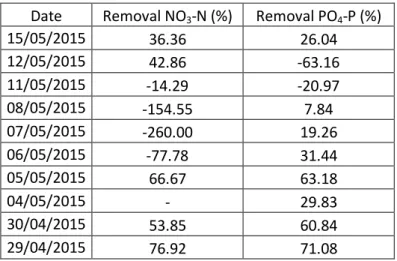
Once the values have been obtained, the percentage of removal is calculated and is shown in Table 3. As it can be seen in the following table, there are positive and nega-tive percentages which mean if removal exists or not being a neganega-tive percentage that there is no removal.
Regarding to phosphates, in most experiments there is elimination, either higher or lower, while in the case of nitrates there are more variations between the results.
Table 3. Percentage of removal of nitrates and phosphates Date Removal NO3-N (%) Removal PO4-P (%)
15/05/2015 36.36 26.04 12/05/2015 42.86 -63.16 11/05/2015 -14.29 -20.97 08/05/2015 -154.55 7.84 07/05/2015 -260.00 19.26 06/05/2015 -77.78 31.44 05/05/2015 66.67 63.18
04/05/2015 - 29.83
30/04/2015 53.85 60.84 29/04/2015 76.92 71.08
Picture 14. Initial NO3-N and PO4-P concentrations
0 5 10 15 20 25
1 2
3 4
5 6
7 8
9 10
Initial concentrations
6 DISCUSSION AND CONCLUSIONS
Many experiments have been performed giving some results that are discussed below, but many more should be done to a greater understanding of the system.
Although it cannot be measured or observed by any values presented, in any of the ex-periments, the increase of coagulant PIX used has direct results on the visible purifica-tion of the wastewater. The more coagulant used, the water is more transparent.
Oxygen must be regulated accordingly to prevent anoxic conditions in denitrification module and to maintain aerobic conditions in aeration/nitrification module. These an-oxic conditions are given with an oxygen concentration below 0.4 mg/l. A special atten-tion to this parameter is required since oxygen needs change as the process advances since there is an evolution of microorganisms. Initially microorganisms need a certain amount of oxygen and as they grow this amount changes being increased until stabilize.
According to Pictures 15, 16 and 17 nitrogen has variable results; it can be seen that there is no elimination of nitrates in some cases but it increases in others. This does not mean that there is no nitrogen removal, it is simply that the nitrate concentration varies. This low correlation between what has to happen in theory, which is the nitrogen re-moval, and what happens, that is ambiguous and unrepeatable results, may be due to several reasons: first, it may be due to a unsatisfactory sample collection, not having collected a representative sample from the pilot plant; second, it may be caused by inef-ficient working conditions; third, it may be due to an improper use of methods of analy-sis.
Picture 15. Tracing NO3-N concentration when PIX=30mg/l.
Picture 16. Tracing NO3-N concentration when PIX=40mg/l.
It can be observed the different tracing in each experiment. 0 2 4 6 8 10 12 14
0 2 4 6
Variation NO3-N when PIX = 30 ml/h
Flow 3 rpm, ph 7,06, O2 4,55 mg/l
Flow 6 rpm, ph 6,82, O2 3,77 mg/l
Flow 6 rpm, ph 7,12, O2 6,75 mg/l
Flow 6 rpm, ph 7,51, O2 3,18 mg/l 0 1 2 3 4 5 6 7
0 2 4 6
Variation NO3-N when PIX = 40 ml/h
Picture 17. Tracing NO3-N concentration when PIX=50mg/l.
The longer retention time of the wastewater in the pilot increases the clarity of the result water, this is because microorganisms have more time for the process.
As it is shown in Pictures 18, 19 and 20, in most experiments, phosphorus removal has been carried out with adequate success. In contrast to the case with nitrogen, there is no possible confusion with the forms of phosphorus so the system works properly.
Picture 18. Tracing PO4-P concentration when PIX=30mg/l.
Among the small differences in working conditions, a better removal is achieved when pH is around 7 and 7.5, and an oxygen concentration between 3.5 and 5 mg/l.
0 1 2 3 4 5 6 7 8 9 10
0 2 4 6
Variation NO3-N when PIX=50 ml/h
Flow 4 rpm, pH 7,49, O2 3,89 Flow 6 rpm, pH 7,33, O2 3,72 Flow 6 rpm, pH 7,07, O2 4,42
0 2 4 6 8 10 12 14
0 2 4 6
Variation PO
4-P when PIX = 30
ml/h
Picture 19. Tracing PO4-P concentration when PIX=40mg/l.
Picture 20. Tracing PO4-P concentration when PIX=50mg/l.
This experimental project should be continued. As it is said before, nitrogen results are ambiguous, this is because only nitrate has been measured. Nitrate has been measured but not ammonia or total nitrogen so we do not have a clear impression of how the sys-tem is able to remove the different forms of nitrogen in each step.
To avoid confusions it is necessary to measure ammonia or total nitrogen. Other meth-ods of analysis and more data and measurements are required.
Regarding to phosphorus, good results about removal percentage are achieved, however as in the case of nitrogen, more information is needed so more experiments are required.
0 5 10 15 20 25
0 2 4 6
Variation PO
4-P when PIX = 40
ml/h
Flow 6 rpm, ph 6,95, O2 5,44 mg/l
0 2 4 6 8 10 12 14
0 2 4 6
Variation PO
4-P when PIX=50
ml/h
REFERENCES
Tchobanoglous, G. & Burton, F. 1991. Wastewater Engineering. Treatment, disposal and reuse. 3rd edition. Metcalf & Eddy.
Torre Muñoz, Raul. Slides Environmental Engineering. 2014.
Smoczynski, L., Munska K.T., Kosobucka M., Pierozynski B. 2014. Phosphorus and COD removal from chemically and electrochemically coagulated wastewater.
Binnie, C., Kimber, M., Smethurst, G. 2006. Basic water treatment, Cambridge Royal Society of Chemistry.
Singh Sarai, D. 2006. Water treatment made simple for operators, Wiley.
Thomas, G., & King, R. 1991. Advances in water treatment and environmental man-agement, Elsevier.
HACH DR 2800 Procedures Manual. Method 8048 Phosphorus Reactive (Orthophos-phate).
HACH DR 2800 Procedures Manual. Method 8039 Nitrate.
Pilot Wastewater Treatment Plant Instructions.
García Encina, P., Rodríguez Rodríguez, E. A study at microbiological and process lev-el of the interactions between nitrification-denitrification and biological phosphorus removal in wastewater treatment.
Crittenden, J., Rhodes Trussell, R., Hand, D., Howe, K., Tchobanoglous, G. 2012. Wa-ter Treatment: Principles and Design. 3rd edition. Wiley
Davis, M. & Cornwell, D. 2012. Introduction to Environmental Engineering. 5th edition. McGraw-Hill.
Wiesmann, U. Biological nitrogen removal from wastewater.
Surmacz-Gorska, J., Cichon, A., Miksch, K. Nitrogen removal from wastewater with high ammonia nitrogen concentration via shorter nitrification and denitrification.
Kuba, T., Van Loosdrecht, M.C.M., Heijnen, J. Phosphorus and nitrogen removal with minimal COD requirement by integration of denitrifying dephosphanation and nitrifica-tion in a two-sludge system.
Brdjanovic, D., Slamet, A., Van Loosdrecht, M.C.M., Hooijmans, C., Alaerts, G.J., Heijnen, J.J. 1998. Impact of excessive aeration on biological phosphorus removal from wastewater.