Copyright © Mineralogical Society of America
1529-6466/12/0074-0005$05.00 DOI: 10.2138/rmg.2012.74.5
Rietveld Quantitative Phase Analysis of OPC Clinkers,
Cements and Hydration Products
Miguel A. G. Aranda,* Ángeles G. De la Torre
Departamento de Química Inorgánica, Cristalografía y Mineralogía Universidad de Málaga
29071 Málaga, Spain
email: [email protected]
Laura León-Reina
Servicios Centrales de Investigación Universidad de Málaga
29071 Málaga, Spain
BRIEF INTRODUCTION
It has been more than twenty years since the excellent volume of Reviews in Mineralogy dedicated to Modern Powder Diffraction was published (Bish and Post 1989). That volume contained a series of key articles ranging from the basic of powder diffraction to sample preparation and synchrotron and neutron powder diffraction. Within that volume, quantitative phase analysis was extensively discussed in a specific chapter (Snyder and Bish 1989). Snyder and Bish (1989) discussed the Reference Intensity Ratio approach (also known as Chung method), the method of standard additions (also known as spiking method) and the full pattern-fitting approach using both the Rietveld method and the observed patterns method. The reader is referred to that volume for the basics of powder diffraction, and to the specific chapter by Snyder and Bish (1989) for the history of quantitative phase analysis from powder diffraction and for a discussion or the early findings. Quantitative phase analysis by X-ray powder diffraction dates back to 1925 (Navias 1925). In this work, the amount of mullite obtained by firing selected clays (and a feldspar) was determined by the direct comparison of the intensities of two diffraction lines of the fired samples with those of pure mullite. The patterns were recorded on photographic negatives after an X-ray exposure of 165 hours (almost a week).
analysis. Furthermore, the key paper “Rietveld refinement guidelines” (McCusker et al. 1999), supported by the International Union of Crystallography, did not dedicate a section to RQPA.
On the other hand, building materials, such as ordinary Portland cements (OPCs), are very complex samples of worldwide importance, hence quantitative knowledge of their mineralogical composition is necessary to predict performances (Taylor 1997). Ultimately, the assemblage of crystalline phases, and not the bulk chemistry, determines cement features. In fact, the hydraulic properties of a mortar/concrete mainly depend on the cement mineralogical composition and its texture (Bentz 2008; Skibsted and Hall 2008; Scrivener and Nonat 2011).
The most widely used method of estimating the potential phase composition of Portland cement in cement plants is the Bogue calculation from its elemental analysis usually determined by X-Ray Fluorescence, XRF (Bogue 1929; Taylor 1989). However, it is well known that the phase abundance calculated by this indirect approach may be quite far from the true values. This is due mainly to three reasons: i) the four main clinker phases are solid solutions with compositions significantly different from the stoichiometric pure-phases; ii) there is no certainty of attaining equilibrium conditions (both in the kiln and for sure in the cooling process, Hong et al. 2001); iii) the presence of minor phases. As an alternative approach, RQPA allows a direct measurement of the phase content of cements. So, on-line systems for RQPA of clinkers and cements are becoming widespread. However, we will not deal here with on-line RQPA at cement plants. The reader is addressed to specific publications dealing with this subject including reproducible sample preparation, fast data acquisition and fast-and-robust data analysis (Moller 1998; Manias et al. 2001; Scarlett et al. 2001; Fullmann and Walenta 2003; Paul et al. 2004; Enders and Berger 2007; De la Torre et al. 2011).
Therefore, this review focuses on the use of RQPA for understanding OPC clinkers, cements and pastes, at central laboratories. It must be highlighted that a very recent review article has been dedicated to the application of the Rietveld method to the analysis of anhydrous cements (Le Saout et al. 2011). Furthermore, a second broad article dealing with direct determination of phases in OPCs by quantitative X-ray powder diffraction has also been reported (Stutzman
2011). Hereafter, cement nomenclature will be used, i.e., C = CaO, S = SiO2, A = Al2O3, F =
Fe2O3, M = MgO, S = SO3, C = CO2, H = H2O, K = K2O and N = Na2O. Hence, typical cement
phase such as alite (Ca3SiO5), belite (Ca2SiO4), tricalcium aluminate (Ca3Al2O6), calcium
aluminoferrate (Ca4Al2Fe2O10), gypsum (Ca2SO4·2H2O) or calcite (CaCO3) are abbreviated
as C3S, C2S, C3A, C4AF, CSH2 and CC, respectively. Most cement compounds are not pure
stoichiometric phases but they may incorporate many ions as extensively discussed (Taylor 1997; Le Saout et al. 2011). In addition, AFm and AFt set of phases should be defined. AFm
stands for the abbreviation for “alumina, ferric oxide, mono-sulfate” or “Al2O3-Fe2O3-mono”,
in the same way AFt stands for a similar abbreviation but “tri-sulfate” or “Al2O3-Fe2O3-tri”.
The AFm phase refers to a family of hydrated calcium aluminates based on the hydrocalumite
structure, Ca4Al2(OH)12·[Cl(OH)]·6H2O. The archetype AFm phase is C3A·CaSO4·12H2O or
Ca4Al2(OH)12·[SO4]·6H2O, known as Kuzelite, but Al can be partly replaced by Fe and SO42−
can be partly or fully replaced by OH−, CO
32− and other anions (Pollmann 2006, Matschei
et al. 2007a). The different hydration stages strongly influence the X-ray powder diffraction patterns (Pollmann 2007; Balonis and Glasser, 2009). By far the most common AFt phase is
ettringite which has the following stoichiometry C3A·3CaSO4·32H2O that can also be written
as Ca6Al2(SO4)3(OH)12·26H2O.
THE RIETVELD METHOD
microstructure. The reader is referred to the two most recent books in “Powder Diffraction” to expand on that (Pecharsky and Zavalij 2005; Dinnebier and Billinge 2008). The Rietveld method is a technique devised by Hugo Rietveld in the late sixties (Rietveld 1967, 1969) for a deeper characterization of polycrystalline compounds by treating in a “better/different” way the powder diffraction patterns.
The very original contribution of the Rietveld method to powder diffraction was its
conceptual breakthrough: “To use measured powder pattern intensities instead of reflection
(peak) intensities.” This conceptual breakthrough, together with the coming of computers,
allowed to properly dealing with strongly overlapping reflections. The introduction of this technique was a significant step forward in the diffraction analysis of crystalline powder samples. The powder diffraction analysis at that moment worked with extracted reflection intensities which was a very serious difficulty in the case of overlapping reflections.
The Rietveld (whole-profile) method uses a least squares approach to optimize a theoretical line profile until it matches in the best possible way the measured sample powder
diffraction profile (see Eqn. 1); where Sy is the function to be minimized, wi is the statistical
weight, and yi(obs) and yi(cal) are the observed and calculated powder diffraction intensities
for the i-point of the powder pattern, respectively.
=
∑
− 2(obs) (cal) (1)
y i i i
i
S w y y
The calculated intensity, yi(cal), for each point of the powder pattern, 2qi, is obtained as
the sum of the contribution of all reflections (k) which give intensity to that i-point above the
background, yb(2qi), see Equation (2):
a
= q +
∑
2 q − q q(cal) (2 ) (2 2 ) (2 ) (2)
i b i k k i k i k
k
y y S m F h Lp P
where Sa is the scale factor for the pure crystalline a-phase to be studied, k stands for the
reflections which contribute to that point of the pattern, mk is the multiplicity of that reflection,
Fk is the structure factor of that reflection, h(2qi−2qk) is the function that distributes the intensity
of that reflection in a given 2q range, Lp(2qi) stands for the Lorentz and polarization correction,
and Pk stands for additional corrections that may be needed (preferred orientation, extinction,
etc.).
Equation (2) may be extended to a sample containing m-crystalline phases, see Equation
(3), by summing up the contribution of every crystalline phase.
=
= q +
∑ ∑
2 q − q q1
(cal) (2 ) m (2 2 ) (2 ) (3)
i b i i k k i k i k
i k
y y S m F h Lp P
In this review article, we will focus on the viiith-application, quantitative phase analysis.
We address the reader to some selected books and papers for a deeper insight of the role of the Rietveld method in the remaining applications (Young 1993; McCusker et al. 1999; David et al. 2002; Shin et al. 2002; Fitzpatrick and Lodini 2003; Balzar et al. 2004; Pecharsky and Zavalij 2005; Kaduk 2007a,b; Dinnebier and Billinge 2008; David and Shankland 2008; Soleimanian and Aghdaee 2008; Markvardsen et al. 2008). Finally, new ways of learning are being explored. In addition to books, papers and training in laboratories with proven experience, other methods are emerging. If the reader is keen of using internet-distributed audio/visual material, then the following references are a good starting point (Toby 2007, 2010).
General issues
For a successful Rietveld quantitative phase analysis, several steps have to be fulfilled. Initially, sample has to be properly prepared and this will depend upon the nature of the sample itself and the diffractometer where the data will be taken. This will be briefly discussed in a later section. Secondly, the diffractometer should be well aligned and maintained. Different optical configurations are possible in modern diffractometers and the optimal set-up should be used. Under these two pre-requisites, a good powder diffraction pattern may be taken and RQPA can be carried out. It must be highlighted that the results of any analysis cannot be better than the raw data. Therefore, a lot of care is needed in these two initial steps in order not to spend/waste a lot of time in data analysis/evaluation without conclusive results.
Once good powder diffraction data have been taken, a third step follows: qualitative phase analysis. Every crystalline phase in the sample should be identified. This is easy to say but sometimes quite complex to fulfill. The strong peak overlapping in the diffraction patterns does not allow to conclusively determining all phases present in some cases. Then a possible strategy follows, we compute the RQPA with the phases which are clearly present in the pattern and, from the net intensity in the difference curve, the remaining low-content phases are determined. Alternatively, a trial-and-error method can be used. In addition to the main, clearly-observed phases, dubious phases are added to the Rietveld calculation and its absence/ presence can be individually estimated.
In any case, when the main (all) phases are identified, the fourth step is to carry out the RQPA with the appropriate software. A full list, and discussion, of the programs available for this task is out of the scope of this paper. However, we can suggest the ccp14 web site for a
list of Rietveld programs (http://www.ccp14.ac.uk/solution/rietveld_software/index.html) and
mention that GSAS (Larson and von Dreele 1994; Toby 2001) and FULLPROF (Rodriguez-Carvajal 1993; Roisnel and Rodriguez-(Rodriguez-Carvajal 2001) are the widest used packages. Many other packages can also be used for RQPA and we underline just a few: BGMN, SIROQUANT, TOPAS and HighScore Plus. In any case, in addition to the raw data, any Rietveld program needs a control file to execute the refinements. In this control file, the crystal structures of the different components must be included. The fit is carried out by optimizing all appropriate variables such as: i) scale factor of every crystalline phase; ii) background parameters for the chosen function; iii) unit cell parameters for every crystalline phase; iv) peak shape parameters for every computed phase; and finally, v) correction parameters which may be phase-dependent (such as preferred orientation, extinction, etc.) or pattern-dependent (zero-shift, absorption correction when working in transmission geometry, etc.). Usually, for RQPA the structural descriptions (atomic positional parameters, atomic displacement parameters and occupation factors) are not optimized but kept as reported in the structural studies.
The application of RQPA to clinkers/cements/pastes is not straightforward for the following reasons: i) there are many phases, usually more than five, which increases the diffraction peak overlapping and so the correlations; ii) each phase has its own mass absorption coefficient which may yield the microabsorption problem (see below); iii) the small mean penetration
depth of X-rays (~30 mm for Cu Ka, 1.54 Å) implies that only a thin layer is analyzed in the
Bragg-Brentano q/2q geometry which may lead to poor particle statistics; iv) some phases,
for instance alite or gypsum crystallize as plaques which show preferred orientation and so increases the errors; v) phases can crystallize as several polymorphs that must be identified a priori; vi) the diffraction peak broadening for some phases may be anisotropic and it must be properly model; and vii) the atomic impurities inside each phase are not known and their scale factors are computed for ideal/stoichiometric phases. In any case, this method has several advantages over other methods based on powder diffraction and other technologies (microscopy, thermal analysis, etc.). A comparison between RQPA results and those obtained with alternative/complementary technologies will be given below.
The direct output of the RQPA is a set of scale factors, one for every crystalline phase within the mixture with computed crystal structures. In addition, several other parameters may be of interest: i) unit cell parameters (to have an idea of the existence of solid solutions); ii) preferred orientation of some phases (to have an insight of the particle shapes of these phases); iii) peak shape widths to know about the microstructures. The key transformation of the phase scale factors to phase contents is discussed in a section below. However, it must be highlighted that the best available structural description should be used in order to extract the best possible scale factor value for every phase. This is evaluated by the flatness of the difference curve and also by obtaining low Rietveld-disagreement indices (R-factors). However, the lowest R-factors may also be obtained for wrong analysis. So, it is important to optimize those parameters that allow their minimization without excessive correlations. It is also important to understand the definitions for R-factors which are discussed in standard papers (Young 1993; McCusker et al. 1999). However, a much personal view has been reported (Toby 2006) which was mainly dedicated to the refinement of crystal structures but some concerns and discussions are of overall interest.
Structural description of the phases present in OPC materials
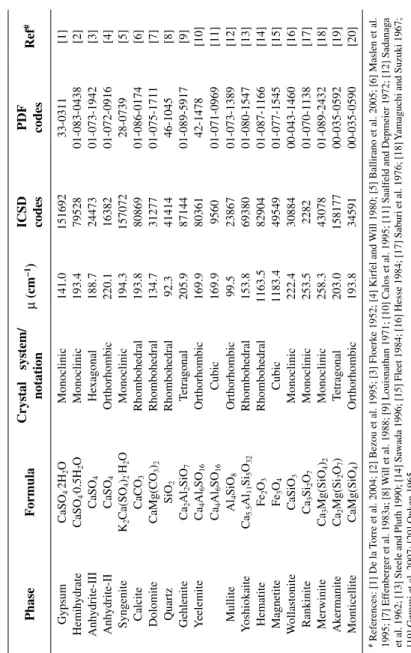
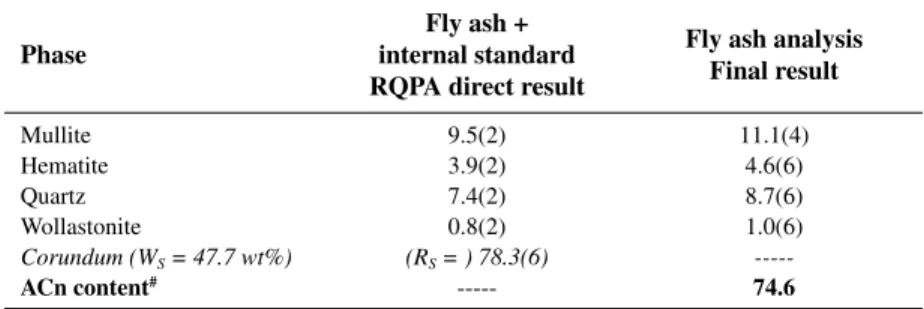
The main clinker phases are alite, belite and aluminate in white Portland clinkers and also ferrite in grey Portland clinkers. In addition several other minor phases may be present: lime, periclase, arcanite, aphthitalite and others, see Table 1. An excellent review about the phases present in OPC clinkers has been very recently published (Le Saout et al. 2011). We want to draw the attention that several issues are discussed in that paper including the selection of the alite polymorph, the implications of the Fe/Al ratio in ferrite quantification, and the consequences of the solid solution existence in most clinker phases (small change in the structure factors and densities of the analyzed phases).
Portland cements are fabricated by adding a setting regulator to the clinker. The sulfate
phases added for this purpose may be gypsum (CaSO4·2H2O), hemihydrate (CaSO4·½H2O)
also known as bassanite or anhydrite (CaSO4). Different Portland cements may have different
additions, for instance calcite (CaCO3) or quartz (SiO2). Additionally, other highly-amorphous
materials may be added for blended cement and concrete production such as blast furnace slag (BFS), pulverized fly ash (PFA) or pozzonale minerals. It must be kept in mind that these additions also contain some crystalline phases (for instance mullite or hematite) that must be quantified in blended cements. Table 2 gives a list of additional phases that may be present in (blended) OPC cements.
Table 1.
Structural details for phases that may be present in OPC clink
ers. Phase F ormula Crystal system/ notation m (cm −1) ICSD codes PDF codes Ref # Alite Ca 3 SiO 5 -Mg,Al Monoclinic/M 3 310.4 94742 01-070-8632 [1] Ca3 SiO 5 -Mg T riclinic/T 3 308.5 162744 [2] Ca 3 SiO 5 T riclinic/T 1 304.6 4331 01-070-1846 [3] Belite Ca 2 SiO 4 Monoclinic/ b 299.9 81096 01-086-0398 [4] Ca 2 SiO 4 Orthorhombic/ a′ 298.1 81097 01-086-0399 [4] Ca 2 SiO 4 Orthorhombic/ g 268.2 81095 01-086-0397 [4] Aluminate Ca 3 Al2 O6 Cubic 277.1 1841 01-070-0839 [5] Ca 8.5 NaAl 6 O18 Orthorhombic 278.9 100220 01-083-1359 [6] Ca8.25 Na 1.5 Al6 O18 Monoclinic 246.5 100221 01-083-1360 [6] Ferrite Ca 2 AlFeO 5 Orthorhombic 502.8 9197 01-071-0667 [7] Lime CaO Cubic 401.2 52783 01-071-4121 [8] Periclase MgO Cubic 99.5 9863 01-071-1176 [9] Arcanite K2 SO 4 Orthorhombic 219.9 79777 01-083-0681 [10] Aphthitalite K3 Na(SO 4 )2 Rhombohedral 195.4 26018 01-074-0398 [11] Thenardite Na 2 SO 4 Orthorhombic 73.0 81506 00-037-1465 [12] Ca-Langbenite Ca2 K2 (SO 4 )3 Orthorhombic 209.1 040989 01-074-0404 [13] Sulf ate-spurrite Ca5 (SiO 4 )2 (SO 4 ) Orthorhombic 255.6 085123 01-088-0812 [14] Ellesteadite Ca 10 (SiO 4 )3 (SO 4 )3 Cl2 He xagonal 272.7 154205 00-041-0479 [15] Fluorellesteadite Ca 10 (SiO 4 )3 (SO 4 )3 F2 He xagonal 261.8 97203 01-072-7301 [16] Mayenite Ca 12 Al14 O33 Cubic 198.6 241243 70-2144 [17]
# References: [1] De la
Torre et al. 2002; [2] De la
Torre et al. 2008; [3] Golo
vastik
ov et al. 1975; [4] Mumme et al. 1995; [5] Mondal and Jef
fry 1975; [6]
Tak
euchi et al. 1980; [7] Colville and Geller 1971; [8] Smith and Leider 1968; [9] Sasaki et al. 1979; [10] Ojima et al. 1995; [
11] Okada and Ossaka 1980;
[12] Rasmussen et al. 1996; [13] Speer and Salje 1986; [14] Irran et al. 1997; [15] Saint-Jean and Hansen 2005; [16] P
ajares et al. 2002; [17] P
alacios et al.
Table 2.
Structural details for additional phases that may be present in OPC (blended) cements.
Phase F ormula Crystal system/ notation m (cm −1) ICSD codes PDF codes Ref # Gypsum CaSO 4 .2H 2 O Monoclinic 141.0 151692 33-0311 [1] Hemih ydrate CaSO 4 .0.5H 2 O Monoclinic 193.4 79528 01-083-0438 [2] Anh ydrite-III CaSO 4 He xagonal 188.7 24473 01-073-1942 [3] Anh ydrite-II CaSO 4 Orthorhombic 220.1 16382 01-072-0916 [4] Syngenite K2 Ca(SO 4 )2 .H 2 O Monoclinic 194.3 157072 28-0739 [5] Calcite CaCO 3 Rhombohedral 193.8 80869 01-086-0174 [6] Dolomite CaMg(CO 3 )2 Rhombohedral 134.7 31277 01-075-1711 [7] Quartz SiO 2 Rhombohedral 92.3 41414 46-1045 [8] Gehlenite Ca 2 Al2 SiO 7 Tetragonal 205.9 87144 01-089-5917 [9] Y eelemite Ca4 Al6 SO 16 Orthorhombic 169.9 80361 42-1478 [10] Ca4 Al6 SO 16 Cubic 169.9 9560 01-071-0969 [11] Mullite Al4 SiO 8 Orthorhombic 99.5 23867 01-073-1389 [12] Y oshiokaite Ca 5.5 Al11 Si5 O32 Rhombohedral 153.8 69380 01-080-1547 [13] Hematite Fe2 O3 Rhombohedral 1163.5 82904 01-087-1166 [14] Magnetite Fe3 O4 Cubic 1183.4 49549 01-077-1545 [15] W ollastonite CaSiO 3 Monoclinic 222.4 30884 00-043-1460 [16] Rankinite Ca 3 Si2 O7 Monoclinic 253.5 2282 01-070-1138 [17] Merwinite Ca3 Mg(SiO 4 )2 Monoclinic 258.3 43078 01-089-2432 [18] Ak ermanite Ca2 Mg(Si 2 O7 ) Tetragonal 203.0 158177 00-035-0592 [19] Monticellite CaMg(SiO 4 ) Orthorhombic 193.8 34591 00-035-0590 [20]
# References: [1] De la
Torre et al. 2004; [2] Bezou et al. 1995; [3] Floerk
e 1952; [4] Kirfel and
W
ill 1980; [5] Ballirano et al. 2005; [6] Maslen et al.
1995; [7] Ef
fenber
ger et al. 1983a; [8]
W
ill et al. 1988; [9] Louisnathan 1971; [10] Calos et al. 1995; [11] Saalfeld and Depmeier 1972; [12] Sadanag
a
et al. 1962; [13] Steele and Pluth 1990; [14] Sa
w
ada 1996; [15] Fleet 1984; [16] Hesse 1984; [17] Sab
uri et al. 1976; [18]
Y
amaguchi and Suzuki 1967;
[19] Gemmi et al. 2007; [20] Onk
Table 3.
Structural details for additional phases that may be present in OPC h
ydration products. Phase F ormula Crystal system/ notation m (cm -1) ICSD codes PDF codes Ref # Portlandite Ca(OH) 2 Rhombohedral 211.4 15471 01-072-0156 [1] Gibbsite Al(OH) 3 Monoclinic 57.1 6162 01-070-2038 [2] Tobermorite Ca5 Si6 O16 (OH) 2 ·7H 2 O Monoclinic 145.0 152489 00-029-0331 [3] Jennite Ca9 Si6 O18 (OH) 6 ·8H 2 O T riclinic 164.3 151413 00-018-1206 [4] Hydrog
arnet or C
3 AH 6 Ca 3 Al2 (OH) 12 Cubic 163.7 202316 01-084-1354 [5] Katoite Ca 3 Al2 (OH) 7.6 (SiO 4 )1.1 Cubic 185.5 172077 00-038-0368 [6] AFt Ettringite Ca 6 Al2 (OH) 12 (SO 4 )3 ·26H 2 O Rhombohedral 84.4 155395 00-041-1451 [7] Ettr -CO 3 Ca6 Al2 (OH) 12 (CO 3 )3 ·26H 2 O Structur
e not r
eported 00-036-1465 Thaumasite Ca 6 Si2 (OH) 12 (CO 3 )2 (SO 4 )2 ·24H 2 O He xagonal 85.7 31247 01-075-1688 [8] AFm K
uzelite or C
4 A S H12 Ca 4 Al2 (OH) 12 [SO 4 ]·6H 2 O Rhombohedral 115.8 100138 01-083-1289 [9] Friedel’ s salt Ca 4 Al2 (OH) 12 [Cl] 2 ·4H 2 O Rhombohedral 146.7 88617 01-089-8294 [10, 11] K uzel’ s salt Ca4 Al2 (OH) 12 [(SO 4 )0.5 Cl]·5H 2 O Rhombohedral 124.0 00-019-0203 [12] Monocarbo-aluminate Ca4 Al2 (OH) 12 [CO 3 ]·5H 2 O T riclinic 124.7 59327 01-087-0493 [13] Hydrocalumite Ca4 Al2 (OH) 12 [Cl(CO 3 )0.5 ]·4.8H 2 O Monoclinic 130.1 63250 01-078-2050 [14] Hemicarbo-aluminate Ca4 Al2 (OH) 12 [OH(CO 3 )0.5 ]·5.5H 2 O Structur
e not r
eported 00-041-0221 C2 AH 8 Ca 4 Al2 (OH) 12 [Al(OH) 4 ]2 ·6H 2 O Structur
e not r
eported
00-011-0205
Strätlingite or C
2 ASH 8 Ca 4 Al2 (OH) 12 [AlSi(OH) 8 ]2 ·2H 2 O (Gehlenite h ydrate) Rhombohedral 98.8 69413 01-080-1579 [15]
# References: [1] Petch 1961; [2] Saalfeld and
W
edde 1974; [3] Bonaccorsi et al. 2005; [4] Bonaccorsi et al. 2004; [5] Lager et al. 1987; [6] Ferro et al. 2003; [7] Goetz-Ne
unhoef
fer
and Neubauer 2006; [8] Ef
fenber
ger et al. 1983b; [9]
Allmann 1977; [10] Renaudin et al. 1999; [11] Rousselot et al. 2002; [12] Mesbah et al. 2011; [13] François et al. 1998; [14]
Sacerdoti and P
calcium silicate hydrates has been reported (Richardson 2008). Furthermore, the reader is also referred to an excellent review dealing with the density of cement phases including those of AFm and other hydrates (Balonis and Glasser 2009). The mineralogy (phases) of the hydrates compounds may depend upon the additions in blended cements (Matschei and Glasser 2010) and this should be taken into account.
Whole-pattern quantitative phase analysis approaches
As stated above, conventional RQPA requires all crystal structures to be known. There are alternative whole-pattern quantitative phase analysis methods for crystalline phases with unknown structures (Smith et al. 1987; Taylor and Zhu 1992; Scarlett and Madsen 2006) however these approaches will not be discussed/reviewed here.
The output of a RQPA study is a set of m-crystalline phase scale factors, ΣmSa, for a sample
with m-crystalline phases. A phase scale factor, Sa, is related to the phase weight content, Wa,
by Equation (4) (Hill and Howard 1987; Bish and Howard 1988)
2
Ke (4)
s W S
V
a a
a a
=
r m
where Ke is a constant which depends on the diffractometer operation conditions, ra is the
crystallographic density of the a-phase, Va is the unit cell volume of a-phase, and ms is the
sample mass absorption coefficient. Equation (4) can be rewritten as given in Equation (5):
K (5)
( )
e
s W S
ZMV
a a
a
=
m
where instead of using ra, the relation between Sa and Wa is based on the “ZMV” term with Z
being the number of chemical units/formulas within the unit cell, M being the molecular mass
of the chemical formula, and V the unit cell volume. Once the crystal structure is known, the
“ZMV” term is known. In any case, the parameter to be extracted, Wa, depends on the phase
scale factor, Sa, but also on Ke and ms. Unfortunately, these two variables are not known and
they cannot be derived from the powder diffraction pattern of the sample under study.
Currently, there are three main ways to derive the phase content, Wa, from the Rietveld
refined scale factor, Sa. These three methods are based on different mathematical approaches
and they have different experimental complexities. They will be treated in detail just below.
I) Normalization to full crystalline phase content method. The simplest approach is the approximation that the sample is composed only of crystalline phases with known structures. These crystal structures are incorporated into the control file, and it was already shown (Hill
and Howard 1987) that the weight fraction of a-phase, for a m-crystalline phase mixture, may
be given by Equation (6):
1
( )
(6)
( )
m
i i
i
S ZMV W
S ZMV
a a
a
=
=
∑
The use of Equation (6) in RQPA eliminates the need to measure the instrument calibration
constant, Ke, and the sample mass absorption coefficient, ms. However, the method normalizes
the sum of the analyzed weight fractions to 1.0. Thus, if the sample contains amorphous phases, and/or some amounts of unaccounted for crystalline phases, the analyzed weight fractions will be overestimated.
amount of unaccounted crystalline phases and amorphous content are very small (negligible) which may be not the case in anhydrous OPCs and for sure is not the case in OPC pastes.
II) Internal standard method.A second, more experimentally-demanding, approach is
to mix the sample with a crystalline standard in a known amount, Wst (also known as spiking
method). This standard must be free of amorphous content or at least its non-diffracting content must be known. This (artificial) mixture must be homogenized as the particles should
be randomly arranged. Under these considerations, Equation (7) is fulfilled, where Sst is the
Rietveld scale factor of the standard in the artificial mixture (Hill and Howard 1987):
( )
(7)
( )
st
st st
S ZMV
W W
S ZMV
a a
a=
The addition of the standard dilutes the crystalline phases in the sample. This may be quite problematic for low-content phases. A procedure for Rietveld quantitative amorphous content analysis was outlined, in which the effects of systematic errors in the powder patterns were studied (De la Torre et al. 2001a). The approach requires two powder patterns to be collected but it minimizes the errors. Firstly, a powder pattern of the sample of interest is collected and the crystalline phase contents are determined as stated in the previous section (normalized to a 100% of crystalline phases). A second pattern is collected for the sample mixed with the
internal standard. The weight fraction added of the internal standard is known, Wst, as it was
weighed. The RQPA gives an overestimated value of this content, Rst, due to the presence of
amorphous phase(s), misfitting problems of the analyzed crystalline phases, and because some crystalline phases may not be included in the control file due to several reasons (its crystal structure is not known, the phase was not identified, etc.). This overall content is hereinafter named ACn which stands for Amorphous and Crystalline not-quantified, to highlight that not only an amorphous fraction but any not-computed crystalline phase and any misfit problem (for instance the lack of an adequate structural description for a given phase) may contribute to this number. The method derives the (overall) ACn content of the sample from the small overestimation of an internal crystalline standard, Equation (8) (De la Torre et al. 2001a):
(
)
(
)
41
ACn 10 (wt%) (8)
100
st st
st W R W
−
= ×
−
For this second refinement, the phase ratios between the crystalline phases in the sample may be kept fixed to the values obtained in the first fit and only the fraction of the added standard is optimized. Under these conditions, the overall ACn content is derived and this is applied to the weight fractions determined in the first fit to place them in an absolute scale. The errors associated to this approach and the optimum amount of standard has been recently discussed (Westphal et al. 2009). Finally, NIST standard reference material (SRM) 676a,
corundum (a-Al2O3) powder, has been certified to have a phase purity of 99.02% ± 1.11% (95%
confidence interval) by RQPA against a suitable primary standard (powder silicon carefully prepared from a single crystal). This novel certification method permits quantification of amorphous content for any sample of interest by this spiking method (Cline et al. 2011). This methodology has been applied to anhydrous OPC and also to pastes. However, the addition of an internal standard may alter the OPC hydration reactions and dilutes the phases in the pastes.
III) External standard method (G-factor approach). To avoid complications that may arise from mixing an internal standard with the sample, it is possible to use an external standard method. This approach requires the recording of two patterns in identical diffractometer
configuration/conditions for Bragg-Brentano q/2q reflection geometry. The method was
consists in determining the diffractometer constant, Ke, with an appropriate standard (for
instance silicon powder from Si-single crystal), see Equation (9), derived from Equation (4):
2
G K st st st (9)
e st
st
V S
W
r m
= =
where Sst is the Rietveld scale factor of the (external) standard, rst corresponds to the density
of the standard, Vst is the unit cell volume of the standard, Wstis the weight fraction of the
standard (ideally 100 wt%) in the external standard pattern, and mst is the mass attenuation
coefficient of the standard. This method is also known as G-method as the standard allows to calculate the G-factor of the diffractometer in the operating conditions.
The calculated G-factor represents a calibration factor for the whole experimental setup and comprises the diffractometer used, radiation, optics, and all data acquisition conditions, (e.g., detector configuration, integration time, etc.). This G-factor is used to determine the mass concentration of each phase of the sample under study using Equation (10):
2
(10)
s
V
W S
G a a
a a
r m
=
This method allows determining the absolute weight fractions by using a diffractometer constant that must be previously determined. However, the mass attenuation coefficient of
the sample is needed, ms. This must be independently determined, and the most common way
to obtain it, in cements, it is by X-ray fluorescence spectrometry (Jansen et al. 2011a). This methodology has been applied to anhydrous OPCs (Jansen et al. 2011a) and to OPC pastes (Jansen et al. 2012a,b). From Equation (10), it is clear that the weight fractions of all computed phases within the control file do not need to add up to 100 wt%. From the difference between 100 wt% and the sum of the crystalline phase contents, an overall unaccounted/left-out weight percentage, ACn, can be derived. In any case, the external standard method is experimentally more demanding but it may have the brightest future for the study of hydration reactions. This sentence is based on the lack of need of spiking an internal standard. The addition of an internal standard is a very important drawback in hydration reaction studies since not only dilutes the phases in the sample but it may also interfere with the hydration reactions.
SAMPLE PREPARATION AND DATA COLLECTION
The preparation of samples for laboratory X-ray powder diffraction (LXRPD) is the crucial first step for a good quantitative analysis (Jenkins et al. 1996; Bish and Reynolds 1989; Buhrke et al. 1998). In order to extract the maximum (accurate) information from a powder pattern, two parameters have to be carefully controlled: i) the positions of the diffraction maxima should be at the right place, which means good diffractometer alignment/maintenance and good sample mounting practice; and ii) the peak intensities should be those expected from the crystal structure and phase assemblage, which means that a sufficiently large number of crystallites contributing to each reflection of every phase should be bathed by the X-rays. It is necessary to obtain diffraction peaks of reproducible intensity without altering the sample or inducing too much preferred orientation. The particle statistics is of the outmost importance in quantitative studies (Elton and Salt 1996; Whitfield and Mitchell 2009).
For CuKa radiation in Brag-Brentano configuration, the relative standard deviation of
the measured intensity due to particle statistics is less than a few percent when the particle
size is smaller than 5 mm; however, the statistical error increases rapidly as the particle size is
bigger than about 10 mm (Smith 1992; Jenkins et al. 1996). For OPC samples where alite has
sample can be performed in order to reduce the average alite particle sizes to values close to
5 mm, however this treatment may alter the sample as partial amorphization may take place.
Alternatively, rotating a flat-plate sample in its own diffracting plane does not help to reduce the prefer orientation effect but increases the reproducibility of the recorded intensities. Hence, samples with large particle sizes should be measured in the rotating stage and this recording setup is strongly recommended for Rietveld studies (McCusker et al. 1999). Furthermore, rotating the sample should be compulsory for RQPA of OPC samples.
If milling is necessary, then the addition of a milling agent (e.g., n-propyl alcohol or acetone) is recommended as this significantly increases the efficiency of grinding by uniformly reducing the particle size of the hard materials, without overgrinding the softer ones (Bish and Reynolds 1989). Extensive grinding may lead to the transformation of gypsum into bassanite (or even anhydrite) and even the amorphization of sulfate phases (Fullmann and Walenta 2003; Enders 2005). Milling OPC materials usually does not help to avoid microabsorption problems which may be an important source of errors in RQPA. This problem has been extensively discussed for cements (Le Saout et al. 2011) so it is not further treated here. We want just to mention that this effect may be corrected (Brindely 1945; Taylor and Matulis 1991) but its implementation in practice is extremely difficult.
On the other hand, OPC samples contain phases with different hardness’s. The necessary clinker grinding may lead to higher concentrations of brittle and softer phases (gypsum, alite) in the finer fraction and harder phases (e.g., belite) in the coarser fraction. This was already demonstrated by Gutteridge in 1984 and therefore, ground samples should not be sieved.
Some OPC samples contain unstable phase(s) in room conditions. Sample preparation should be carried out to avoid/minimize sample alteration. In this case, there are differences between anhydrous OPCs and hydrated pastes. For anhydrous OPCs, the main unstable phase is free lime that is hydrated to portlandite and later carbonated to calcite within days under laboratory atmosphere (Fullmann and Walenta 2003). Therefore, if CaO is going to be analyzed, data should be recorded as soon as possible in flat-plate reflection (Bragg-Brentano) geometry, or sealed in an appropriate capillary when working in transmission (Debye-Scherrer) geometry. These considerations are even more important for OPC pastes as recently formed portlandite is very reactive and it is easily carbonated. Therefore, the flat-surface pastes should be covered with Mylar or Kapton thin tapes (see for instance, Jansen et al. 2011b). Finally, a lot of care in the experimental setup has to be devoted in order to avoid self-desiccation problems. A very recent study compared reflection versus transmission (both capillary and flat-sample) geometries for in-situ laboratory X-ray powder diffraction of Portland cement hydration at early ages (Dalconi et al. 2011). Unfortunately, the flat-sample held between two Kapton films underwent hydration stop due to self-desiccation very likely because a perfect sealing was not achieved. It was also observed that higher amounts of ettringite and portlandite were quantified analyzing Bragg-Brentano data with respect to capillary data. These discrepancies were related to sample segregation effects in reflection geometry, which is always a concern in this type of configuration.
SELECTED EXAMPLES OF
RIETVELD QUANTITATIVE PHASE ANALYSIS
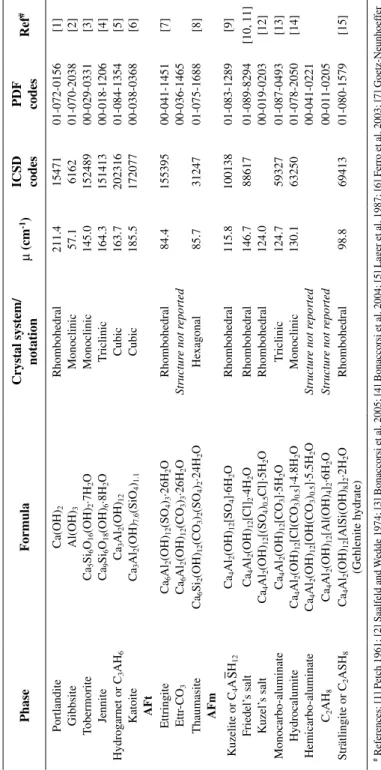
2003). Subsequently, RQPA has been employed to investigate the hydration products of several types of OPC cements. The main uses of Rietveld quantitative analysis for extracting information of OPC materials are given in Figure 1. The next subsections review some papers on these uses but the discussed list is not intended to be exhaustive.
Clinkers
A RQPA of a commercial OPC clinker was studied by high-energy (l = 0.442 Å)
synchrotron powder diffraction in Debye-Scherrer (transmission) configuration (De la Torre et
al. 2001b). Data for the same sample were also collected in a laboratory diffractometer (CuKa1,2,
l = 1.54 Å) in Bragg-Brentano (reflection) configuration. The high-resolution nature of the
synchrotron data allowed establishing the phase’s polymorphism without selective dissolution. This information is important not only for accurate RQPA, but also because the polymorphs may influence the strength development during hydration (Stanek and Sulovsky 2002). Furthermore, the use of capillaries of 1.0 mm of diameter in the synchrotron study allowed a large amount of sample to be tested which yield very reproducible diffraction intensities and so accurate RQPA results. However, the expensive nature of synchrotron measurement only allows its use for very special problems or for proof-of-principle experiments.
The use of RQPA for analyzing OPC clinkers was nicely exemplified in the study of a commercial white Portland clinker (De la Torre et al. 2003). The RQPA results of the white
clinker normalized to 100 wt% of crystalline phases gave 77.3 wt% of C3S, 19.8 wt% of
C2S and 2.9 wt% of C3A. However, Bogue calculations from XRF data gave: 71.3, 12.2 and
Main uses of RQPA for OPC materials
Clinkers
Cements
Hydration products
On-line control of production
Laboratory quality control
Modifications in the kiln
Addition of (industrial) wastes to the raw meals Use of alternative mineraliser/flux agents
Impact of the change of raw materials
Hydration of OPCs
Role of superplasticizers
Influence of w/b
ratio, T & P
Hydration of blended cements
Single phases (modelling)
Binary (f.i. OPC + FA)
Ternary (f.i. OPC + FA + CC or: OPC + BFS + FA) Special cements Mineralogy
of sulfates
Alteration during storing
Analysis of blended cements
This know-how is also being used for new eco-cements !
Durability
13.1 wt%, respectively. It is clear that there is a strong disagreement between RQPA and
Bogue calculations for C3A which is necessary for understanding cement sulfate-resistance
properties. Annealing the commercial white clinker at 1500 °C for 1 hour allowed obtaining a sample with obviously the same elemental analysis, but quite different crystalline phase
content: 76.8 wt% of C3S, 14.1 wt% of C2S and 9.1 wt% of C3A, see Figure 2, demonstrating
the advantage of RQPA over XRF.
The use of synchrotron X-ray powder diffraction (SXRPD) for grey clinker analysis gave better results since the data have higher resolution (peak widths are narrower) and the intensities are much more accurate (working in transmission with a short wavelength allows to test a much larger amount of crystallites). An initial study with commercial grey OPC clinkers showed alite phase coexistence for a range of magnesium contents (De la Torre et al. 2005), see
Figure 3. The MgO and SO3 contents, for a clinker showing alite coexistence, were 1.24 and
1.15 wt%, respectively (measured by XRF). Furthermore, the ACn content was determined in several samples using the internal standard approach and it was shown that white OPC clinkers have much higher contents than grey OPC clinkers, ~20 and ~8 wt%, respectively. The study of NIST reference material RM8488 by the internal standard method gave an overall
C
3S
C
3A
C
2S
C
3S
C
3S
C
3S
º/2
C
3S
C
3S
C
3A
C
3S
C
2S
C
3S
C
3S
C
3S
º/2
Figure 2. (top) Selected region of a Rietveld plot (CuKa1,2) for a commercial white Portland clinker with
ACn content of 8 wt% (De la Torre et al. 2006). It was also possible to use synchrotron X-ray powder diffraction to characterize the quality of laboratory powder diffraction data. One study
analyzed the same OPC by SXRPD data, LXRPD-CuKa1 and LXRPD-CuKa1,2 (see Fig. 4).
It was concluded that LXRPD-CuKa1 diffraction peaks were only slightly broader than those
in the SXRPD pattern (De la Torre et al. 2006).
The quantification of the ACn content in Portland clinkers has been a matter of deep research for a number of years. Suherman et al. (2002) already carried out a thorough study using SXRPD and LXRPD as well as internal and external standard approaches. Furthermore, selective dissolution and point-counting microscopy were also used to have the best possible results. The overall ACn contents for NIST reference clinker materials RM8486, RM8487 and RM8488 were ~6 wt%, ~11 wt% and ~7 wt%, respectively. Two commercial OPC grey clinkers were also analyzed and the determined ACn contents were 14 and 8 wt%. These NIST reference materials were also studied by RQPA and the importance of correct peak shape fits was stressed in order to have good RQPA results (Pritula et al. 2003). A subsequent analysis was dedicated to the study of the overall non-diffracting content in several commercial grey OPC clinkers and cements. The used approach was the internal standard (spiking) method and ACn contents close to 20 wt% were determined (Whitfield and Mitchell 2003).
Neutron powder diffraction (NPD) has also been used for RQPA of clinkers. NPD refinements were found to be more stable than the X-ray ones, but there was not any notable difference in the final determined phase assemblage (Pritula et al. 2004a). Furthermore, NPD, SXRPD and LXRPD were used to study the NIST reference clinker material RM8488. The
study gave quite satisfactory results although it seems that the quantification of C3A by NPD
was somewhat unstable (Peterson et al. 2002, 2006).
CO2 emission reduction can be obtained in Portland clinkers manufacturing by partly
replacing calcite by calcium oxide-bearing waste materials such as blast furnace slag or fly ash. RQPA was used to derive the phase assemblages of these laboratory-prepared clinkers
2-Theta, deg
Co
un
ts
8.0 8.2 8.4 8.6 8.8 9.0 9.2 9.4
X1 0E 4 -1. 0 0.0 1.0 2.0 3.0 4.0 C3 S 1 N aK3 (S O4 )2 C2
S CA4
F CA4
F C3 A C3 S 2 C3 S 1 C3 S 2 C2 S N aK 3 (S O4 )2 C3 S 1 C3 S 2 C3 S 1 C3 S 2 C3 S 1 C3 S 2
V/Z (C3S1) = 120.4 Å3,Mg poor
V/Z (C3S2) = 119.9 Å3,Mg rich
2-Theta, deg
Co
un
ts
8.0 8.2 8.4 8.6 8.8 9.0 9.2 9.4
X1 0E 4 -1. 0 0.0 1.0 2.0 3.0 4.0 C3 S 1 N aK3 (S O4 )2 C2
S CA4
F CA4
F C3 A C3 S 2 C3 S 1 C3 S 2 C2 S N aK 3 (S O4 )2 C3 S 1 C3 S 2 C3 S 1 C3 S 2 C3 S 1 2-Theta, deg Co un ts
8.0 8.2 8.4 8.6 8.8 9.0 9.2 9.4
X1 0E 4 -1. 0 0.0 1.0 2.0 3.0 4.0 C3 S 1 N aK3 (S O4 )2 C2
S CA4
F CA4
F C3 A C3 S 2 C3 S 1 C3 S 2 C2 S N aK 3 (S O4 )2 C3 S 1 C3 S 2 C3 S 1 C3 S 2 C3 S 1 C3 S 2
V/Z (C3S1) = 120.4 Å3,Mg poor
V/Z (C3S2) = 119.9 Å3,Mg rich
C3 S 2 C3 S 1 y
7.4 7.6 7.8 8.0 8.2 8.4 8.6 8.8
C3 S 1 N aK 3 (S O4 )2 C2
S CAF4 C
4 AF C3 A C3 S 2 C3 S 1 C3 S 2 C2 S N aK3 (S O4 )2 C3 S 1 C3 S 2
29.0 30.0 31.0 32.0 33.0 34.0 35.0
C3 S 1 N aK 3 (S O4 )2 C2
S CAF4 C
4 AF C3 A C3 S 2 C3 S 1 C3 S 2 C2 S N aK 3 (S O4
)2 C
3 S 2 C3 S 1 C3 S 1 C3 S 2 C3 S 1 y
29.0 30.0 31.0 32.0 33.0 34.0 35.0
C3 S N aK 3 (S O4 )2 C2
S CAF4 C4
A F C3 A C3 S C2 S N aK 3 (SO 4 )2 C3 S C3 S C3 S º/2
= 0.40 Å
(synchrotron data)
= CuK
1
= CuK
1,2C3 S 1
I (a.u)
I (a.u)
I (a.u)
Figure 4. Selected region of the Rietveld plots for the same commercial Portland clinker. Data were collected at: ID31 diffractometer of ESRF synchrotron (top), a laboratory diffractometer with a Ge(111) primary monochromator (middle), and a laboratory diffractometer with a graphite secondary monochromator (bottom). Note the similar resolution of synchrotron and CuKa1 patterns (modified after De la Torre et
using these special raw meals (Chen and Juenger 2009a,b). However, it is now recognized that these materials (blast furnace slag or fly ash) are more eco-friendly as additions to ordinary Portland clinkers to produce blended cements in Europe or directly in the fabrication of concretes (North America). Therefore, the use of RQPA for studying these additions will treat in the next section dedicated to OPC cements.
Another general use of RQPA is to study the role of mineralizing/flux agents in the kiln or the processing of industrial wastes in the kilns by analyzing the resulting clinker phase assemblage. As it has been described (Herfort et al. 2010), the mechanism of action of the trace elements incorporated into the clinker can be divided in two main steps depending on the amount of these elements: i) at low concentration, trace elements enter into the structure
of the initial phases of the clinker as solid solutions (C3Sss, C2Sss, C3Ass, C4AFss); ii) at
higher concentrations, the presence of new phases may be detected and quantified (Gineys et al. 2011). RQPA may help in both cases, initially by following the unit cell variations of the solid solution(s) and secondly, by quantification of the new phases. The implications of processing industrial waste(s) in the Portland kilns have been studied by RQPA. For instance, this approach has been used to evaluate the effects of chromium and nickel additions to Portland clinker raw meals. The final goal was to better characterize the processing of galvanic sludge which is the main hazardous solid waste produced by some metallurgical industries. A
small decrease in the C3S contents were measured as the amount of Ni and Cr in the raw meals
increases (Ferreira et al. 2008).
For the production of Portland clinkers, mineralizers and/or fluxes are added to the raw
mixes to accelerate reactions and enhance burnability. The traditional fluxes (Fe2O3 and
Al2O3) may be partially substituted by the mineralizing pair CaF2/CaSO4 to produce clinkers
with low aluminate contents at temperatures close 1400 °C. This is particularly useful for manufacturing white Portland clinkers because of the potential for energy conservation and seawater resistance. However, new phases may appear and in order to carry out RQPA, the crystal structures must be known. A work (Pajares et al. 2002) identified fluorellestadite in the mineralized white Portland clinker. Its crystal structure was determined and a satisfactory RQPA of the mineralized white Portland clinker was obtained. Figure 5 displays the Rietveld plot of this mineralized white Portland clinker, and a similar Rietveld plot for an ordinary white Portland clinker is also given for the sake of comparison.
Cements
RQPA in OPC cements can be used for a number of applications including: i) quantification of the crystalline phases in OPCs, including the ACn content if needed; ii) to analyze the amount and role of sulfate-containing phases; iii) to study the mineralogical phase assemblage in the materials used as addition(s), including their ACn contents; iv) to quantify all phases in blended OPC cements. The overall amorphous content has been studied in OPC clinkers as previously discussed. This type of study has also been carried out in cements and a thorough study by the external standard method (Jansen et al. 2011a) concluded that no significant amorphous content could be proven in that particular analyzed OPC cement.
Commercial OPCs contain sulfate carriers in variable amounts. Gypsum (or other calcium sulfates) is added to the clinker during the milling process, where it may partially dehydrates to bassanite or even to soluble anhydrite-III. Due to different hydration kinetics of these phases, it is necessary to characterize the mineralogical composition of sulfate in a cement system in order to reach an optimal and reproducible setting and cement hydration (Seufert et al. 2009a).
The formations and transformations of the five different phases in the CaSO4-H2O system
mineralogy of the sulfate source is very important for the fluidity, setting and hydration of mortars and concretes (Tang and Gartner 1988; Rossler et al. 2008). This technique has been very recently used for quantitative determination of the hydration products formed within minutes of mixing (e.g., ettringite, syngenite and secondary gypsum), to help identify the cause(s) of early stiffening (Ramlochan and Hooton 2011).
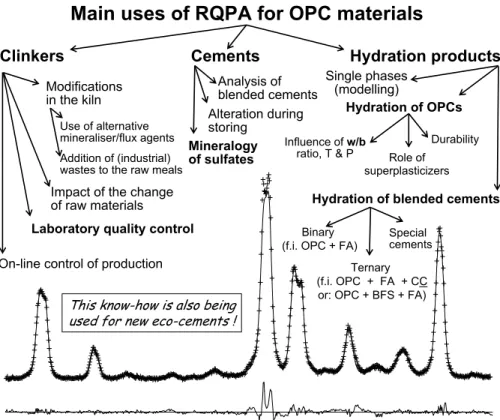
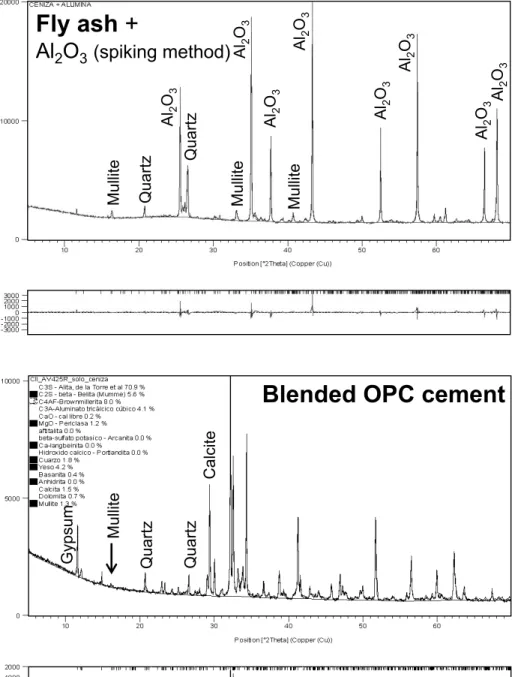
Today supplementary cementitious materials (SCMs) are widely used in concrete either in blended cements or added separately in the concrete mixer. The use of silica rich materials influences the amount and kind of hydrates formed and thus the volume, the porosity and finally the durability of these materials (Lothenbach et al. 2011). Therefore, it is easy to understand that the mineralogical phase assemblage in different common additions has been deeply studied including PFA, bottom ash, metakaolin and BFS (Kumar et al. 2008; Korpa et al. 2009; Gonçalves et al. 2009; De Weerdt et al. 2011; Narmluk and Nawa 2011). Furthermore, RQPA has also been used to characterize other less common additions such as drinking water treatment plant sludge (Husillos-Rodriguez et al. 2010) or natural zeolites (Snellings et al. 2010). Table 4 reports a RQPA study of a fly ash carried out in our laboratory by the internal standard method described above. Figure 6 (top) shows the Rietveld plot for
2-Theta, deg
Co
un
ts
28.0 29.0 30.0 31.0 32.0 33.0 34.0 35.0
X1
0E
3
.0
2.0
4.0 CS3
C3
S
C3
S
C3
S
C3
S
C2
S CS2 C
3
A
C2
S
X1
0E
3
.0
1.0
2.0
3.0
C3
S
C3S
C3
S
C3
S
C3
S
C2
S FLELL CS,2
FLELL
FLELL
FLELL C11
A7
.CaF
2
Figure 5. (top) Selected region of a Rietveld plot (CuKa1,2) for a mineralized white Portland clinker.
this type of analysis with the main peaks labeled. An overall ACn content of ~75 wt% was obtained with mullite and quartz being the main crystalline phases (see Table 4).
Finally, the analysis of blended cements containing BFS and PFA additions by RQPA (with internal standard) was already reported several years ago (Westphal et al. 2002; Walenta Fullmann and 2004). Many more studies have been reported in this subject mainly linked to the hydration characterization. Hence, some of these papers will be discussed in the next subsection. As an example of this type of analysis, Figure 6 (bottom) shows the Rietveld plot of a RQPA for a blended OPC cement obtained with the fly ash described in the previous paragraph. It was possible even to quantify the mullite content, in the cement. This number may be used to track down the approximate amount of fly ash added to the cement in the industry. Quartz is not a suitable compound to carry out this type of calculations as it may be present in the gypsum and/or in the additions like limestone, chert, etc.
Hydration products
RQPA has been employed for a number of applications related to the hydration reactions of OPC materials. The uses have been expanded from the hydration of model systems (for instance a single phase or an artificial mixture, Bellman et al. 2010) to blended cements and the role of admixtures and superplasticizers. It must be highlighted that the impact of admixtures on the hydration kinetics of Portland cement has been recently reviewed (Cheung et al. 2011) although that paper focused on the materials and not on the techniques to be used.
RQPA was used to study the hydration reactions of commercial OPC in reflection geometry with laboratory data (Scrivener et al. 2004). The results were satisfactorily compared to those obtained from thermal analysis and electron microscopy. RQPA, using the internal standard approach in transmission geometry, was employed for studying OPC hydration products (Mitchell et al. 2006). The data obtained from capillary measurements showed little preferential orientation, and produced the progression of phase contents expected from the reaction. This study highlighted the benefits of the transmission geometry as more particles are measured which yields more reliable quantitative results. The early hydration of white Portland
cement was also studied by in situ X-ray powder diffraction (reflection geometry) at defined
temperatures and with different water/cement ratios (Hesse et al. 2008, 2009). The hydration of an OPC cement at 28 days was studied by RQPA using the external and internal standard methods including the role of isopropanol to stop the hydration reaction (Le Saout et al. 2007). Figure 7 displays the typical Rietveld plot for that material where the relevant peaks are labeled.
RQPA based on in-situ synchrotron powder diffraction was used to monitor the evolution of hydrous phases during early hydration with a time resolution of 10 seconds (Weyer et al. 2005). A related work but with lower time resolution (minutes) studied the hydration process
Table 4. Rietveld quantitative phase analysis (wt%) of a fly ash.
Phase internal standard Fly ash +
RQPA direct result
Fly ash analysis Final result
Mullite 9.5(2) 11.1(4)
Hematite 3.9(2) 4.6(6)
Quartz 7.4(2) 8.7(6)
Wollastonite 0.8(2) 1.0(6)
Corundum (WS = 47.7 wt%) (RS = ) 78.3(6)
---ACn content# --- 74.6
Fly ash
+
Al
2O
3(spiking method)
Blended OPC cement
Al2 O3
Al2 O3
Al2 O3
Al2 O3
Al2 O3
Al2 O3
Al2 O3 Al
2
O3
Quartz
Quartz
Quartz
M
ul
lit
e
M
ul
lit
e
Quartz
Gypsum
Calcite
M
ul
lit
e
M
ul
lit
e
Figure 6. (top) Full region of a Rietveld plot (CuKa1) for a fly ash mixed with Al2O3 as internal standard
(47.7 wt%). The main peaks are labeled. (bottom) Full region of the Rietveld plot (CuKa1) for an industrial
blended OPC obtained from that fly ash. The main diffraction peaks, which are not due to clinker phases, are highlighted.
Fly ash
+
Al
2O
3(spiking method)
Blended OPC cement
Al2 O3
Al2 O3
Al2 O3
Al2 O3
Al2 O3
Al2 O3
Al2 O3 Al
2
O3
Quartz
Quartz
Quartz
M
ul
lit
e
M
ul
lit
e
Quartz
Gypsum
Calcite
M
ul
lit
e
M
ul
lit
on synthetic clinker phases (C3A and C4AF) and on commercial OPC cements (Merlini et al.
2007a,b). Furthermore, synchrotron powder diffraction was also used to monitor the evolution
of ettringite in C3A-gypsum synthetic mixture and in commercial OPC cement systems during
the first hours of the hydration process (Merlini et al. 2008). In-situ synchrotron RQPA was also carried out for studying the very early hydration of Class A and H oil well Portland
cements with different amounts of CaCl2 at 25 and 50 °C (Jupe et al. 2007). On the other
hand, synchrotron radiation may be used in more sophisticated types of characterization. For instance, high-energy synchrotron X-ray microdiffraction was used to quantify the orientation distribution of ettringite crystals. Diffraction images were analyzed using the Rietveld method to obtain information on textures within thin slabs of mortars (Wenk et al. 2009).
The hydration reactions of an alkali-poor and an alkali-rich OPC were followed by RQPA. Significant differences during the early hydration were measured due to the presence of
syngenite, K2Ca(SO4)2·H2O, when the alkali content is high and secondary gypsum when the
alkali content is low. Furthermore, the pore solutions of the hydrated cements were analyzed
and super- or undersaturations for relevant minerals were calculated (Stark et al. 2008). In situ
X-ray diffraction for monitoring cement hydration was used to study well defined Portland
cement clinkers consisting of alite and aluminate doped with different amounts of Na2O. Other
techniques such as isothermal conduction calorimetry and differential scanning calorimetry,
scanning electron microscopy and 27Al NMR technique were also used (Wistuba et al. 2007).
Finally, flash setting accelerators (both alkali-rich and alkali-free) are a class of admixtures commonly used for sprayed concrete during tunnel excavation. RQPA was also used to studying the setting behavior in this special application (Maltese et al. 2007).
RQPA has been used in many works to study the hydration reactions of blended cements. Initially, this technique was used to analyze the hydration progress of cement pastes prepared by adding BFS and limestone powder (Hoshino et al. 2006). Selective dissolution was also employed to distinguish between the amorphous contents coming from BFS and newly-formed
CH
CSH2
CH
Figure 7. Rietveld plot (CuKa1,2) for a 28 days hydrated OPC cement. The upper right inset shows the
CSH gel (the amorphous Calcium-Silicate-Hydrated gel formed in the hydration of the calcium
silicates). It was concluded that BFS accelerates the hydration of C3S, C3A and especially C4AF.
The early age hydration and pozzolanic reaction in natural zeolite blended Portland cements
has been studied by in situ synchrotron RQPA to determine the reaction kinetics and products
(Snellings et al. 2010). A deep study was also carried out to quantitatively explain the effect of water curing condition on compressive strengths of fly ash cement pastes (Termkhajornkit et al. 2006). Replacement ratios of fly ash were 0%, 25% and 50% of total powders and the water to binder ratio was relatively low, 0.80 and 1.00 by volume. The time evolution of every OPC initial phase was worked out by RQPA. Unfortunately, the time evolution of portlandite was not quantitatively reported in that paper. The hydration degree of belite was the most affected parameter by the fly ash. On the other hand, a very recent and complete study used RQPA, together with thermogravimetry, scanning electron microscopy and isothermal calorimetry, in order to understand the hydration mechanisms of blended Portland cements containing fly ash and limestone powder (De Weerdt et al. 2011). In addition, pore solution analysis and thermodynamic modeling techniques were also employed. The time-evolution of all phases during hydration were studied (including portlandite from TGA and RQPA), and not only the pozzolanic effect was studied, but the variations in chemical shrinkages were also understood. Furthermore, the effect of fly ash on the kinetics of Portland cement hydration at different curing temperatures has also been investigated by RQPA (Narmluk and Nawa 2011). The hydration reactions of OPC were quantified by RQPA and the overall degree of fly ash hydration was determined from a selective dissolution method.
Ternary binders composed of OPC, calcium sulfoaluminate clinker (CSA) and anhydrite were examined in order to study the impact of variations of the OPC:CSA:CS ratio on the hydration process and related mortar properties. RQPA was used to determine the mineralogical composition of the starting cementitious materials. Thermodynamic modeling was used to establish the phase assemblage which was also studied by calorimetry, DTA-TGA, SEM and X-ray powder diffraction for phase identification (Pelletier et al. 2010). RQPA and thermal methods were used to determine the phase development up to 28 days of hydration in normal and ultra-high performance cementitious systems (UHPC) that contains silica fume and fly ash (Korpa et al. 2009). For the calculation of the ACn content, the vacuum dried powdered specimens were mixed with ZnO as internal standard. For both formulations the most remarkable changes of the phase contents were measured in the first few days of hydration.
To finish this section we would like to highlight that many hydrated phases may be present in a given hydrated/hydrating sample. Figure 8 displays the Rietveld plot of a sample showing one of the richest phase assemblage found in our laboratory. The peaks are labeled to easily identify each crystalline phases. The crystalline phases of this hydrated cement are mainly arising from the calcium sulfoaluminate cement fraction but we choose this sample to illustrate the amount of phases that can coexist in a paste (Fig. 8, Table 3).
Durability studies
(usually lower than 15 °C). Hence, the effect of ettringite on thaumasite formation was studied in synthetic OPC materials using this methodology (Kholer et al. 2006). It must be highlighted that ettringite and thaumasite form a solid solution that has been extensively studied (Barnett et al. 2002; Torres et al. 2004).
Another durability concern in OPC concretes is the alkali-aggregate/alkali-silica reaction (see for instance: Thomas et al. 2006; and references therein). Some aggregates, mainly silica but also carbonate, may provoke the expansion with failure of OPC concretes. RQPA has been employed to study the aggregates with the final aim to understand these reactions (Grattan-Bellew et al. 2010). Furthermore, this technique has also been employed, plus other characterization tools, to study the alkali-aggregate reaction in OPC and waterglass-alkali-activated slag mortars (Puertas et al. 2009).
Finally, composition and microstructure changes of cement pastes under a heating and cooling cycle were monitored by neutron powder diffraction. The parameters involved in the study were the heating ramp, the state of the sample (in block or ground) and the type of cement. Unfortunately, the Rietveld method was not applied to quantify the phases in the mixtures (Castellote et al. 2004). Neutron powder diffraction was subsequently used for studying the phase composition changes of cement pastes during accelerated carbonation experiments (Castellote et al. 2008).
Selective dissolution
Selective dissolution may be applied to OPC clinkers (or cements) or to blended cements with different methodologies (Gutteridge 1979; Luke and Glasser 1987). For OPC clinkers, both aluminates and silicates residues can be obtained. This is very useful for ensuring the polymorph present in the samples as the enriched phase may be identified much more easily. On the other hand, selective dissolution of blended cements is also used to determine the hydration degree of the addition (for instance fly ash or blast furnace slag). In these cases,
A
Ft
C
SH
0
.5
AH
3
C
C
C3
AH
6
A
Ft
A
Ft
A
Ft
A
Ft
C3
AH
6
C3
AH
6
C3
AH
6
C3
AH
6
C3
AH
6
AH
3 C
SH
0
.5 CSH
0
.5
C
SH
0
.5
AF
m
-C
AF
m
-C AFm-C
AF
m
-C
AF
m
-C
ka
to
it
e
ka
toit
e
Figure 8. Rietveld plot (CuKa1) of a fully hydrated blended cement paste mainly composed of calcium
![Table 1. Structural details for phases that may be present in OPC clinkers. PhaseFormulaCrystal system/ notationm (cm−1)ICSDcodesPDFcodesRef# AliteCa 3SiO5-Mg,AlMonoclinic/M3310.49474201-070-8632[1] Ca 3SiO5-MgTriclinic/T3308.5162744[2] Ca 3SiO5Triclinic/](https://thumb-us.123doks.com/thumbv2/123dok_es/6336899.782096/6.648.102.511.160.837/structural-clinkers-phaseformulacrystal-notationm-icsdcodespdfcodesref-almonoclinic-mgtriclinic-triclinic.webp)