Universidad de M´
alaga
Escuela T´ecnica Superior de Ingenier´ıa de Telecomunicaci´on
TESIS DOCTORAL
Bayesian modelling of fault diagnosis in mobile communication
networks
Autor:
Raquel Barco Moreno
Directores:
UNIVERSIDAD DE M ´ALAGA
ESCUELA T ´ECNICA SUPERIOR DE INGENIER´IA DE TELECOMUNICACI ´ON
Reunido el tribunal examinador en el d´ıa de la fecha, constituido por:
Presidente: Dr. D.
Secretario: Dr. D.
Vocales: Dr. D.
Dr. D.
Dr. D.
para juzgar la Tesis Doctoral tituladaBayesian modelling of fault diagnosis in mobile commu-nication networks realizada por Da. Raquel Barco Moreno y dirigida por Dr. D. Luis D´ıez del R´ıo y Dr. D. Volker Wille, acord´o por
otorgar la calificaci´on de
y para que conste, se
extiende firmada por los componentes del tribunal la presente diligencia.
M´alaga a de del
El presidente: El secretario:
Fdo.: Fdo.:
El vocal: El vocal: El vocal:
Acknowledgements
This thesis has been an important part of my daily activities during more than six years. The thought “I should be working on my thesis” has constantly accompanied me during both working and spare time. Too frequently, the thesis has absorbed me, stealing time from my other activities, my family and friends. It is difficult to believe that now it is time to close this endless period of my life.
If I look back and evaluate the results of this thesis, I cannot avoid thinking that for me the most important achievement has been the colleagues, now friends, that I have met. All the lonely hours spent in this thesis along so many years are worthwhile because of those people. This is why I would like to thank those that have directly or indirectly supported me in these years.
The roots of this thesis lie in my experience at the European Space Agency in 1997. Amongst other tasks, I was assigned the design of an automated diagnosis system for satellite ground stations. Thanks to Ram´on Segura, who was the one that first saw the necessity of such a system and who was my supervisor at the beginning of the work. Thanks to Klaus-J¨urgen Schulz, the section head, who supported me to do the diagnosis study, despite taking up a lot of time from my other “operational” activities.
In 1999, I came back to Spain after two years in Germany. The change was quite frustrating at the beginning. I missed the team work and the meetings of my previous work compared to the more independent way of researching at university. At this point, thanks to Carlos Camacho, who (once more) gave me the opportunity to work at Nokia when a research center was open at M´alaga. This was just what I needed at that time.
After some months, Nokia decided to start a project on automatic troubleshooting in cellular networks. Because of my previous experience, this project fitted perfectly with my interests and, at the same time, gave me the opportunity to start my thesis on that topic. On the one hand, there was a risk of Nokia closing the project (as actually happened some years later) letting my thesis unfinished. On the other hand, the time dedicated to my thesis was less than if I would have done a more conventional thesis because only part of the time I spent in Nokia could be used for my thesis. However, the experience of working in a team with staff in Spain, Denmark and UK was excellent. Thanks to all my colleagues in that project for the very good moments that we shared. Thanks to Sagar Patel, our link with operators, for being such a good friend and phoning me so often, in spite of living in UK. Thanks to Lars Moltsen, who was the first to propose Bayesian Networks, for doing work such an enjoyable activity. Thanks to Rafael Guerrero, my KAT man, for bearing me when I wrote such awful equations and specifications for the tool (and he even implemented them!). Thanks to Gustavo Hylander, Martti Partanen and Volker Wille, who were able to create a wonderful team spirit in which everyone had something to contribute with. I will never forget our meetings in M´alaga. I owe this team much of this thesis.
Unfortunately, after three years, the Nokia center in M´alaga was disbanded and with it the troubleshooting project disappeared. Some months later, I was invited to participate in a MICYT project, which was a support for this thesis. Thanks to all my colleagues in this project. Thanks to Mat´ıas Toril for his wise advice and fruitful cooperation. Thanks to Mariano Fern´andez, for doing the project so easy-going, for being so honest and for giving me the freedom to carry out any initiative I had on the project.
in April in Paris. Although troubleshooting was not even going to be part of the project, in that meeting we started to consider it. And now that we are at the end, troubleshooting has grown to be a third part of the Gandalf project. Thanks to all members of the Gandalf team for creating such a great working environment. Specially, thanks to Zwi Altman, for being such a good manager, so exhaustive in his work (he even followed every single algorithm that was developed for the project!) and open-minded to accept any proposal anyone in the group may have. Thanks to those who have worked with me in the troubleshooting part of the project: Lars Moltsen, Pedro L´azaro, Herve Dubreil, Beatriz Solana, Jordi Triola, Rana Khanafer and Sasikanth Munagala. I am looking forward to our next meetings in Berlin and Paris.
Finally, the circle has closed. The start of this thesis was diagnosis in satellite ground stations. Now that the Gandalf project has almost finished, we have just started a new ESA project for automatic diagnosis in satellite communication equipment. Thanks to Lars Moltsen for inviting me to participate in it and for believing in me.
Thanks to my two supervisors, Luis D´ıez and Volker Wille, specially for their help in making this document readable (what a disaster the first draft was!). Thanks to Finn Jensen and the people at his department for their warm welcome and support during the two weeks I spent in Aalborg. Thanks to Jos´e Mar´ıa Hermoso and Jos´e Antonio Fern´andez, who worked in troubleshooting with me for their final master thesis.
Thanks to all the people who have been with me all these years, fulfilling other areas of my life so necessary to make me focus on this thesis. Thanks to my parents and my sister for being always by my side, being content with the little time that my busy life left for being with them. I owe the numbers to my father and the letters to my mother. Thanks to Pedro for following me in every new restless challenge I undertake and for bearing the constant “I cannot do anything because of my thesis”. Thanks to my close friends Pedro, Javi and Ale for being an essential component of my spare time and for being always there when I need them. Thanks to ´Alvaro for being with me so many years, despite the different countries that we have always had in between. Thanks to Marco, Javier, Juan, Kris and Lionel for making me miss living in Germany. Thanks to my friends from the painting class who helped me to forget about engineering for a few hours every week. Thanks to my colleagues in the Ingenier´ıa de Comunicaciones Department, for creating such a nice working environment, specially to those who go down for coffee-time without having coffee and to those that have made me enjoy having lunch at university. Thanks to my students, who give sense to my work at university. And, finally, thanks to all the teachers that I have had along my life because this thesis is also due to them.
This thesis have been partially supported by:
• Nokia under a cooperation agreement (reference 8.07/59.1628) with the Ingenier´ıa de Comunica-ciones Group of the University of Malaga
• the Spanish Ministry of Science and Technology under project TIC2003-07827
Contents
Abstract v
Resumen vii
Acronyms ix
1 Introduction 1
1.1 Motivation . . . 1
1.2 Preliminaries . . . 4
1.3 Objectives . . . 6
1.4 Guide for the reader . . . 8
I Background 11 2 Automation and optimization in cellular networks 13 2.1 Preliminaries . . . 14
2.1.1 Overview of the GSM system . . . 14
2.1.2 Architecture of the GSM network . . . 15
2.1.3 Signalling protocols in the radio interface . . . 17
2.1.4 Channel structures . . . 18
2.1.5 Network management . . . 19
2.2 State of the art . . . 22
2.2.1 Automation and optimization . . . 22
2.2.2 Troubleshooting in current cellular networks . . . 25
2.2.3 Automatic troubleshooting . . . 29
3 Diagnosis techniques 37 3.1 Reasoning under uncertainty . . . 37
3.1.1 Introduction . . . 37
3.1.2 Certainty factors . . . 38
3.1.3 Dempster-Shafer theory . . . 38
3.1.4 Fuzzy logic . . . 39
3.1.5 Probabilistic networks . . . 41
3.1.6 Justification of the selected technique . . . 42
3.2 Bayesian Networks . . . 43
3.2.1 Introduction to BNs . . . 44
3.2.2 Bayesian modelling . . . 50
3.2.3 Learning . . . 50
3.2.4 Sensitivity analysis . . . 50
II Modelling of Fault Diagnosis 53
4 Diagnosis in GSM/GPRS networks 55
4.1 Introduction . . . 55
4.1.1 Basic definitions . . . 55
4.1.2 Methodology . . . 57
4.2 Problem: Dropped calls . . . 57
4.3 Causes of dropped calls . . . 59
4.3.1 Interference . . . 59
4.3.2 Coverage . . . 60
4.3.3 Hardware . . . 62
4.3.4 Transmission . . . 63
4.3.5 Others . . . 65
4.4 Symptoms: Performance Indicators and Alarms . . . 65
4.4.1 Symptoms related to dropped calls . . . 68
4.4.2 Level and quality . . . 70
4.4.3 Timing Advance . . . 71
4.4.4 Measured Uplink interference . . . 72
4.4.5 Handovers . . . 72
4.4.6 Access . . . 74
4.4.7 Alarms . . . 74
4.5 Conditions: Features and Configurations . . . 75
4.5.1 Frequency Hopping . . . 75
4.5.2 Power Control . . . 76
4.5.3 Discontinuous Transmission . . . 76
4.5.4 Reception diversity . . . 77
4.5.5 Cell type . . . 77
4.5.6 Climate . . . 78
4.5.7 Antenna alignment and tilt . . . 79
4.6 Knowledge base for diagnosis model . . . 79
4.6.1 Example of symptom values . . . 79
4.A Appendix: Case Study . . . 89
4.A.1 Case 1: UL Interference . . . 89
4.A.2 Case 2: HW fault in reception path . . . 90
4.A.3 Case 3: Adjacency definition and Congestion . . . 91
4.A.4 Case 4: Adjacency definition, Configuration parameters and Interference . . . 92
4.A.5 Case 5: DL Interference . . . 93
4.A.6 Summary . . . 93
5 Bayesian modelling of fault diagnosis 95 5.1 Introduction . . . 95
5.1.1 Definitions . . . 95
5.1.2 Notation . . . 98
5.2 Model based on Bayesian Classifier . . . 98
5.2.1 Inference Method . . . 98
5.2.2 Beta distribution . . . 100
5.2.3 Model Representation . . . 102
5.3 Models based on Bayesian Networks . . . 105
5.4 Bayesian Network Structures . . . 107
5.4.1 Simple Bayes Model (SBM) . . . 107
5.4.2 Central Bayes Model (CBM) . . . 109
5.4.3 Independence of causal influence (ICI) . . . 110
5.5 Learning of model parameters . . . 115
5.5.1 Methods to discretize continuous variables . . . 115
5.5.2 Methods to estimate probabilities . . . 121
5.6 Prevention of imprecision in model parameters . . . 124
5.6.1 Introduction . . . 124
5.6.2 Smooth Bayesian Networks (SBN) . . . 126
5.6.3 Multiple Uniform Intervals (MUI) . . . 131
5.7 Knowledge Acquisition . . . 132
5.7.1 Bayesian Network . . . 134
5.7.2 Bayesian Classifier . . . 140
5.A Appendix: Example of model under ICI assumptions . . . 144
5.B Appendix: Posterior probability of causes in SBNs . . . 146
5.C Appendix: Equations for Belief mapping functions of SBNs . . . 147
5.D Appendix: Example of KA . . . 148
III Evaluation 155 6 Results 157 6.1 Experimental design . . . 157
6.1.1 Network and simulated cases . . . 157
6.1.2 Performance measures . . . 160
6.1.3 Sensitivity Analysis . . . 162
6.1.4 Methodology . . . 163
6.2 Estimation of probability functions . . . 168
6.3 Prototype tools and field tests . . . 173
6.3.1 Knowledge acquisition . . . 173
6.3.2 Troubleshooting Tool . . . 174
6.3.3 Trial in a live GSM/GPRS network . . . 175
6.4 Evaluation of the diagnosis systems . . . 178
6.4.1 Bayesian Classifier . . . 178
6.4.2 SBM versus Noisy-OR . . . 183
6.4.3 Learning of model parameters . . . 186
6.4.4 Prevention of imprecision in model parameters . . . 196
6.5 Discussion . . . 202
7 Conclusions 207 7.1 Results . . . 207
7.2 General appraisal . . . 209
7.3 Contributions . . . 211
7.4 Future work . . . 213
A Parameters of the diagnosis models 215 B Approximation of the pdfs of the symptoms given the causes 221 C Reference pdfs of the symptoms given the causes 245 D Diagnosis model defined for field test 251 E Summary (Spanish) 255 E.1 Introducci´on . . . 255
E.1.1 Antecedentes y Justificaci´on . . . 255
E.1.2 Formulaci´on del problema y objetivos . . . 256
E.2 Estado del arte . . . 258
E.2.1 Automatizaci´on en redes de comunicaciones m´oviles . . . 258
E.2.2 T´ecnicas para la diagnosis autom´atica . . . 259
E.3 Modelado de la diagnosis de fallos . . . 259
E.3.1 Diagnosis en redes GSM/GPRS . . . 260
E.3.2 Modelado bayesiano de la diagnosis de fallos . . . 261
E.4 Evaluaci´on . . . 265
E.4.1 Resultados . . . 265 E.4.2 Conclusiones . . . 267
Bibliography 269
Index 285
Abstract
The mobile telecommunication industry has experienced significant changes in the recent past and it will continue to do so for the foreseeable future. The introduction of GSM based mobile communications in the early 90s has revolutionised the way people communicate. Prior to the launch of these systems, the majority of voice traffic was carried over plain old telephone systems and phones were associated to places rather than to people. At the same time, data communication has also undergone major changes. Due to applications such as e-mail and other internet based services, our communication behaviour is completely different from what it was less than 15 years ago.
The introduction of new features, services and technologies is still shaping and changing the commu-nication industry. For example, the wide availability of WLAN-based broadband access and the launch of telephony based on WLAN is likely to revolutionise our communication pattern again. This change is potentially posing a real threat to the mobile communication business. Therefore, cellular network operators have to find ways to reduce the cost of their services and improve their quality to counter the threat posed by the emerging technologies.
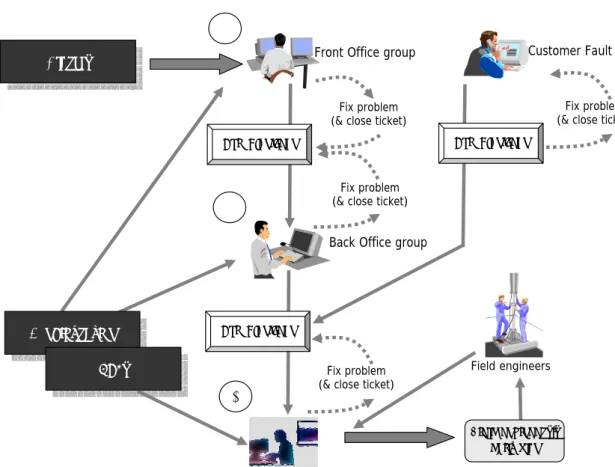
In a mature cellular network that has undergone most of its site roll-out, the major cost is associated to the operation of the network. As the network consists of a high number of pieces of equipment that are distributed across the entire country, maintaining and operating this large and technically complicated system is a difficult task that requires operator personnel around the clock in several regional offices. For example, GSM networks in Europe may consist of about 10000 sites covering the entire country. Due to the large size of the networks, it is common that some of the deployed pieces of equipment do not work as planned. The consequence of such problems is poor end-user service. As in most countries several operators are competing for subscribers, it is imperative to rectify such occurrences because otherwise users will naturally switch to competing network operators. Hence, fault management, also called trou-bleshooting (TS), is a key aspect of the operation of a cellular system in a competitive environment. As the Radio Access Network (RAN) of cellular systems is by far the biggest part of the network, most of the TS activities are focused on this area.
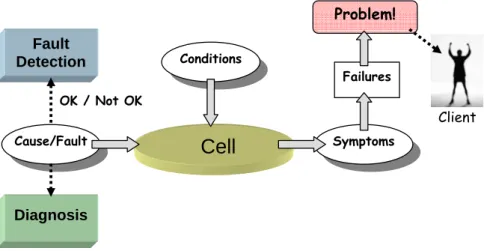
TS comprises the isolation of faulty cells (fault detection), the identification of the fault causes (diagnosis) and the proposal and deployment of healing actions (solution deployment). Currently, in most cellular networks TS is a manual process, accomplished by RAN experts. Their task is to resolve problems in the network that have been identified by other employees or by automated checking routines. During the TS procedure, several applications and databases have to be queried to analyze performance indicators, cell configuration and alarms of the cells.
Amongst troubleshooting tasks, diagnosis of the cause of faults is the most complex and time-consuming one. Surprisingly, very few references can be found on automatic diagnosis in the RAN of cellular networks. Thus, the aim of this thesis is to study how to automate diagnosis for the RAN of cellular networks.
The first part of the thesis consists of a survey on how troubleshooting is currently performed in existing cellular networks. This part is considered to be essential for the rest of the thesis because the troubleshooting procedure is not documented in the existing literature, despite the fact that it is one of the main activities of operators of cellular networks.
Different techniques have been proposed for automatic diagnosis in other application domains. Amongst them, those based on Bayesian Networks (BNs) provide a modeling approach suitable to cater for the uncertainty inherent in human reasoning. This, as well as other benefits of BNs, together with the com-plexity of the problem under study, has focused this thesis on the study of automated diagnosis based on BNs.
In this thesis, two components of the diagnosis system have been distinguished: the model and the
inference method. The model represents the knowledge on how the identification of fault causes is carried out. The elements of the model are causes, symptoms and related parameters (namedconditions). The inference method is the algorithm that identifies the cause of the problems based on the value of the symptoms and the conditions.
The model is determined by random variables, which represent the causes, symptoms and conditions, as well as probability functions, which model the relationship among these variables. Two types of diagnosis systems have been proposed in this thesis, depending on how symptoms have been modelled: either as continuous or discrete random variables. Firstly, the Bayesian Classifier (BC) models symptoms as continuous variables. In this case, the main difficulty in model definition lies in the specification of the conditional probability density function (pdfs) of the symptoms given the causes. In this thesis, it has been proposed to approximate those pdfs by beta pdfs.
In the second type of proposed systems, discrete BNs, the symptoms are modelled as discrete random variables. In this case, a technique traditionally used in order to simplify model construction is to assume a given network structure. That is, certain independence relationships among the variables are assumed. In that way, the problem of BN definition is simplified to the specification of the nodes and probability tables of a network with a given structure. In this thesis, different network structures have been selected, which take into account the fact that the simplicity in creating and using the model is a key issue in the cellular network domain.
Once the structure of the BN has been fixed, the parameters of the diagnosis model have to be defined, which can be done according to two solutions. Firstly, the model may be defined by diagnosis experts. Accordingly, in this thesis, a method to convert the specifications provided by experts in natural language into suitable diagnosis models has been described. Alternatively, the model can be constructed from training/example cases. Consequently, algorithms to learn the parameters of the model (thresholds for discretized variables and probabilities for the BN) have also been proposed in this thesis.
Contrary to other application domains, such as medical diagnosis, for which repositories of machine learning databases have been created and maintained, in cellular systems there are no databases of classified cases. This is the reason why in most cases the model has to be based on knowledge, i.e. experts define the model parameters. When the number of parameters to be set is large, which is normally the case, inaccuracy in setting these parameters is unavoidable due to multiple reasons. Hence, in this thesis two methods to minimise diagnosis error of models due to inaccurate parameters have been proposed.
Although the methods for automatic diagnosis proposed in this thesis are valid for any cellular network (2G, 3G or even future networks), they have been applied to diagnosis in GSM (2G). Thus, a secondary objective of this thesis has been to propose a model for automatic diagnosis in GSM. With this aim in mind, the main fault causes in GSM, their symptoms and conditions have been identified and interrelated. Once the diagnosis systems are designed, they have to be evaluated. Firstly, in order to overcome the lack of cases from live networks, an algorithm has been developed to simulate training and test cases. Secondly, a methodology has been proposed to assess the performance and to compare the different diagnosis systems presented in this thesis. Two aspects have been considered: the performance, measured by different figures of merit, and the sensitivity of the results to imprecision in model parameters. Finally, the diagnosis systems presented in this thesis have been evaluated according to the previously described procedures.
Resumen
La industria de comunicaciones m´oviles ha experimentado cambios significativos en los ´ultimos a˜nos y, previsiblemente, en el futuro continuar´a evolucionando con rapidez. La introducci´on de la telefon´ıa basada en tecnolog´ıa GSM a principios de los 90 revolucion´o el modo en que la gente se comunicaba. Antes del lanzamiento de dicho servicio, la mayor´ıa del tr´afico de voz se transportaba por la red telef´onica b´asica y los tel´efonos estaban asociados con lugares en lugar de con personas. Al mismo tiempo, la comunicaci´on de datos tambi´en ha sufrido grandes cambios. Debido a aplicaciones, como el e-mail y otros servicios basados en internet, las comunicaciones dentro de la sociedad son muy diferentes de lo que eran hace menos de 15 a˜nos.
La introducci´on de nuevas funcionalidades, servicios y tecnolog´ıas est´a a´un moldeando las telecomuni-caciones. Por ejemplo, es probable que la extensa disponibilidad de acceso inal´ambrico de banda ancha y el lanzamiento de la telefon´ıa basada en WLAN revolucione otra vez el mundo de las comunicaciones. Por tanto, los operadores de redes celulares deben encontrar medios para reducir los costes de sus servicios y mejorar la calidad para contrarrestar la amenaza de las tecnolog´ıas emergentes.
En una red celular madura que ha experimentado la mayor parte de su despliegue, el mayor coste est´a asociado a la operaci´on de la red. Como la red consta de numerosos equipos distribuidos a lo largo de todo el pa´ıs, mantener y operar este sistema complejo es una tarea dif´ıcil que requiere personal de forma permanente en muchas oficinas regionales. Por ejemplo, las redes GSM en un pa´ıs europeo de tama˜no medio pueden consistir en unos 10000 emplazamientos. Debido al gran tama˜no de las redes, es frecuente que alg´un equipo no funcione como estaba planeado. Esos problemas tiene como consecuencia la prestaci´on de un servicio deficiente a los usuarios finales. Como, en la mayor´ıa de los los pa´ıses, diversos operadores compiten por los clientes, es fundamental solucionar dichos problemas inmediatamente porque de otra forma los usuarios se cambiar´an a redes de la competencia. Por tanto, la gesti´on de fallos, tambi´en llamada resoluci´on de problemas (troubleshooting, TS), es un aspecto clave de la operaci´on de un sistema celular en un entorno competitivo. Como la Red de Acceso Radio (Radio Access Network, RAN) de los sistemas celulares es la parte m´as importante de la red, la mayor parte de las actividades de TS se concentran en este ´area.
El TS engloba el aislamiento de las celdas con fallos (detecci´on de fallos), la identificaci´on de las causas de esos fallos (diagnosis) y la propuesta y realizaci´on de acciones correctivas (recuperaci´on de fallos). Actualmente, en la mayor´ıa de las redes celulares, el TS es un proceso manual, llevado a cabo por expertos en la RAN. Su tarea consiste en resolver los problemas de la red que han sido identificados previamente por otro personal de la empresa o por rutinas autom´aticas de chequeo. Durante el procedimiento de TS, se debe consultar m´ultiples aplicaciones y bases de datos para analizar los indicadores de funcionamiento, la configuraci´on y las alarmas de las celdas.
Entre las tareas de gesti´on de fallos, la diagnosis es la m´as compleja y la que requiere m´as tiempo. Sorprendentemente, existen muy pocas referencias bibliogr´aficas sobre la diagnosis autom´atica en la RAN de redes celulares. Por eso, el objetivo de esta tesis ha sido estudiar como automatizar la diagnosis en la RAN de redes celulares.
La primera parte de la tesis ha consistido en una investigaci´on sobre c´omo se lleva a cabo la gesti´on de fallos en las redes celulares actuales. Esta parte se ha considerado esencial para el resto de la tesis, ya que el procedimiento de TS no est´a documentado en la literatura existente, a pesar de ser una las actividades principales de los operadores de redes celulares.
En otros dominios de aplicaci´on se han propuesto diversas t´ecnicas para la diagnosis autom´atica. Entre ellas, las basadas en Redes Bayesianas (Bayesian Networks, BN) proporcionan una aproximaci´on al modelado adecuada para tratar la incertidumbre inherente al razonamiento humano. Esto, adem´as de otras ventajas de las BNs, junto con la complejidad del problema bajo estudio, han centrado esta tesis
en el estudio de sistemas autom´aticos de diagnosis basados en BNs.
En esta tesis, se han distinguido dos componentes del sistema de diagnosis: el modelo y el m´etodo de inferencia. El modelo representa el conocimiento de c´omo se lleva a cabo la identificaci´on de la causa de los fallos. Los elementos del modelo son causas, s´ıntomas y par´ametros relacionados (llamadoscondiciones). El m´etodo de inferencia es el algoritmo que identifica la causa de los problemas en funci´on del valor de los s´ıntomas y las condiciones.
El modelo queda determinado por variables aleatorias, que representan las causas, s´ıntomas y condi-ciones, y por funciones de probabilidad, que modelan las relaciones entre las variables. En esta tesis se han propuesto dos tipos de sistemas de diagnosis, dependiendo de c´omo se han modelado los s´ıntomas: como variables aleatorias continuas o discretas. En primer lugar, el Clasificador Bayesiano modela los s´ıntomas como variables continuas. En este caso, la principal dificultad en la definici´on del modelo radica en la especificaci´on de las funciones densidad de probabilidades (fdps) de los s´ıntomas dadas las causas. En esta tesis se ha propuesto aproximar esas fdps por funciones beta.
En el segundo tipo de sistema propuesto, BNs discretas, los s´ıntomas se modelan como variables aleatorias discretas. Uno de los principales inconvenientes de las BNs es la dificultad para definir modelos complejos. Por eso, una t´ecnica usada con frecuencia para simplificar la construcci´on del modelo es asumir una determinada estructura de red. Es decir, se suponen ciertas relaciones de independencia entre las variables. De esta forma, el problema de definir la BN se simplifica a la especificaci´on de los nodos y tablas de probabilidad de una red con una estructura dada. En esta tesis, se han seleccionado diferentes estructuras, que tienen en cuenta que la sencillez en la creaci´on y uso del sistema de diagnosis es un factor clave en la gesti´on de redes celulares.
Una vez que se ha fijado la estructura de la BN, se deben definir los par´ametros del modelo de diagnosis, lo cual puede hacerse de dos formas. En primer lugar, el modelo puede ser definido por expertos en diagnosis. De acuerdo a esto, en esta tesis se ha descrito un m´etodo para convertir las especificaciones proporcionadas por expertos en lenguaje natural en modelos de diagnosis adecuados. Como alternativa, el modelo puede aprenderse a partir de casos de entrenamiento. Consecuentemente, se han propuesto tambi´en en esta tesis algoritmos para aprender a partir de datos los par´ametros del modelo (umbrales para variables discretizadas y probabilidades para la BN).
Al contrario que en otros dominios de aplicaci´on, como en el diagn´ostico m´edico, en el que existen numerosas bases de datos para aprendizaje, en sistemas celulares no se dispone de dichas bases de datos de casos clasificados. Por esa raz´on, en muchas ocasiones, el modelo debe estar basado en el conocimiento, es decir, los expertos deben definir sus par´ametros. Cuando el n´umero de par´ametros es demasiado grande, lo cual suele ocurrir con frecuencia, la imprecisi´on en la definici´on de los par´ametros es inevitable debido a m´ultiples motivos. Por eso, en esta tesis se han propuesto dos m´etodos para disminuir los errores en el diagn´ostico de modelos sujetos a par´ametros imprecisos.
Aunque los m´etodos propuestos en esta tesis son v´alidos para cualquier red celular (2G, 3G o incluso futuras redes), se han aplicado a la diagnosis en GSM (2G). Por tanto, un objetivo secundario de esta tesis ha sido proponer un modelo para la diagnosis autom´atica en GSM. Con este prop´osito, se han identificado e interrelacionado las principales causas de fallos en GSM, sus s´ıntomas y condiciones.
Una vez que se han dise˜nado, los sistemas de diagnosis deben ser evaluados. En primer lugar, para suplir la falta de casos de redes reales, se ha desarrollado un algoritmo para simular casos de prueba y de entrenamiento. En segundo lugar, se ha propuesto una metodolog´ıa para valorar el funcionamiento y comparar los distintos sistemas de diagnosis presentados en esta tesis. Se han considerado dos aspectos: el funcionamiento, medido mediante diferentes figuras de m´erito, y la sensibilidad de los resultados a imprecisiones en los par´ametros del modelo. Finalmente, los sistemas de diagnosis presentados en esta tesis se han evaluado de acuerdo a los procedimientos anteriormente descritos.
Acronyms
3G: Third Generation
AGCH: Access Grant Channel
AuC : Authentication Center
BA: BCCH Allocation
BC: Bayesian Classifier
BB FH: Baseband Frequency Hopping
BCC: Base Station Colour Code
BCCH: Broadcast Control Channel
BCF: Base station Control Function
BDF: Beta Distribution Function
BER: Bit Error Rate
BMAP: Beta Maximum a Posteriori
BN: Bayesian Network
BOG: Back Office group
BSC: Base Station Controller
BSS: Base Station Subsystem
BTS: Base Transceiver Station
CBM: Central Bayes Model
CDF: Cumulative Distribution Function
CF: Certainty Factor
CFG: Customer Faults group
CM: Communication Management sublayer
CN: Core Network
COTS: Commercial Off-The-Shelf
CSR: Call Success Rate
DAG: Directed Acyclic Graph
DAR: Diagnosis and Recovery tool
DCR: Dropped Call Rate
DL: Downlink
D-S: Dempster-Shafer
DTX: Discontinuous Transmission
EDGE: Enhanced Data Rates for Global Evolution
EIR: Equipment Identity Register
EMD: Entropy Minimization Discretization
EPS: Equivalent Prior Sample
ESA: European Space Agency
EXP: Probability definition based on experience
FACCH: Fast Associated Control Channel
FCCH: Frequency Correction Channel
FCPN: Fuzzy Causal Probabilistic Network
FD: Fault Detection
FDMA: Frequency Division Multiplex Access
fdp: funci´on densidad de probabilidad
FER: Frame Erasure Rate
FH: Frequency Hopping
FOG: Front Office group
gaus: Gaussian belief mapping function
GERAN: GSM/EDGE Radio Access Network
GPRS: General Packet Radio Service
GSM: Groupe Sp´ecial Mobile, Global System for Mobile Communication
HLR: Home Location Register
HO: Handover
HSN: Hopping Sequence Number
HW: Hardware
ICI: Independence of Causal Influence
ID: Identifier
IMEI: International Mobile Equipment Identity
IMSI: International Mobile Subscriber Identity
ISDN: Integrated Services Digital Network
ISO: International Organization for Standardization
ITU: International Telecommunications Union
KA: Knowledge Acquisition
KAT: Knowledge Acquisition Tool
KPI: Key Performance Indicator
LAPD: Link Access Protocol on the D channel
LAPDm: Link Access Protocol on the Dm channel
lrn: learnt parameters
MAIO: Mobile Allocation Index Offset
MAP: Maximum a Posteriori
MDL: Minimum Description Length
MEST: M-estimate
MHA: Masthead Amplifier
MLE: Maximum Likelihood Estimation
MM: Mobility Management sublayer
MS: Mobile Station
MSC: Mobile Switching Center
MOS: Mean Opinion Score
MPD: Minutes Per Dropped Calls
MUI: Multiple Uniform Intervals
net: network cases
NMS: Network Management System
NSS: Network and Switching Subsystem
OMC: Operations and Maintenance Center
OSS: Operation Subsystem
PC: Power Control
PCH: Paging Channel
PCM: Pulse Code Modulation
pdf: probability density function
PDF: Probability Density Function
PLMN: Public Land Mobile Networks
PSTN: Public Switched Telephone Network
PTA: Parque Tecnol´ogico de Andaluc´ıa
QoS: Quality of Service
RACH: Random Access Channel
RAN: Radio Access Network
rect: Rectangular mapping function
ref: reference parameters
RF FH: Radiofrequency Frequency Hopping
ROC: Receiver operating characteristic
RR: Radio Resources Management sublayer
RRM: Radio Resource Management
RX: Receiver
SACCH: Slow Associated Control Channel
SBM: Simple Bayes Model
SBN: Smooth Bayesian Network
SCH: Synchronization channel
SDCCH: Stand alone Dedicated Control Channel
SEMD: Selective Entropy Minimization Discretization
SID: Silence Descriptor
sim: simulated cases
SIM: Subscriber Identity Module
SOM: Self-Organizing Map
Specs: GSM specifications
std: standard deviation
TA: Timing Advance
TCH: Traffic Channel
TDMA: Time Division Multiplex Access
TEXP: Discretization based on experience
trap: Trapezoidal belief mapping function
TRAU: Transcoder and Rate Adaptation Unit
TRX: Radio transmitter and receiver (transceiver)
TS: Troubleshooting
TSG: Technical Support group
TST: Troubleshooting Tool
TT: Trouble ticket
TX: Transmitter
UL: Uplink
UMTS: Universal Mobile Telecommunications Service
VLR: Visitor Location Register
WCDMA: Wideband Code Division Multiple Access
WLAN: Wireless Local Area Network
Chapter 1
Introduction
The aim of this chapter is to explain the purpose of this thesis and its motivation, to describe its objectives and to present the organization of this document.
1.1
Motivation
There is no doubt that during the last decade mobile communications have played an increasingly important role in telecommunications business, and it will continue to do so in the years to come. In most developed countries, the number of mobile telephones has exponentially growth over the last 10 years, in many countries even exceeding the number of inhabitants. Even for domestic use, the predominance of mobile over fix telephony is already a reality. For example, in Spain at the beginning of 2006 the penetration of mobile telephony at homes was 84.3%, whereas 83.5% of the homes had a traditional fix line [31].
The mobile communication industry is currently evolving from Second Generation (2G) towards Third Generation (3G). In the process, more functionalities and new technologies are gradually being added to the existing 2G networks. The first 2G cellular networks, which were introduced in the early 1990s, were based on Global System for Mobile communications (GSM) technology. The evolution began with an upgrade of the GSM network to 2.5G by introducing General Packet Radio Service (GPRS) technology. GPRS provides GSM with a packet data air interface and an IP-based core network. Enhanced Data Rates for Global Evolution (EDGE), which is based on the introduction of a higher speed modulation and improved coding scheme, was a further evolutionary step of GSM packet data. EDGE can handle about three times more data subscribers than GPRS, or triple the data rate for one end-user. GERAN (GSM/EDGE Radio Access Network) is the radio access technology based on GSM/EDGE. In the last years, 3G networks, called Universal Mobile Telecommunications Service (UMTS) networks in Europe, have started to be deployed throughout the world. In the near future, thanks to 3G, mobile internet-services are expected to be available “anywhere and anytime”. Users will surf the Web, check the email, download files or have real time videoconference, in a shopping mall, the airport, the city center or their offices.
Thus, the current scenario comprises a complex set of interrelated and rapidly growing
wireless networks, applications which require increasing bandwidth and users who demand high quality of service at low cost, but with a limited spectrum. In a few years, the highly complex and heterogeneous RAN will comprise different technologies, such as GSM, UMTS and WLAN1. As a result, the management of the RAN will be a tough challenge that the operators will have to tackle.
In addition, new technologies are foreseen to revolutionise the industry of telecommunica-tions. For example, the increasing expansion of IP telephony, the wide availability of WLAN based broadband access or the launch of telephony based on WLAN (e.g. Skype [6]) is po-tentially posing a real threat to the business of mobile operators. Therefore cellular network operators have to find ways to reduce the cost of their services and improve their quality to counter the threat posed by the emerging technology.
In a mature cellular network that has undergone most of its site roll-out, the major cost is associated to the operation of the network. As the network consists of a high number of pieces of equipment that are distributed across the entire country, maintaining and operating this large and technically complicated system is a difficult task that requires operator personnel around the clock in several regional offices. For example, GSM networks in Europe may consist of about 10.000 sites covering the entire country. Due to the large size of the networks, it is common that some of the deployed equipment does not work as planned. The consequence of such problems is poor end-user service. As, in most countries, several operators are competing for subscribers, it is imperative to rectify such occurrences because otherwise users will be dissatisfied with the service and thus will likely switch to competing network operators. Hence, fault management, also called troubleshooting (TS), is a key aspect of operating a cellular system in a competitive environment. As the Radio Access Network2 (RAN) of cellular systems is by far the biggest
part of the network, most of the TS activities are focused in this area.
TS comprises the isolation of faulty cells (fault detection), the identification of malfunctions (diagnosis) and the proposal and deployment of healing actions (solution deployment/fault re-covery). Currently, in most cellular networks, TS is a manual process, accomplished by RAN experts. These engineers are applying a series of customized checking routine on a daily basis in order to identify the cause of the problem. During the procedure, several applications and databases have to be queried to analyze performance indicators, cell configurations and alarms. The speed in identifying faults is dependent on the level of expertise of the troubleshooter, the type of information available and the quality of the tools displaying relevant pieces of infor-mation. This means that, in addition to a good understanding of the possible causes of the problems, a very good understanding of the tools available to access the sources of information is also required.
In this scenario, the benefits of automating TS are numerous. With the help of an automated TS tool, the time required to identify the reason for a fault causing a problem is greatly reduced.
1WLAN: Wireless Local Area Network
2
This means that network performance is enhanced as the downtime and the time with reduced quality of service (QoS) is significantly limited. In addition, by automating the TS process, fewer personnel and, thus, fewer operational costs are necessary to maintain a network of a given size. The TS process is de-skilled as the majority of problems can be rectified with the help of the automated TS tool. Then, the knowledge of highly experienced staff, which is released from the TS work, can be utilized for other aspects of network optimization, thereby further increasing network performance. One additional benefit is that the knowledge in TS can be stored in the TS tool, therefore not being dependent on the staff working for the company at any time. In conclusion, the gains achieved thanks to automated TS for an operator are significant as fewer personnel with a lower skill level can solve more network problems in less time.
The first steps in automation of troubleshooting in the RAN of cellular networks have been focused on performance visualization and on fault detection (FD) [124, 47, 132, 123, 104, 133, 48]. On the one hand, thanks to methods to achieve efficient visualization of the network performance, FD and diagnosis are carried out more easily. On the other hand, several methods have been proposed for FD, which consist in building models for the normal behavior of the system. The deviations of the available measurement variables from the normal behavior can then be detected with some type of abnormality detector.
Research studies in automation of diagnosis in the RAN of cellular networks have been focused on alarm correlation [193, 84, 192, 88]. In current cellular networks, most systems are semi-intelligent and generate alarm messages when errors occur. The abstraction level of these alarm messages is normally very low, leading to a high number of alarms for any single cause. For example, when a link fails, up to 100 or more alarms are generated and passed to the Network Management System. Those alarms should be converted into a minimum number of alarms which clearly pinpoint to the breakdown of a link. Alarm correlation [109, 202] consists in the conceptual interpretation of multiple alarms, so that new meanings are assigned to the original alarms. It is a process that involves different tasks: reduction of multiple occurrences of an alarm into a single alarm, inhibition of low priority alarms in the presence of higher priority alarms, substitution of a specific set of correlated alarms by a new one, etc. This way, alarm correlation systems are required to filter and condense the incoming alarms to meaningful high level alarms in order to avoid overloading the operators. Although alarm correlation can be considered a first step in the diagnosis of faults, alarms do not provide enough information to identify the cause of problems, especially if the possible causes are not only faults in pieces of equipment. Even after alarm correlation, the number of triggered alarms for a single cause is normally very high. In addition, the same alarms may be triggered by different causes. Due to these reasons, in order to achieve a conclusive diagnosis, it is important that not only alarms are taken into account, but also network performance indicators. Because of the lack of studies related to this last aspect, this thesis is focused on automatic diagnosis in the RAN of cellular networks based on performance indicators.
1.2
Preliminaries
In the year 2000, Nokia Networks opened a Research Center for Mobile Communications at the Parque Tecnol´ogico de Andaluc´ıa (PTA) in M´alaga. This center was created in the framework of a cooperation agreement between Nokia and the University of M´alaga (in particular with the Grupo de Ingenier´ıa de Comunicaciones). The staff was composed of experienced Nokia personnel, as well as more than 50 new employees and lecturers from University of Malaga.
three above-mentioned skills. Firstly, an equipment vendor like Nokia, can provide alarms (i.e. “when a value is below/above a certain level”) and performance indicators, but only TS en-gineers from network operators know about the actual meaning (or lack of meaning) of such alarms and performance indicators in actual networks. This knowledge can not be simulated or predicted, but it has to be acquired via years of hands-on experience. However, although the TS engineers have the TS knowledge, they generally lack the theoretical bases on automatic TS systems (e.g. which artificial intelligence technique to use, how this work, how to create the TS system, etc). Secondly, engineers from manufacturers of network equipment are not only experts in equipment, but they also have a general knowledge on mobile communications. Finally, researchers from university provide their expertise in theory of mobile communications and artificial intelligence.
The troubleshooting group was composed of staff in Spain, UK and Denmark. Moreover, the group worked with operators in UK and Denmark. My responsibility was the research part of the project, and that constituted the starting point of this thesis. Later, I was not only involved in research, but also in the specification of prototypes for diagnosis and in meetings with cellular networks operators.
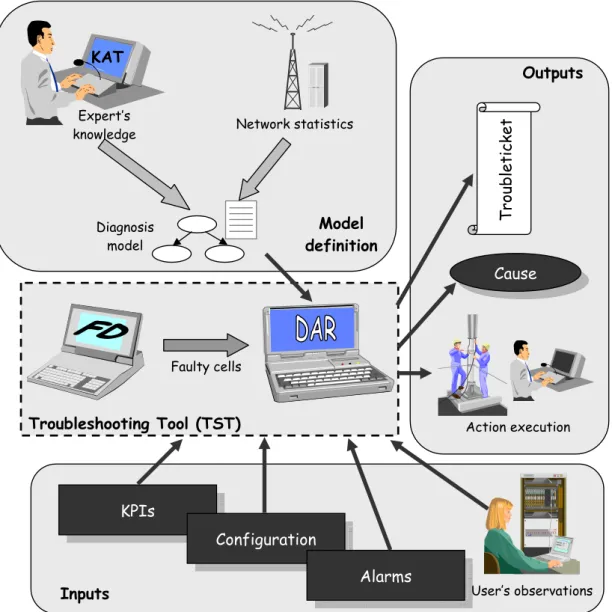
Operators would only be interested in a cooperation if the TS tool could demonstrate its ability in their networks. Furthermore, in order to define an accurate model, the prototype had to be constantly tested with operators. As the initiative was driven by Nokia, the aim was to provide a “platform” on which the operator knowledge could be first gathered and then executed. Thus, two prototype tools were implemented: a troubleshooting tool, which carried out the automatic diagnosis, and a knowledge acquisition tool, which obtained the knowledge from TS experts and built the TS model. In addition, a TS model for GERAN was created thanks to the cooperation with the network operators. Bayesian Networks were the technique used to deploy the automatic TS system. The TS model was based on knowledge only, that is, no previous examples were used to obtain the parameters of the model.
Unfortunately, due to major re-structuring, Nokia closed its entire center in M´alaga in June 2003 and, consequently, the troubleshooting project was also stopped. However, as defining an automatic TS system was still an important pending issue in current and future cellular networks, and the objectives of my thesis were clear, my research continued on this topic.
Some months later, other projects came to support this thesis. Firstly, in 2003, the Spanish Ministry of Science and Technology funded a research project of the Communication Engineering Department named “Radio resources optimisation tools for mobile communication networks”. One of the lines of this project was automatic diagnosis.
named Moltsen TheCure [5], has been deployed.
1.3
Objectives
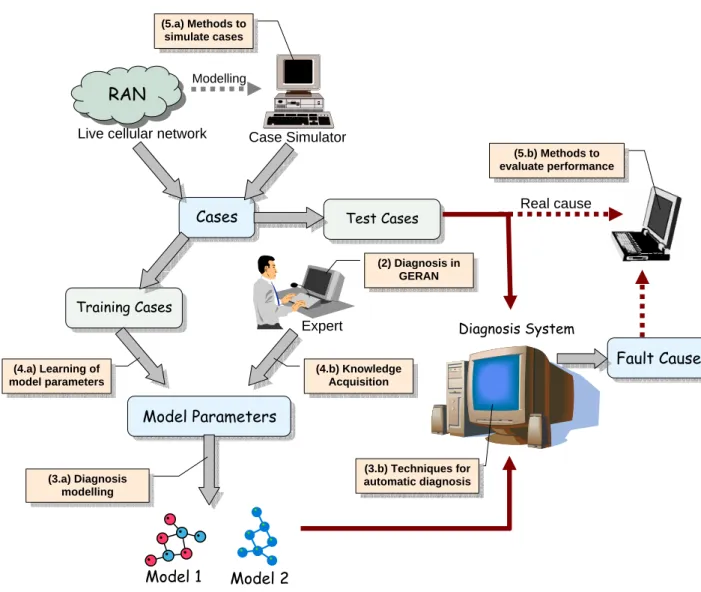
The main aim of this thesis is the design of an automatic diagnosis system for the RAN segment of cellular networks. Fig.1.1 summarizes the scenario and the location of the specific objectives (squared yellow boxes) of this thesis. Firstly, acase is defined as a set composed of a fault cause in a cell and the value of its symptoms and related parameters. As observed in Fig.1.1, cases can be obtained from two sources: a live cellular network and a case simulator. At this point, one of the objectives of the thesis (5.a) is to define methods to simulate cases. Cases can be used for two different purposes: as training examples for model learning or as test cases for diagnosis. In the former, another aim of the thesis can be found (4.a): to design methods to learn the model parameters based on training cases. Alternatively, model parameters can be elicited by diagnosis expert. Hence, another objective (4.b) is to develop techniques to ease knowledge acquisition. Experts may build a specific model for diagnosis in GERAN. The definition of that model is defined in objective (2). Another objective (3.a) is the proposal of diverse techniques to model diagnosis. In Fig.1.1 different models (Model 1, Model 2) are represented, which differ in the modelling technique applied to build them. Once the model is defined, and their parameters are incorporated, it is used by the diagnosis system to assess the fault cause. At this point, another objective (3.b) of the thesis is to define methods for automatic diagnosis. The inputs to the diagnosis system are the symptoms and configuration parameters in the test cases. In order to evaluate the performance of the diagnosis system, its output, i.e. the diagnosed fault cause, is compared with the real cause. At this point, an objective (5.b) is the definition of methods to evaluate and compare diagnosis systems. In addition to the objectives shown in Fig.1.1, a prior objective is the analysis of the state-of-the-art (1).
In summary, the objectives of this thesis can be structured in:
1. Problem approach. At a first stage, a survey on how troubleshooting is currently performed in existing cellular networks should be carried out. This part is considered to be very important because the troubleshooting procedure is not documented in the existing literature. In addition, different techniques for automatic diagnosis, which take into account the inherent uncertainty in human reasoning, should be examined.
2. Diagnosis in GERAN. The techniques for automatic diagnosis proposed in this thesis should be valid not only for 2G networks, but also for 3G and future cellular networks. Nevertheless, a secondary objective of this thesis is to propose a system for automatic diagnosis in GERAN. With this aim in mind, the main fault causes in GERAN, their symptoms and other related parameters should be identified and interrelated.
RAN
Cases (5.a) Methods to
simulate cases
Model 1 Model 2
Training Cases
Test Cases
(4.b) Knowledge Acquisition
Model Parameters
Expert
(4.a) Learning of model parameters
Fault Cause
(3.a) Diagnosis modelling
(2) Diagnosis in GERAN
(5.b) Methods to evaluate performance
Real cause
(3.b) Techniques for automatic diagnosis
Diagnosis System Case Simulator
Live cellular network
Modelling
CH.1.
Introduction
CH.2.
Automation and Optimization
CH.3.
Diagnosis techniques
PART I.
Background
CH.4.
Diagnosis in GERAN
CH.5.
Modelling of diagnosis
PART II.
Modelling
CH.6.
Evaluation of diagnosis systems
CH.7.
Conclusions
PART III.
Evaluation
Figure 1.2: Organization of the thesis report
of faults should be done. The main elements of the model and its parameters should also be investigated at this stage (3.a).
4. Model construction. In order to define the parameters of the diagnosis model, two alternative solutions should be analyzed. On the one hand, the model may be defined by diagnosis experts. Hence, an objective (4.b) will be to study how to convert the specifications provided in natural language by those experts into diagnosis models. This is called knowledge acquisition. On the other hand, the model can be learnt from training examples. Thus, another target (4.a) will be to develop methods to automatically learn the parameters from those training cases.
5. Model evaluation. The last objective is to design techniques to evaluate diagnosis systems. Firstly (5.a), an algorithm should be developed to generate cases, that is to simulate the behavior of the network in the presence of faults (Case simulator). Secondly, a set of evaluation methods will be proposed (5.b). They will be used to assess the performance and to compare the different diagnosis systems presented in this thesis. Two different aspects will be considered: the performance measured by different figures of merit and the sensitivity of the results to imprecision in model parameters.
1.4
Guide for the reader
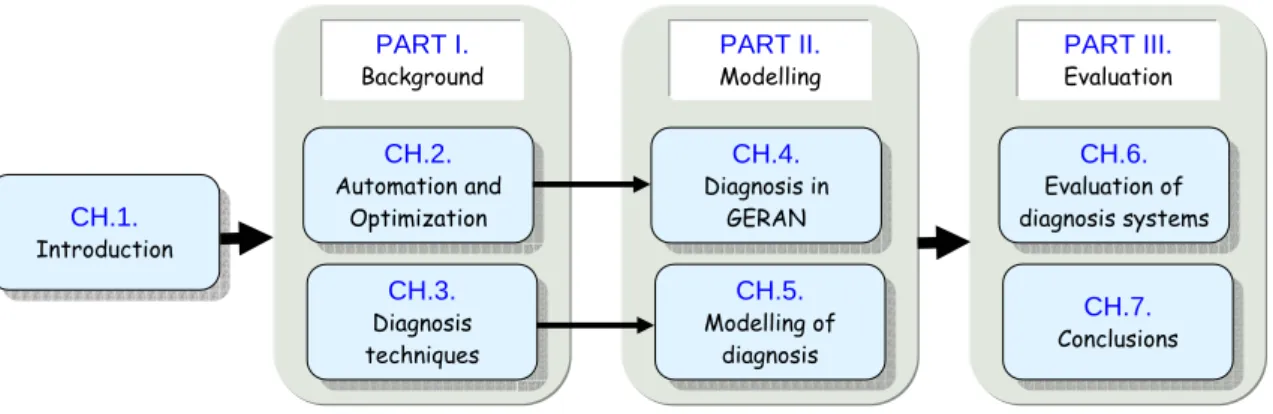
The organization of this thesis report (Fig.1.2) is directly related to the objectives presented above. The first chapter corresponds to this introduction to the thesis. The rest of the document is organized in three parts.
how troubleshooting is performed in current cellular networks. In addition, a brief introduction to GSM is provided. Chapter 3 is focused on artificial intelligence techniques used in other disciplines for automatic diagnosis. Amongst them, the most appropriate technique for cellular networks is selected.
The second part of this document is devoted to the design of automatic diagnosis systems. It is also composed of two chapters. Chapter 4 studies diagnosis in GERAN. Hence, the main causes, symptoms and related parameters to be taken into account in diagnosis are analyzed in this chapter. Chapter 5 proposes models and techniques to automate diagnosis, valid not only for 2G networks, but also for 3G or future cellular networks.
Finally, the third part of the thesis is dedicated to the evaluation and comparison of the systems proposed in Part II. In Chapter 6 the methodology to obtain simulated cases is described. In addition, the design of the experiments, the methods for sensitivity analysis and the figures of merit will be also explained in this chapter. Results obtained with the systems proposed in Part II, following the previously explained evaluation methodology, are also presented in this chapter and in appendixes A-D. Chapter 7 summarizes the main conclusions of the research and proposes future lines of action.
Part I
Background
Chapter 2
Automation and optimization in
cellular networks
This chapter outlines the importance of automation and optimization in cellular networks. In the last few years, driven by the increasing complexity of networks, the attention of cellular network operators is turning to the study of methods to achieve more efficient network management. On the one hand, the multi-service capabilities of 3G networks will bring new challenges to network operation and maintenance. On the other hand, in the very near future, different radio access technologies, such as GSM, UMTS and IEEE 802.11 (WLAN) will coexist within the same network. It will not be feasible to carry out the operation of these multi-system networks with the manual procedures employed in current networks. Therefore, automation of network management is crucial to face the forthcoming changes in the mobile telecommunication industry.
In this thesis, a methodology for automatic troubleshooting of the radio access part of cellular networks is proposed. The described methods are valid for any network, such as 2G, 3G or WLAN networks if minor modifications are applied. The proposed methodology has been applied to build a diagnosis model for GSM/GPRS networks. The reason for choosing GSM is five-fold: 1) the existence of live networks from which to obtain data to build the models and test the designed systems, 2) well established processes for TS (although not well documented in the public domain), 3) stability of the software and HW used by operators 4) strong operator interest due to cost pressure, 5) GSM will be used for many years to come.
This chapter is divided into two parts. In the first part, the basics of GSM networks are summarised. Special attention is drawn to those aspects of GSM required to follow the rest of this thesis. The second part of the chapter is a survey on automation in mobile communica-tion networks. Firstly, the importance of automacommunica-tion and optimisacommunica-tion in cellular networks is highlighted. Subsequently, it is described how troubleshooting is carried out in current cellular networks. Finally, the principles of automatic troubleshooting are presented and the state of the art is analyzed.
2.1
Preliminaries
2.1.1 Overview of the GSM system
The main characteristic of Public Land Mobile Networks (PLMN) is that they allow the user to move within their coverage area. The coverage area of a given operator is divided into geographical areas referred as cells, each of them covered by a base station, i.e. mobiles in this cell can connect to the fixed part of the network via that base station through a radio link. The user interface to the PLMN is themobile station (MS).
Currently, the most deployed cellular network standard is by far GSM. Although the tech-niques proposed in this thesis are also valid for other cellular networks, such as UMTS, models have been built for GSM networks. Some basic characteristics and definitions related to GSM are the following:
• Good speech quality comparable to that of fixed networks.
• Support for new services and facilities.
• Authentication of users and equipment.
• Security in the calls.
• Interworking among equipment from different manufacturers.
• Interworking with the existing fixed networks (PSTN1, ISDN2, data networks, etc.).
• Internationalroaming: with a unique number, clients can generate and receive calls from most countries in the world.
• Location: at any moment the network must know where each subscriber is situated, so that incoming calls can be routed.
• Paging: when there is an incoming call, the network must broadcast a signal to the MSs in thelocation area3 where the MS destination of the call is situated.
• Handover (HO): it is the switching of an on-going call4 to a different channel or cell. The
continuity of the call should be assured by the network.
There are numerous books and journals related to mobile communications and, in particular, to GSM. For an introduction, readers are referred to [142, 161, 162, 145, 90, 7]. The following sections are focused on those aspects of GSM that are more related to this thesis. In Section 2.1.2, the architecture of the GSM network will be described. In Section 2.1.3, signalling protocols in the radio interface will be summarized. In Section 2.1.4, the channel structures will be enumerated. Finally, in Section 2.1.5, network management will be introduced.
1
PSTN: Public Switched Telephone Network 2ISDN: Integrated Services Digital Network
3
Location area: area in which a MS can move without changing its location registry in the network. When there is an incoming call, a paging is sent to all MSs in the location area
GMSC
BSS
BTS
BTS
BTS
BTS
BTS
BTS
BSC
Abis
NMS
RTB
RDSI
NSS
MSC
HLR
VLR
AuC EIR
A
Um
MS
Figure 2.1: Architecture of a GSM network
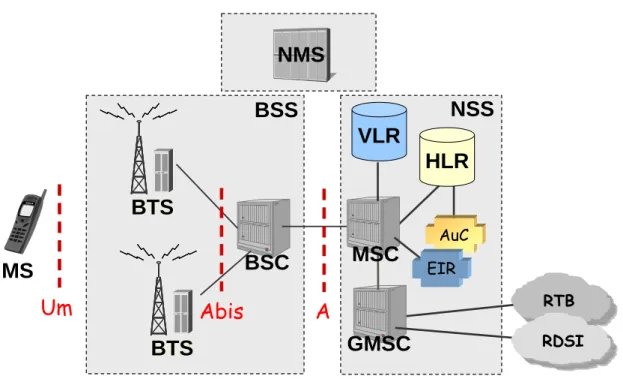
2.1.2 Architecture of the GSM network
The GSM network is hierarchically organized in subsystems (Fig.2.1), which in turn are com-posed of functional entities. TheBase Station Subsystem (BSS) controls the radio links with the MSs. TheNetwork and Switching Subsystem (NSS) performs the routing of calls and handles the mobility management operations. The Operations and Maintenance Center (OMC), also namedNetwork Management System (NMS) andOperation Subsystem (OSS) is used to oversee the proper operation and setup of the network. The interfaces between the subsystems and entities are denoted by letters. The interface between the MSs and the network is the radio interface, also referred as air interface orUm interface. The BSS is linked to the NSS through theA interface.
The MS consists of the mobile equipment (the terminal) and a smart card called the Sub-scriber Identity Module (SIM). The SIM provides personal mobility, so that the user can have access to subscribed services irrespective of the specific terminal. The mobile equipment is uniquely identified by theInternational Mobile Equipment Identity (IMEI). The SIM card con-tains theInternational Mobile Subscriber Identity (IMSI) used to identify the subscriber to the system, a secret key for authentication, and other information.
conditioning, etc.). The BTS is also in charge of the signal processing. The BSC controls several BTSs and it handles the radio interface management, e.g. allocation and release of radio channels and handover management.
The NSS includes the main switching functions of GSM and the databases required for subscriber data and mobility management. The main function of the Mobile Switching Center (MSC) is call routing. In addition, it provides other functionalities, such as the connection to the fixed networks (e.g. PSTN or ISDN), registration, authentication, location updating and handovers. There are four different types of handover in GSM, which involve transferring a call between: channels (time slots) in the same cell, cells (BTS) under the control of the same BSC, cells under the control of different BSCs, but belonging to the same MSC and cells under the control of different MSCs. The first two types of handover, called internal handovers, involve only a single BSC. They are managed by the BSC without involving the MSC, except to notify it at the completion of the handover. The last two types of handover, called external handovers, are handled by the involved MSCs. The MSC works in conjunction with several functional entities. Thus, associated to each MSC there is a temporal database named Visitor Location Register (VLR), which contains dynamic administrative information for each mobile currently located in the geographical area controlled by that VLR, necessary for call control and provision of the subscribed services. The Home Location Register (HLR) contains all the administrative information of each subscriber registered in the corresponding GSM network, along with the current location of the mobile. The location of the mobile is typically in the form of the signalling address of the VLR associated with the mobile station. The other two registers are used for authentication and security purposes. TheEquipment Identity Register (EIR) is a database that contains a list of all valid mobile equipment on the network, where each mobile is identified by its IMEI. TheAuthentication Center (AuC) is a database that stores a copy of the secret key saved in each subscriber’s SIM card, which is used for authentication and encryption over the radio channel.
The NMS interacts with the BSS and NSS subsystem and it handles most aspects of the network management. The main functions of the NMS can be divided into three categories: fault management, performance management and configuration management. The purpose of the Fault Management is to ensure the smooth operation of the network and the rapid correction of any kind of problems that are detected. Fault management provides the network operator with information about the current status of alarm events and maintains a historical database of alarms. The purpose of the Configuration Management is to maintain up to date information about the operation and configuration status of the network elements and to enable efficient handling of these. In Performance Management, the NMS collects measurements from individual network elements and stores them in a database. On the basis of these data, the network operator can compare the actual performance of the network with the planned performance and detect both good and bad performance areas within the network.
Layer 1 LAPDm
RR MM
CM
Um
RR
LAPDm
Layer 1
MS
BSS
MM CM
MSC
A
Figure 2.2: Signalling protocol structure in GSM
This thesis is focused on theRadio Access Network (RAN5), which guarantees the connection between the MSs and the core network. The RAN in GSM/GPRS, which is called GERAN, comprises the MSs and the BSS.
2.1.3 Signalling protocols in the radio interface
Fig.2.2 shows the signalling protocols in the GSM RAN. Layer 1 is the physical layer of the radio interface, which contains the functionalities required to transmit the information over the radio channels. Hence, the physical layer is organized in physical and logical channels (see Section 2.1.4). The physical layer is in charge of associating physical and logical channels, channel coding, information ciphering, cell selection in idle mode and supervision of the communication quality.
The aim of layer 2 is to establish a secure and reliable signalling link between the MS and the network. The protocol is called LAPDm, which is based on a modification of the LAPD protocol used in ISDN.
Layer 3 is in charge of signalling between the MS and the network and it is composed of three sublayers: RR, MM and CM. TheRadio Resources Management (RR) sublayer controls the setup, maintenance, and termination of both radio channels and connections with the MSC. In addition, it handles the management of radio features such as power control, discontinuous transmission and timing advance (see Chapter 4). The execution and measurements required for handovers are also responsibility of the RR layer. TheMobility Management (MM) sublayer handles the functions that arise from the mobility of the subscriber, as well as the authentication and security aspects. The former implies the required procedures to update the location in the VLR and HLR. Security includes the authentication of users to prove that they are who they
5
claim to be, identification of mobile equipment, ciphering and assignation of temporal identities. The Communication Management (CM) sublayer is responsible of procedures related to call control and set-up, supplementary service management, and short message service management.
2.1.4 Channel structures
The GSM radio interface combines Frequency Division Multiplex Access (FDMA) with Time Division Multiplex Access (TDMA). On the one hand, the frequency band is divided into 124 carrier frequencies spaced 200 kHz apart. One or more carrier frequencies are assigned to each BTS. The radio links are duplex, that is two different carriers are used for the uplink6 and for the downlink7. Each pair of frequencies is denoted as a radiochannel. On the other hand, the time is divided into frames and each frame is divided into 8 time slots of about 0.577 ms. In this way, 8 physical channels are provided over each radiochannel. Therefore, a bidirectional physical channel between a BTS and a MS is defined by the radiochannel frequency and the time slot assigned to that communication.
A logical channel is an information stream dedicated to the transfer of a specific type of information over the radio interface [9]. Logical channels can be classified depending on their usage into two groups: common channels and dedicated channels. Common channels are those channels which transmit signalling information common to all mobiles in a cell. Amongst all the carriers transmitted in a cell, one of them works as beacon carrier and its time slot 0 is used to transmit the common channels. This carrier is denoted as BCCH carrier, because the BCCH logical channel goes onto that carrier. The most important common channels are:
• FCCH (Frequency Correction Channel): It carries information from the BSS for carrier synchronization.
• SCH (Synchronization channel): It carries information from the BSS for frame syn-chronization.
• BCCH (Broadcast Control Channel): It broadcast on the downlink information such as the BTS identity or the location area. This channel is continuously active because its signal strength is monitored by mobiles for handover purposes.
• PCH (Paging Channel): It is used by the network to call for a mobile when it has an incoming call.
• RACH: (Random Access Channel): it is used by the mobiles when they need to access the network.
• AGCH (Access Grant Channel): It is used by the system to assign a dedicated channel to a mobile.
6
Dedicated channels transmit information of an established connection between a MS and the network. The most common dedicated channels are:
• TCH/F (Traffic Channel Full Rate) and TCH/H (Traffic Channel Half Rate): They are the bidirectional traffic channels used to carry speech and data. There are two types of TCH: full rate and half rate, which are distinguished by the channel period.
• SACCH (Slow Associated Control Channel): It is the signalling channel associated to a traffic channel. It is used to transmit the required information to manage the radio resources, such as downlink level and quality measurements.
• FACCH (Fast Associated Control Channel): It is a signalling channel associated to a traffic channel. It is used to transmit information that cannot wait until the corresponding SACCH arrives, such as the handover information.
• SDCCH (Stand alone Dedicated Control Channel): This channel is used for call setup, location updating and transmission and reception of short messages.
Traffic channels are defined using a 26-frame multiframe (i.e. a group of 26 TDMA frames). Out of the 26 frames, 24 are used for traffic, one is used for the SACCH and one is currently unused.
2.1.5 Network management
Diagnosis is one of the main tasks in network management. Network management is responsible for the efficient operation and organization of telecommunication networks. ISO8 together with ITU9 standardized network management following the OSI Reference Model. Functional areas defined by the standard are:
• Fault management, which is responsible for detection, isolation and correction of network faults.
• Configuration management, which provides the operators with the means to define, control and monitor network elements in order to maintain a reliable communication network
• Accounting management, which deals with managing the billing and charging system, calculating the cost of network services
• Performance management, which handles the execution of performance measurements by monitoring and analysing the managed network elements and services
• Security management, which ensures that the information exchanged by the network is not corrupted.
8