Man-pack Antenna At X-band
José Manuel Tnclán Alonso, Manuel Sierra Pérez
Abstract—In this paper a low cost man-pack antenna for satellite communications at X band is presented. The antenna has dual circular polarization in Tx and Rx.
I. INTRODUCTION
This antenna has been conceived as a portable antenna for satellite communications. The antenna should be light-weight and easy to carry and deploy. A square structure has been selected formed by a set of 16 subarrays of 16 elements in a rectangular grid. The antenna covers the whole X-band (7.25-8.4 GHz) and can work in both circular polarizations in transmission and reception. The antenna must meet requirements in gain (>26 dB), price (commercial purpose) and band (17.4 % relative band width).
II. ANTENNA STRUCTURE
The antenna is divided in 4x4 subarrays. The radiating element is a double stacked patch fed with two probes with a quadrature signal. To obtain the quadrature signal a miniaturized branch line circuit is used [1]. Each Subarray contains 4x4 radiating elements spaced 0.6
^0-To distribute the signal among the subarrays two low losses power distribution networks are used (one for each polarization). These power distribution networks are made in shielded stripline technology.
To connect the subarrays to the stripline an ad-hoc connector system is used. These connectors have been designed to be pluggable, low losses and easy to manufacture.
The antenna structure is shown in Figure 1.
Subarray -< | ' '
Power distribution^
networks
I •—• I
SMA input/output
Figure 1 Antenna structure
To reduce the side lobe levels a tapering is used among subarrays. The subarrays of the corners receive less power than the center subarrays as it is shown in Figure 2.
0.6
O.S
o.s
0.6
O.S
1
1
0.8
O.S
1
1
O.S 0.6
O.S
0.B
0.6
Figure 2 Power distribution among subarrays
Sequential rotation technique is also used among 2x2 subarrays for improving the axial ratio.
III. SUBARRAY
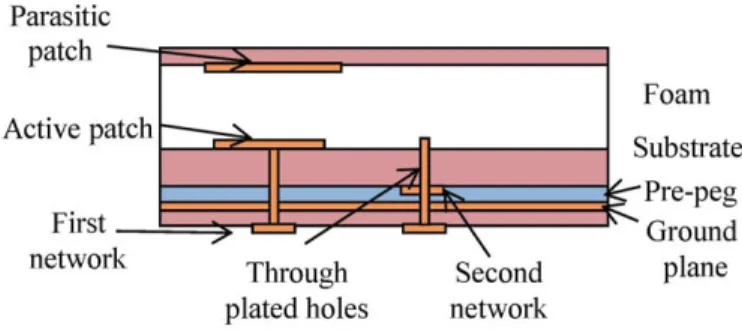
The material used in the subarrays is RO4350B because of its low manufacturing price. The subarray has two distribution networks for each polarization. Each network is in a separated layer. To communicate both networks through plated holes are used instead of blind or buried plated holes to reduce the manufacturing cost. The second network uses 3 pre-peg as a substrate instead of adding another substrate. The active patch and the second network are printed in the same substrate.
A scheme of the subarray layers is shown in Figure 3. Ad-hoc
connector system
Parasitic patch
~-Active patch
First,
network ^
zz:
^•zi
~7Through ^ Second network
Foam Substrate 1 ^ Pre-peg ' Ground plane plated holes
Figure 3 Subarray layer scheme
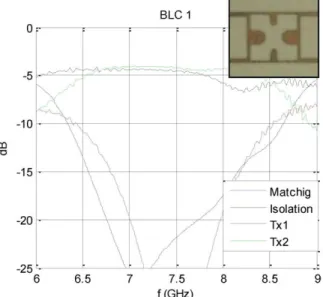
in about 30% using the substitution of quarter wavelength line by a line with a stub explained in [3].
In Figure 4 is shown the measurements of the hybrid circuit. In this measurements the losses of the connectors and the feed lines are included. These losses are around 1.5 dB.
Patch
B L C 1
-5
-10
-15
-20
-25
VA
Y1
Efl
^Wvw
JL
Matchig
Isolation Tx1
Tx2
6.5 7 7.5
f (GHz)
8 8.5
Figure 4 Miniaturized branch-line measurements
A test board was manufactured to check the behavior of a single patch. This test board is shown in Figure 8.
Bottom view Top view
Figure 5 Patch test board
The patch optimizacion has been done focusing in reducing coupling between probes. Figure 6 shows the mesurements of a simple patch withour hybrid circuit. The coupling between probes is under -20 dB t X-band. The matching is a bit worse since the optimizacion was focused in coupling but it is under 15dBatX-Band.
~5r
-10
V-S - 1 5 ^
Matching Coupling
A \
A \
j
1
vA^[il\,
r
A
- 3 0 ^
6.5 7 7.5
f(GHz)
8.5
Figure 6 Single patch measurements
The mesurement of a patch with a miniaturized branch line hybrid circuit is shown in Figure 7. The matching in this case is related with the coupling between probes in the patch and the matching of the hybrid circuit. On the other hand the coupling between polarizations in this case is related with the matching of the patch since the rebound signals in the path go to the isolated port of the hybrid circuit.
0
-5
-10
g -15
-20
-25
-30
e
^J^^,A-,
\ \
3 6 Patch
^ \^
\ \
\ j
5
+ hybrid circuit
\
\
^
7 7
f ( G
F r r
Maiunirig QQiirJinn
X
5 Hz)
Í
A
"K1"'» ft
r^'^AÁ
-^
3 8.5 S
Figure 7 Patch with hybrid circuit measurements
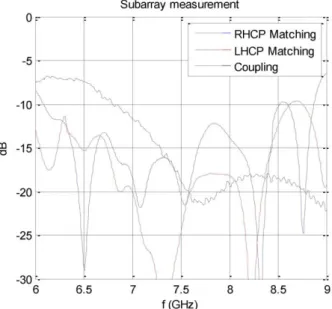
The manufactured subarray is shown in Figure 8. To measure the subarray in anechoic chamber a standard SMP-coaxial connector has been used.
100 mm
<- ->
The matching of each polarization and the coupling between polarizations of a subarray are shown in Figure 9. The matching for LHCP polarization is better than the matching for RHCP polarization since the RHCP polarization is in a different layer than the hybrid circuit and two jumps between layers must be done (making worse the matching). The coupling between polarizations is less than 15 dB in the whole band, similar to the coupling of one single element.
Subarray measurement
-5
-10
S -15
-20
-25
-30
F F
- RHCP Matching - LHCP Matching - Coupling
±±t
— A76.5 7.5 8
f (GHz)
8.5
Figure 9 Subarray S-parameters measurements
The subarray radiation pattern for one polarization is shown in Figure 10. The differences in the side lobe levels are because of the presence of lines next to the active patch.
20
r-1oL
5
r
o^
-o ° r
LHCP Subarray radiation pattern at 7.9 GHz
CP 0° CP 135° XP 0° XP 135°
-10
~15
-20
-25
-30 ^
-50 0
9(°)
50
Figure 10 LHCP subarray radiation pattern
I V . AD-HOC CONNECTOR SYSTEM
In previous prototypes commercial pluggable connectors has been used [2] [3]. The losses in the commercial connectors were higher than the losses in the power distribution network. For this reason an ad-hoc pluggable connector system is used in this prototype. The first test of this connector is shown in Figure 11.
Figure 11 Prototype of the ad-hoc connector
The inner conductor of the subarray side and the inner conductor of the stripline side are coupled through a virtual short-circuit. The two grounds could be also coupled in the same way.
The measurements of this ad-hoc connector are shown in Figure 12. The matching in the whole band is better than 18 dB and the maximum losses are around 0.25 dB. Regarding the losses, the improvement is very high if we compare it with commercial pluggable connectors used in previous prototypes in which the losses were around 0.5 dB per each connector.
-10 r
Connector Through
-30
Matching Losses
A/V
\ /
•\0
.0.2
J-0.4
6.5 7.5 8 8.5
f(GHz)
9.5 10
Figure 12 through ad-hoc connector measurements
V . POWER DISTRIBUTION NETWORK
(distance between line and the ground planes) must be large. To avoid the propagation of TE modes the line must be shielded. The distance between walls must be larger enough to not interfere with the dominant Quasi-TEM mode and smaller enough to cut off the TE modes.
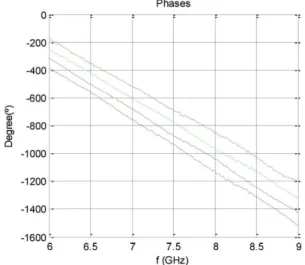
Sequential rotation technique is used among each 2x2 subarrays to improve the axial ratio. For this reason a 90° phase shift is added in each output. A first prototype of 2x2 outputs is shown in Figure 13. This prototype was built to check the behavior of the line and the transitions between the stripline and the ad-hoc connector. The ad-hoc connector shown in Figure 13 is not the final one since this connector has to have an SMA output to measure the line.
200 mm
Figure 13 2x2 power distribution network
The measured phase shifts among each input of the 2x2 power distribution network are shown in Figure 14. The phase difference among each port is 90° at center frequency to compensate the rotation of each subarray.
Phases
°r
-200 k
-400 p
-600 U
0)
2 -800 k
0) Q
-ioooh
-1200 H
-1400 k^
- 1 6 0 0 ^
6.5 7.5
f(GHz)
8.5
Figure 14 Measured phase shift of 2x2 power distribution network
The S-parameters of the 2x2 power distribution network are shown in Figure 15. The matching has moved to lower frequencies in the prototype. This displacement is caused by the ad-hoc connector and for next prototypes this connector has been redesigned to work better in the upper band. The
losses at frequencies where the network is matched are around 0.4 dB. Therefore, the expected losses for the whole network would be under 0.6 dB.
-10
S -20
-30 ^
\ / M
M
^
\
/ / /
i
\ Match Losse
\ /
I
1
> /
Y / / /
ling s
/
\ / \ /
\ /
' / Í /
"A /
v y \ W\
\
\
6 6.5 7 7.5 8 8.5 9 f(GHz)
Figure 15 Measured S-parameters of the 2x2 power
The first prototype of the whole network with the ad-hoc connector system is shown in Figure 16. This network cannot be measured since the final ad-hoc connectors are thought to be connected directly to the subarrays without following any standard.
Figure 16 Power distribution network with ad-hoc connectors
The input/output of the antenna is done through SMA connectors. For this reason a smooth transition between the Quasi-TEM mode of the line and the TEM mode of the SMA has been designed and tested.
ACKNOWLEDGMENT
[1] Wen-Ling Chen, Guang-Ming Wang, "Design of Novel Miniaturized Fractal-Shaped Branch-Line Couplers", Asia-Pacific Microwave Conference, APMC 2007, 11-14 December 2007, pp. 1 -3.
[2] J.M. Inclan Alonso, A. Garcia Aguilar, L. Vigil Herrero, J.M. Fernandez Gonzalez and M. Sierra Perez, "Modular Planar Antenna for Satellite Communications," in Proceeding of XXX URSI General Assembly and
Scientific Symposium of International Union of Radio Science., August
2011.
[3] A. Garcia Aguilar, J.M. Inclan Alonso, L. Vigil Herrero, J.M. Fernandez Gonzalez and M. Sierra Perez,, "Low-profile dual circularly polarized