ALMA Observations of Gas-rich Galaxies in
z
∼
1.6 Galaxy Clusters:
Evidence for Higher Gas Fractions in High-density Environments
A. G. Noble1, M. McDonald1, A. Muzzin2, J. Nantais3, G. Rudnick4, E. van Kampen5, T. M. A. Webb6, G. Wilson7, H. K. C. Yee8, K. Boone9, M. C. Cooper10, A. DeGroot7, A. Delahaye6, R. Demarco11, R. Foltz7, B. Hayden9,12, C. Lidman13,
A. Manilla-Robles5, and S. Perlmutter9,12 1
Kavli Institute for Astrophysics and Space Research, Massachusetts Institute of Technology, 77 Massachusetts Avenue, Cambridge, MA 02139, USA
2
Department of Physics and Astronomy, York University, 4700 Keele Street, Toronto, ON MJ3 1P3, Canada
3
Departamento de Ciencias Físicas, Universidad Andres Bello, Fernandez Concha 700, Las Condes 7591538, Santiago, Región Metropolitana, Chile
4
The University of Kansas, Department of Physics and Astronomy, 1251 Wescoe Hall Drive, Lawrence, KS 66045, USA
5
European Southern Observatory, Karl-Schwarzschild-Strasse 2, D-85748 Garching bei München, Germany
6
Department of Physics, McGill University, 3600 rue University, Montréal, QC H3A 2T8, Canada
7
Department of Physics and Astronomy, University of California, Riverside, CA 92521, USA
8
Department of Astronomy and Astrophysics, University of Toronto, 50 St. George Street, Toronto, ON M5S 3H4, Canada
9
Department of Physics, University of California Berkeley, 366 LeConte Hall, MC 7300, Berkeley, CA 94720-7300, USA
10
Department of Physics and Astronomy, University of California, Irvine, 4129 Frederick Reines Hall, Irvine, CA 92697, USA
11Departamento de Astronomía, Universidad de Concepción, Casilla 160-C, Concepción, Región del Biobío, Chile 12
Physics Division, Lawrence Berkeley National Laboratory, 1 Cyclotron Road, Berkeley, CA 94720, USA
13
Australian Astronomical Observatory, 105 Delhi Road, North Ryde, NSW 2113, Australia
Received 2017 May 8; revised 2017 June 5; accepted 2017 June 6; published 2017 June 21
Abstract
We present ALMA CO(2–1)detections in 11 gas-rich cluster galaxies atz∼1.6, constituting the largest sample of molecular gas measurements inz>1.5 clusters to date. The observations span three galaxy clusters, derived from theSpitzerAdaptation of the Red-sequence Cluster Survey. We augment the>5σdetections of the CO(2–1)
fluxes with multi-band photometry, yielding stellar masses and infrared-derived star formation rates, to place some of the first constraints on molecular gas properties in z∼1.6 cluster environments. We measure sizable gas reservoirs of 0.5–2×10¹¹M☉in these objects, with high gas fractions(fgas)and long depletion timescales(τ),
averaging 62% and 1.4 Gyr, respectively. We compare our cluster galaxies to the scaling relations of the coeval
field, in the context of how gas fractions and depletion timescales vary with respect to the star-forming main sequence. We find that our cluster galaxies lie systematically off thefield scaling relations at z=1.6 toward enhanced gas fractions, at a level of∼4σ, but have consistent depletion timescales. Exploiting CO detections in lower-redshift clusters from the literature, we investigate the evolution of the gas fraction in cluster galaxies,
finding it to mimic the strong rise with redshift in thefield. We emphasize the utility of detecting abundant gas-rich galaxies in high-redshift clusters, deeming them as crucial laboratories for future statistical studies.
Key words:galaxies: clusters: general– galaxies: evolution– galaxies: high-redshift– galaxies: ISM– galaxies: star formation–infrared: galaxies
1. Introduction
Galaxy cluster evolution is intertwined with that of its constituent galaxies. Therefore, in order to understand the former, we must explore the baryonic processes that shape the latter. In particular, this requires a solid understanding of the molecular gas content in cluster galaxies, as this provides the necessary raw material to fuel star formation. Within these dense environments, cluster galaxies face hostile conditions, as substantiated by morphological and physical transformations. Various mechanisms have been invoked to explain the differences between cluster andfield galaxies, many of which involve interactions with the intracluster medium (ICM). For example, ram-pressure stripping has been directly observed in low-redshift (z0.3) cluster galaxies via HI deficiencies (Jaffé et al.2015), extraplanar HIgas(Chung et al.2009), and long “jellyfish”gas tails(Owers et al.2012).
The environmental effect of the ICM on molecular gas, however, is more ambiguous. It is thought that this denser gas is less susceptible to removal and can therefore survive the effects of ram-pressure stripping. Indeed, many studies have found no difference in the molecular gas content betweenfield
and cluster environments, as traced by the emission lines of
12CO (e.g., Stark et al. 1986; Kenney & Young 1989).
However, more recent work has reported molecular gas deficiencies in cluster galaxies (e.g., Fumagalli et al. 2009; Jablonka et al.2013; Scott et al. 2013; Boselli et al.2014).
Technological advances in radio interferometers have enabled statistical samples of CO in the field out to z∼3 (e.g., Saintonge et al.2011; Tacconi et al.2013,2017). Cluster samples, however, have primarily focused on low-redshift systems. A missing key component of molecular gas studies are observations within high-redshift cluster cores.
Observations(Tran et al.2010; Brodwin et al.2013)suggest thatz1.5 is the peak assembly time for galaxy clusters, and it is thus likely that many of the environmental effects on cluster galaxies occur at these early times in dense regions. While there have been some molecular gas observations in the dense regions ofz>1 clusters, these have been limited to only a handful of detections(Aravena et al.2012; Wagg et al.2012; Casasola et al.2013; Hayashi et al.2017; Rudnick et al.2017). Thus, whether high-redshift clusters typically harbor gas-rich galaxies, or whether they are analogous to some of their The Astrophysical Journal Letters,842:L21(6pp), 2017 June 20 https://doi.org/10.3847/2041-8213/aa77f3
lower-redshift counterparts, displaying signs of molecular gas deficiencies has yet to be determined conclusively.
Here, we present Cycle 3 ALMA observations of three massive galaxy clusters atz∼1.6 from the Spitzer Adaptation of the Red-Sequence Cluster Survey(SpARCS). With a total of 11 CO (2–1) detections at >5σ, we are filling in this CO redshift desert and enabling the first statistical constraints on gas properties in high-redshift cluster galaxies. Stellar masses and star formation rates(SFRs)are based on a Chabrier initial mass function(Chabrier2003).
2. Observations and Analysis
2.1. z∼1.6 SpARCS Clusters
SpARCS J022426−032330 (J0224), J033057−284300 (J0330), and J022546-035517(J0225)were discovered within the 42 deg2 SpARCS fields (Muzzin et al. 2009; Wilson et al. 2009; Demarco et al. 2010; see Table 1 in Nantais et al. 2016). They were initially identified using a technique that detects the 1.6μm stellar bump feature as it spans 3.6 and 4.5μm from 1.3<z<1.8 (Papovich et al. 2010; Muzzin et al. 2013). These three clusters are spectroscopically confirmed at z=1.633, z=1.626, and z=1.59 (Lidman et al. 2012; Muzzin et al. 2013; Nantais et al. 2016), respectively, with 115 confirmed members in total. Richness-based estimates suggest cluster masses 1014 M☉, placing them among the most massive systems at z∼1.6 (e.g., Stanford et al. 2012; Bayliss et al. 2014; Tozzi et al. 2015; Webb et al. 2015).
Additional 11-band imaging exists from optical/near-infrared (ugrizYKs)to infrared(3.6/4.5/5.8/8.0μm), allowing for accurate photometric redshifts and stellar masses. Imaging details and analysis are presented in Nantais et al.(2016). The central cluster regions have deepHSTimaging from the“See Change”program (GO-13677 and GO-14327)in F160W on the WFC3-IR camera,
with additional observations in the F105W and F140Wfilters for J0224 and J0330.
2.2. ALMA Observations
The ALMA Cycle 3 data were taken between 2016 January 13 and January 20 over 12 execution blocks, with 8.4 hr of total integration time. Each cluster contains two separate pointings in Band 3, encompassing a total of 49 spectroscopically confirmed cluster members. We used the frequency division correlator mode in a single baseband to provide a total bandwidth of 1.875 GHz.
The maps were calibrated using ALMA reduction pipeline scripts in CASA version 4.6.0. We chose 0 3 pixels and a spectral resolution of 100 km s−1. We performed minimal cleaning with natural weighting, generating continuum-subtracted and primary-beam-corrected maps with afield of view of∼110″ across. The resulting data cubes have synthesized beams of
∼4″×3″with a central rms of∼0.17 mJy beam−1per channel.
2.3. CO (2–1)Detections
We blindly search the primary-beam-corrected image cubes for CO (2–1) detections, requiring a peak S/N5, and resulting in a final catalog of 11 CO detections over all 3 clusters. High-resolution HST imaging, in conjunction with optical spectroscopy and 11-band photometry, allows for unambiguous counterpart identification of the ALMA detec-tions (Figure 1). Seven of the 11 CO detections represent individual cluster members, and the remaining 4 detections are associated with galaxy pairs. The “pair” systems (J0224
−3680/3624 and J0224−396/424) are slightly blended in ALMA(and completely blended in the far-infrared imaging). We therefore treat all the pair detections as single combined systems, measuring total gas masses, stellar masses, and SFRs for each pair. This yields nine separateflux measurements.
To measure CO fluxes, we first create integrated-intensity maps by collapsing the image cube over the velocity channels with significant emission for each source. We then perform a two-dimensional Gaussian fit on their respective map and use the best-fit major and minor FWHM to create a 4σ region for spectral profile extraction on the full image cube. Within each of these regions, we model the spectral profile with a Gaussian function, determining rms errors from the line-free channels for each source.
The area under the Gaussian spectral profile corresponds to the full integrated CO flux. These fluxes are subsequently converted into line luminosities (LCO¢ ) using Equation (3) in Solomon & Vanden Bout (2005). To estimate the total molecular gas mass we use Mgas=aCO(L( – )¢2 1 r21). We
assume sub-thermalized emission with r21=0.77, which is
empirically derived in Daddi et al.(2015)and consistent with the value used in Genzel et al. (2015), and a αCOconversion
factor of 4.36(M☉(K km s−1pc−2)−1), commonly used for the Milky Way and in normal star-forming galaxies with solar metallicities(Bolatto et al.2013; Genzel et al.2015). We note that all but one of the cluster galaxies lie within 2σof the main sequence of star formation atz=1.6. Table1displays ourfinal CO (2–1) measurements, along with corresponding derived quantities.
2.4. Infrared Star Formation Rates
To obtain SFRs, we utilize infrared/far-infrared data from
Spitzerand Herschel. All three clusters are within the SWIRE Legacy Survey (Lonsdale et al. 2003) and the Herschel Mid-infrared Extragalactic Survey (Oliver et al. 2012), providing MIPS-24μm and SPIRE-250/350/500μm imaging. MIPS counterparts to the ALMA detections are identified directly on the images, andfluxes are measured with aperture photometry. Measurement of SPIRE fluxes is less straightforward due to source confusion in the maps. We attempt to reduce the blending of SPIREfluxes by using MIPS positional priors and employing a simultaneous stacking technique (SIMSTACK; Viero et al. 2013).
As in Webb et al.(2015), we use a Bayesian approach tofit spectral energy distributions to the infrared fluxes. We first
form a two-dimensional parameter space consisting of 105 templates from Chary & Elbaz (2001), each scaled by 104 amplitudes, ranging from 0 to 100. For each template and amplitude combination, we compute the c2 value from the
observed infrared fluxes, creating a two-dimensional prob-ability distribution. Assumingflat priors on both the amplitude and template, we calculate the weighted mean over the posterior to determine the infrared luminosity and its uncertainty. This is converted to a SFR using Kennicutt (1998). The infrared-derived SFRs place the cluster galaxies around the main sequence at z=1.6 from Whitaker et al. (2012). All but one galaxy(J0224−3656)fall within 2σof the main sequence.
3. Results
With thefirst significant sample of CO detections in cluster galaxies atz∼1.6, we can begin to investigate how the cluster environment might impact the molecular gas reservoirs. We present our main results below.
3.1. Gas Properties Scaled to the Star-forming Main Sequence
The tightness of the main sequence of star formation(SFR–Må)
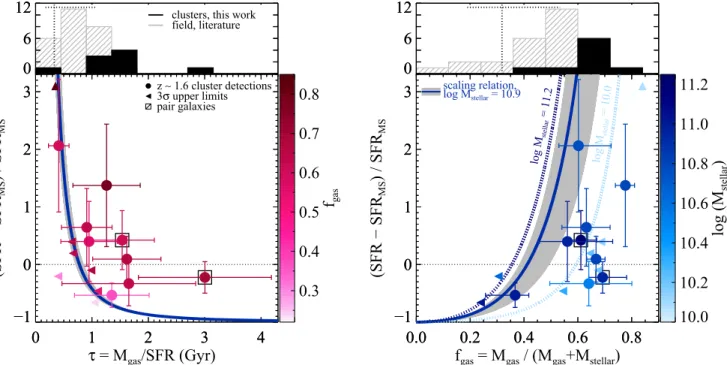
is thought to reflect the gas regulator model, in which galaxies grow through an influx of fresh gas that fuels star formation and is subsequently balanced by feedback (Bouché et al. 2010). The dependence of gas properties on the galaxy’s location on the SFR–Måplane is therefore expected and has been observed in thefield(e.g., Saintonge et al.2011,2016; Genzel et al.2015). We investigate the spread of depletion timescales and gas fractions as a function of relative offset from the main sequence in Figure2. We show the field scaling relations from Genzel et al. (2015), calculated at z=1.6 and normalized to the average stellar mass in our cluster sample. The gas fraction scaling relation has a steep dependence on stellar mass; we therefore also include tracks using the mass range of the cluster sample. From these scaling relations, it is evident that field galaxies further above the main sequence display higher gas fractions and shorter depletion timescales.
For a given mass, the z∼1.6 cluster galaxies lie at systematically higher gas fractions than the scaling relation
Table 1
Properties of the CO-detected Cluster Galaxies
ID zCO S/Na SCOΔvb FWHMb Mgasc Mstellar áSFRñ fgas τ
(Jy km s−1) (km s−1) (1010M
☉) (1010M☉) (M☉yr−1) (Gyr)
J0225−371 1.599 6.3 1.18±0.18 401±71 21.9±3.4 6.3-+0.90.8 174±78 0.78-+0.040.03 1.3±0.6
J0225−460 1.601 5.8 0.63±0.11 509±104 11.7±2.1 9.1-+3.56.0 123±61 0.56-+0.100.17 0.9±0.5
J0225−281 1.610 6.2 0.59±0.16 122±34 11.1±3.1 6.5-+1.81.7 122±50 0.63-+0.090.09 0.9±0.4
J0225−541 1.611 14.0 0.70±0.06 307±31 13.3±1.2 6.6-+0.90.8 82±30 0.67-+0.030.03 1.6±0.6
J0330−57 1.613 5.2 0.31±0.13 155±40 5.9±2.5 3.3-+1.51.8 36±21 0.64-+0.140.16 1.7±1.2
J0224−3656 1.626 6.8 0.30±0.06 539±113 5.8±1.1 10.0-+4.41.2 43±20 0.37-+0.110.05 1.4±0.7
J0224−159 1.635 5.2 0.46±0.11 245±68 8.9±2.1 5.9-+1.12.6 217±82 0.60-+0.070.12 0.4±0.2
J0224−3680/3624d,e 1.626 7.0 1.07±0.19 776±192 20.5±3.6 9.1-+1.53.5 68±24 0.69-+0.050.09 3.0±1.2
J0224−396/424d 1.634 9.9 1.32±0.12 493±53 25.5±2.4 16.2-+2.43.7 166±60 0.61-+0.040.06 1.5±0.6
Notes.
a
Computed from the peakflux and noise in the collapsed image cube.
b
Computed from a Gaussianfit to the spectral profile.
c
Calculated usingr21=0.77,αCO=4.36. d
Pair galaxies, where the CO luminosity and SFR have been measured for the combined system.
e
Spectral profile isfit with a double Gaussian.
(of the appropriate mass). The same is true of depletion timescales, though most are within a one standard deviation of the relation. We quantify this offset by summing the individual
χ2 values from each data point compared to model track
scaling relation at the cluster galaxy’s given stellar mass. This returns a 8×10⁻⁷(0.3) likelihood of producing a similar or worse χ2, roughly corresponding to a ∼5σ (1σ)offset in gas fractions (depletion timescales) compared to the field scaling relations.
We explore whether this could be due to a selection effect by including 3σ upper limits for spectroscopically confirmed infrared-detected cluster members above the scaling relation mass limit of 1010M☉. For each of these seven non-detections, we create a 400 km s−1(the average FWHM of the detected sample)integrated-intensity map centered at the spectroscopic redshift. The pixel-to-pixel variation in an annulus around the source corresponds to the 1σ rms. We then estimate the 3σ upper limit on the gas fraction and depletion timescale using the galaxy’s stellar mass and SFR. Most of the non-detections lie close to the scaling relations, albeit fewer than the number of CO-detected galaxies lying above. Therefore, while we cannot rule out the existence of a cluster population consistent with thefield, there is still a higher fraction of cluster galaxies offset from the relation given the uncertainty in the scaling relation fit. We can thus reasonably rule out that the offset is purely a selection effect. Moreover, if we include the upper limits in the χ2 calculation by conservatively assuming the non-detections lie on the scaling relations, the offset signifi -cance for the gas fraction only drops to∼4σ. We note that there is likely some selection bias in the field samples, further muddling interpretation.
We compare the distribution of gas properties to coevalfield galaxies from 1.2<z<1.6 (Daddi et al. 2010; Tacconi et al. 2013; Decarli et al. 2016; Papovich et al. 2016) in the upper panel histograms. We restrict thefield sample to galaxies within a similar range of offsets from the main sequence as the cluster CO-detected sample, from−1 to 2. We note the cluster and field comparison samples are evenly distributed on the SFR–Må plane. The tendency toward higher gas fractions in cluster galaxies is again conspicuous. To evaluate the differences, we restrict the analogous field sample to values offgasandτabove our nominal 3σdetection limit in the cluster
sample. This is estimated using the typical rms in the center of the ALMA maps and the average FWHM, stellar mass, and SFR of our detected sample, yielding a gas fraction and depletion timescale limit of 32% and 0.33 Gyr. Comparing the two distributions above our nominal detection limits, we perform a Kolmogorov–Smirnov test, rejecting the null hypotheses in both cases with 99% confidence. We find an average gas fraction of 62±3.7% and average depletion timescale of 1.4±0.2 Gyr for our CO-detected cluster galaxies.
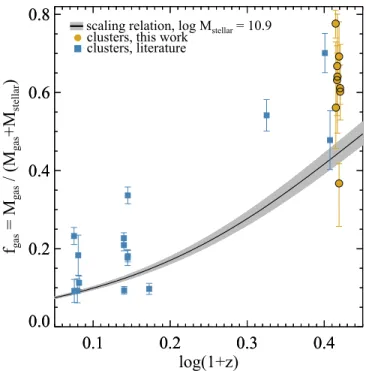
3.2. Evolution of the Gas Fraction in Clusters
In Figure 3, we plot the evolution of the gas fraction. We compile a subset of 19 additional CO detections in clusters from the literature from 0.2<z<1.5 (Geach et al. 2011; Aravena et al. 2012; Wagg et al. 2012; Jablonka et al. 2013; Cybulski et al.2016)to compare to ourz∼1.6 detections. We similarly restrict the literature detections to >1010M☉galaxies that fall within a relative offset from−1 to 2 of the main sequence at their respective redshift, yielding 15 cluster galaxies. Including galaxies markedly above the main sequence, for example, would
Figure 2.Relative offset from the star-forming main sequence as a function of molecular gas depletion timescale(left)and gas fraction(right). Thez∼1.6 cluster galaxies(circles)are color-coded by the gas fraction(left)and stellar mass(right). Left-facing triangles correspond to 3σupper limits for spectroscopically confirmed star-forming cluster members that are not detected in CO(color-coded by their 3σupper limit infgason the left). The upward-facing triangle also represents a CO
inherently bias the literature detections to higher gas fractions given the aforementioned correlation in Section3.1. We include the rise in the gas fraction for main-sequencefield galaxies from the Genzel et al. (2015) scaling relations, normalized to the average mass of our cluster galaxies. The gas fraction in cluster galaxies mimics the strong evolution in the field. Notably, almost all thez>1 cluster galaxies lie above the gas fractions in main-sequence field galaxies, despite half the galaxies lying slightly below the main sequence. Conversely, gas-rich galaxies in low-redshift clusters are on average closer to the field gas fractions. This is suggestive of a steeper evolution in gas fractions for cluster galaxies than thefield, consistent with semi-analytical (Lagos et al. 2011) and semi-empirical (Popping et al. 2015) models that predict a stronger evolution in more massive halos. However, this warrants caution owing to the heterogeneous nature of the cluster and field samples, making interpretation difficult. For example, this could be dominated by systematic offsets in SFR measurements and/or selection biases.
4. Discussion
Wefind that star-forming main-sequence cluster galaxies are systematically concentrated toward higher gas fractions compared to thefield scaling relations atz∼1.6.
This could partially be a selection effect—we cannot fully exclude the possibility that with deeper data we would detect more galaxies on or below the scaling relations. However, it is unlikely the sole cause of the offset as more of our confirmed cluster members have CO detections as opposed to non-detections consistent with the scaling relations. Barring a selection effect, we propose three other plausible explanations for the offset in gas properties of cluster galaxies relative to thefield.
One possibility could be that for a given gas fraction, SFRs inz∼1.6 cluster galaxies are suppressed. While the SFRs in CO-detected cluster galaxies range within ∼2σ of the main sequence, one might expect even higher levels of star formation given the massive gas reservoirs. Though it seems unlikely that star formation would begin to cease before the depletion of molecular gas(Bahé & McCarthy2015), this could be due to the varying timescales of the measurements (Feldmann et al.2016).
Conversely, taken at face value, this offset implies that star-forming main-sequence galaxies in cluster environments have higher gas masses than thefield. This could be suggestive of an environmental interaction that perturbs the molecular gas in cluster galaxies such that a smaller fraction of the gas actively contributes to star formation; this would require higher gas masses in cluster galaxies compared tofield galaxies with the same SFR. Similarly, environmental pressure could increase the formation of molecular gas through compression of the interstellar medium that further prevents gaseous outflows (Fujita & Nagashima1999; Bahé et al. 2012), yielding higher gas masses thanfield galaxies for a given stellar mass. Indeed, simulationsfind an increased effectiveness of ram pressure at
z∼1 compared toz=0(Bahé & McCarthy2015). Moreover, Virgo cluster galaxies have also been found to have an excess of molecular gas despite being deficient in HI (Mok et al. 2016), though this is in contrast to many other studies that report a reduction of molecular gas (e.g., Boselli et al. 2014). Large gas reservoirs in z>1.5 clusters are also consistent with the increased star formation observed in dense regions at this epoch(e.g., Tran et al.2010).
Finally, the sameαCOmay not be appropriate forfield and
cluster galaxies alike. We note that reducing the αCO
conversion by 2×for the cluster galaxies would remove the offset between the sample and thefield scaling relations. This term is dependent on various factors, most notably metallicity and total mass surface density (Bolatto et al. 2013), both of which could be affected by the larger-scale environment. Indeed, the value of αCO slightly decreases for increasing
metallicity(Narayanan et al.2012). Although galaxies in high-density environments have marginally higher metallicities (Cooper et al. 2008), a factor of ∼2 increase in metallicity would be needed to reduceαCOin our cluster galaxies in order
to align them withfield gas fractions. A lower value ofαCOis
also preferred for mergers(αCO∼1), due to a combination of
increased gas temperatures and velocity dispersions that give rise to an amplified CO luminosity (Narayanan et al. 2012). While we do see examples of pair galaxies in our cluster sample, recent work by Delahaye et al.(2017)finds no direct evidence for increased merger activity inz∼1.6 cluster cores compared to thefield. In addition to mergers, a similar effect could also result from ram-pressure stripping, where com-pressed gas at the leading edge of the galaxy would lead to higher gas temperatures and velocity dispersions, necessitating a lower conversion between CO and H2. If cluster galaxies
indeed warrant a differentαCOthis in itself is interesting as it
implies that environmental studies of molecular gas need to be more cognizant of systematicαCOvariations.
5. Conclusion
We present the largest study of molecular gas in z>1.5 cluster galaxies to date. Using ALMA Band 3, we detect CO
Figure 3.Evolution of the gas fraction for main-sequence cluster galaxies, compared to the field scaling relation (black line and gray region; Genzel et al.2015). The lower-redshift cluster data are taken from the literature and limited to a narrow range around the main sequence at their respective redshifts. On average,z>1 main-sequence cluster galaxies have higher gas fractions than the coevalfield.
(2–1)in 11 galaxies over 3 massive SpARCS galaxy clusters. We summarize our results as follows:
1. The z∼1.6 cluster galaxies have consistent depletion timescales (t¯ =1.40.2 Gyr), but ∼4σ higher gas fractions (f¯gas =623.7%)for a given offset from the main sequence compared to the scaling relations of coevalfield galaxies.
2. Cluster galaxies on or around the main sequence mimic the strong evolution in the gas fraction in the field, with the trend continuing in clusters up toz∼1.6.
The origin of the gas fraction excess is not clear—whether it is a selection effect or stems from a cluster environmental dependency remains an open question. Larger samples of high-redshift CO detections in cluster galaxies are required, preferentially probing a broad scope in the SFR–Må plane and over a wide range of cluster halos to mitigate stochastic cluster-to-cluster variations. Nevertheless, with these data, it is clear that high-redshift galaxy clusters have an ample supply of gas-rich galaxies. Given the efficiency of targeting high-density
fields to obtain multiple detections within a singlefield of view, clusters offer an exciting laboratory to further explore molecular gas properties.
We thank the referee for providing feedback that improved this Letter, and H. Russell for useful discussions. We acknowledge support from the following sources: NSF grants AST-1517815/ AST-1211358/AST-1517863/AST-1518257; NASA programs AR-14310.001/GO-12945.001-A/GO-13306/GO-13677/ GO-13747; Universidad Andres Bello grant DI-18-17/RG; FON-DECYT 1130528; BASAL CATA; ISSI.
This Letter makes use of the following ALMA data: ADS/JAO. ALMA#2015.1.01151.S. ALMA is a partnership of ESO (representing its member states), NSF (USA)and NINS(Japan), together with NRC (Canada) and NSC and ASIAA (Taiwan) and KASI(Republic of Korea), in cooperation with the Republic of Chile. The Joint ALMA Observatory is operated by ESO, AUI/NRAO and NAOJ. The NRAO is a facility of the NSF operated under cooperative agreement by Associated Universities, Inc. Based on observations made with the NASA/ESA HST
(GO-13677/GO-14327), obtained at the STSI, which is operated by the AURA, Inc., NASA contract NAS 5-26555.
References
Aravena, M., Carilli, C. L., Salvato, M., et al. 2012,MNRAS,426, 258
Bahé, Y. M., & McCarthy, I. G. 2015,MNRAS,447, 969
Bahé, Y. M., McCarthy, I. G., Crain, R. A., & Theuns, T. 2012, MNRAS,
424, 1179
Bayliss, M. B., Ashby, M. L. N., Ruel, J., et al. 2014,ApJ,794, 12
Bolatto, A. D., Wolfire, M., & Leroy, A. K. 2013,ARA&A,51, 207
Boselli, A., Cortese, L., Boquien, M., et al. 2014,A&A,564, A67
Bouché, N., Dekel, A., Genzel, R., et al. 2010,ApJ,718, 1001
Brodwin, M., Stanford, S. A., Gonzalez, A. H., et al. 2013,ApJ,779, 138
Casasola, V., Magrini, L., Combes, F., et al. 2013,A&A,558, A60
Chabrier, G. 2003,PASP,115, 763
Chary, R., & Elbaz, D. 2001,ApJ,556, 562
Chung, A., van Gorkom, J. H., Kenney, J. D. P., Crowl, H., & Vollmer, B. 2009,AJ,138, 1741
Cooper, M. C., Tremonti, C. A., Newman, J. A., & Zabludoff, A. I. 2008,
MNRAS,390, 245
Cybulski, R., Yun, M. S., Erickson, N., et al. 2016,MNRAS,459, 3287
Daddi, E., Bournaud, F., Walter, F., et al. 2010,ApJ,713, 686
Daddi, E., Bournaud, F., Walter, F., et al. 2015,A&A,577, A46
Decarli, R., Walter, F., Aravena, M., et al. 2016,ApJ,833, 70
Delahaye, A. G., Webb, T. M. A., Nantais, J., et al. 2017, ApJ, in press
(arXiv:1705.10849)
Demarco, R., Wilson, G., Muzzin, A., et al. 2010,ApJ,711, 1185
Feldmann, R., Quataert, E., Hopkins, P. F., Faucher-Giguère, C.-A., & Kereš, D. 2016, MNRAS, in press(arXiv:1610.02411)
Fujita, Y., & Nagashima, M. 1999,ApJ,516, 619
Fumagalli, M., Krumholz, M. R., Prochaska, J. X., Gavazzi, G., & Boselli, A. 2009,ApJ,697, 1811
Geach, J. E., Smail, I., Moran, S. M., et al. 2011,ApJL,730, L19
Genzel, R., Tacconi, L. J., Lutz, D., et al. 2015,ApJ,800, 20
Hayashi, M., et al. 2017,ApJL,841, L21
Jablonka, P., Combes, F., Rines, K., Finn, R., & Welch, T. 2013, A&A,
557, A103
Jaffé, Y. L., Smith, R., Candlish, G. N., et al. 2015,MNRAS,448, 1715
Kenney, J. D. P., & Young, J. S. 1989,ApJ,344, 171
Kennicutt, R. C., Jr. 1998,ARA&A,36, 189
Lagos, C. D. P., Lacey, C. G., Baugh, C. M., Bower, R. G., & Benson, A. J.
2011,MNRAS,416, 1566
Lidman, C., Suherli, J., Muzzin, A., et al. 2012,MNRAS,427, 550
Lonsdale, C. J., Smith, H. E., Rowan-Robinson, M., et al. 2003, PASP,
115, 897
Mok, A., Wilson, C. D., Golding, J., et al. 2016,MNRAS,456, 4384
Muzzin, A., Wilson, G., Demarco, R., et al. 2013,ApJ,767, 39
Muzzin, A., Wilson, G., Yee, H. K. C., et al. 2009,ApJ,698, 1934
Nantais, J. B., van der Burg, R. F. J., Lidman, C., et al. 2016,A&A,592, A161
Narayanan, D., Krumholz, M. R., Ostriker, E. C., & Hernquist, L. 2012,
MNRAS,421, 3127
Oliver, S. J., Bock, J., Altieri, B., et al. 2012,MNRAS,424, 1614
Owers, M. S., Couch, W. J., Nulsen, P. E. J., & Randall, S. W. 2012,ApJL,
750, L23
Papovich, C., Momcheva, I., Willmer, C. N. A., et al. 2010,ApJ,716, 1503
Papovich, C., Labbé, I., Glazebrook, K., et al. 2016,NatAs,1, 0003
Popping, G., Behroozi, P. S., & Peeples, M. S. 2015,MNRAS,449, 477
Rudnick, G., Hodge, J., Walter, F., et al. 2017, ApJ, submitted Saintonge, A., Kauffmann, G., Wang, J., et al. 2011,MNRAS,415, 61
Saintonge, A., Kauffmann, G., Wang, J., et al. 2016,MNRAS,462, 1749
Scott, T. C., Usero, A., Brinks, E., et al. 2013,MNRAS,429, 221
Solomon, P. M., & Vanden Bout, P. A. 2005,ARA&A,43, 677
Stanford, S. A., Brodwin, M., Gonzalez, A. H., et al. 2012,ApJ,753, 164
Stark, A. A., Knapp, G. R., Bally, J., et al. 1986,ApJ,310, 660
Tacconi, L. J., Neri, R., Genzel, R., et al. 2013,ApJ,768, 74
Tacconi, L. J., Genzel, R., Saintonge, A., et al. 2017, ApJ, submitted
(arXiv:1702.01140)
Tozzi, P., Santos, J. S., Jee, M. J., et al. 2015,ApJ,799, 93
Tran, K.-V. H., Papovich, C., Saintonge, A., et al. 2010,ApJL,719, L126
Viero, M. P., Moncelsi, L., Quadri, R. F., et al. 2013,ApJ,779, 32
Wagg, J., Pope, A., Alberts, S., et al. 2012,ApJ,752, 91
Webb, T., Noble, A., DeGroot, A., et al. 2015,ApJ,809, 173
Whitaker, K. E., van Dokkum, P. G., Brammer, G., & Franx, M. 2012,ApJL,
754, L29