Diversity, threat, and conservation of reptiles from continental Ecuador
8
0
0
Texto completo
(2) Reyes-Puig et al. cies with fewer than four localities (n = 76), a 1 km2 buffer was constructed around their presence data points.. Materials and Methods Data collection. Conservation priority areas. We obtained locality data points for 406 species of reptiles from three local museum databases—Museo de Zoología at Pontificia Universidad Católica del Ecuador (QCAZ), Museo Ecuatoriano de Ciencias Naturales (MECN), Museo de Historia Natural Gustavo Orcés at Escuela Politécnica Nacional (EPN)—, HerpNET, Global Biodiversity Information Facility (GBIF), as well as from the literature. We validated each data point in ArcMap v. 10.2 (ESRI 2013) and removed taxonomically incongruent records (e.g., localities along the Pacific coast for species known to occur exclusively east of the Andes). Duplicate points (for the same species), as well as points <2 km close to each other were also removed to avoid oversampling bias in the analyses.. To identify priority areas for the conservation of reptiles we employed the Toolbox developed by Ríos-Franco et al. (2013) for ArcMap. This method integrates three criteria—threat, importance, and opportunity. We used it to identify regions outside the National Protected Areas System (PANE for its initials in Spanish) with maximum threat and importance values that show opportunity to be considered as priority areas for the conservation of reptiles in continental Ecuador. According to the threat criterion, those areas with human activities which are the most vulnerable we generated a raster file with values from 0 (non-threatened zones) to 1 (highly threatened zones) based on the results of a short survey to reptile experts that included questions on risks, distances and intensity of threats, such as roads, oil fields, mines, and human settlements (Appendix). Areas that are easy to access pose a major threat to species because they represent great opportunities for humans to exploit natural resources (Sanderson et al. 2002). For this reason, we also created a file with geographic information on human settlements, roads, navigable rivers and terrain slope. The toolbox calculates the access probability from each of these elements assuming that a single person walks at a maximum speed of three km/h on a flat terrain without road access (Ríos-Franco et al. 2013). The importance criterion prioritizes areas based on richness, endemism, and threatened species and ecosystems. We generated richness, endemism, and threat maps by overlapping the distributions of (i) all species of reptiles included in this study (see Species distribution maps above), (ii) endemic species, and (iii) threatened species. Details on the threat status of the reptiles from Ecuador will be published elsewhere. To identify threatened ecosystems, we generated a raster file with values between 0 and 1, where values close to 1 correspond to natural ecosystems that are well represented within the PANE, and values close to 0 correspond to the opposite (i.e., threatened ecosystems). The importance criterion was summarized in a raster file with values of 0–1, where values close to 1 represent areas with high levels of species richness, endemism, threatened species, and threatened ecosystems. The opportunity criterion identifies areas with potential to be established as areas of conservation priority. Since 2008 the Ecuadorian government established the “Socio Bosque” program (SBP) to pay farmers and indigenous communities that voluntarily protect their native forests. We overlapped the threat and importance raster files with an “opportunity” file containing SBP areas, as well as private reserves and remnant vegetation.. Species distribution maps We used Maxent, a technique based on the principle of maximum entropy, to construct species distribution models (SDMs) for those species (n = 287) with ≥ 10 locality data points (Elith et al. 2011; Phillips et al. 2006; Renner and Warton 2013). As predictor variables, we used species presence data (i.e., geographical coordinates) and bioclimatic variables from Worldclim 1.4 (http://www. worldclim.org), which are based on temperature and precipitation data at ~1 km2 spatial resolution (Hijmans et al. 2005). After removing highly correlated (r > 0.8) variables, selected explanatory variables were Temperature Seasonality, Annual Precipitation, Precipitation Seasonality, and Minimum Temperature of Coldest Month. Additionally, we included the ombrothermic index, ombrothermic index of the driest bimonth, and the terrain ruggedness index, which have been used in previous studies of distributional patterns in the Andes (Killeen et al. 2007; Tovar et al. 2013). To construct the models, we set the convergence threshold to 0.00001, maximum iterations to 1,000, and the regularization parameter to 1. SDMs with AUC (Area Under Curve) values below 0.7 were discarded (Elith and Leathwick 2007). SDMs for those species with 5–9 locality data points were constructed in Bioclim (Busby 1991; type output: true/ false). After removing highly correlated (r > 0.8) variables, selected explanatory variables were Annual Mean Temperature, Mean Diurnal Range, Temperature Seasonality, Maximum Temperature of Warmest Month, Minimum Temperature of Coldest Month, Annual Precipitation, Precipitation of Warmest Quarter, and Precipitation of Coldest Quarter. The distribution of species with four localities (n = 43) and species with rejected SDMs (i.e., AUC < 0.7) was delimited with minimum convex polygons. For spe-. Amphib. Reptile Conserv.. 52. December 2017 | Volume 11 | Number 2 | e147.
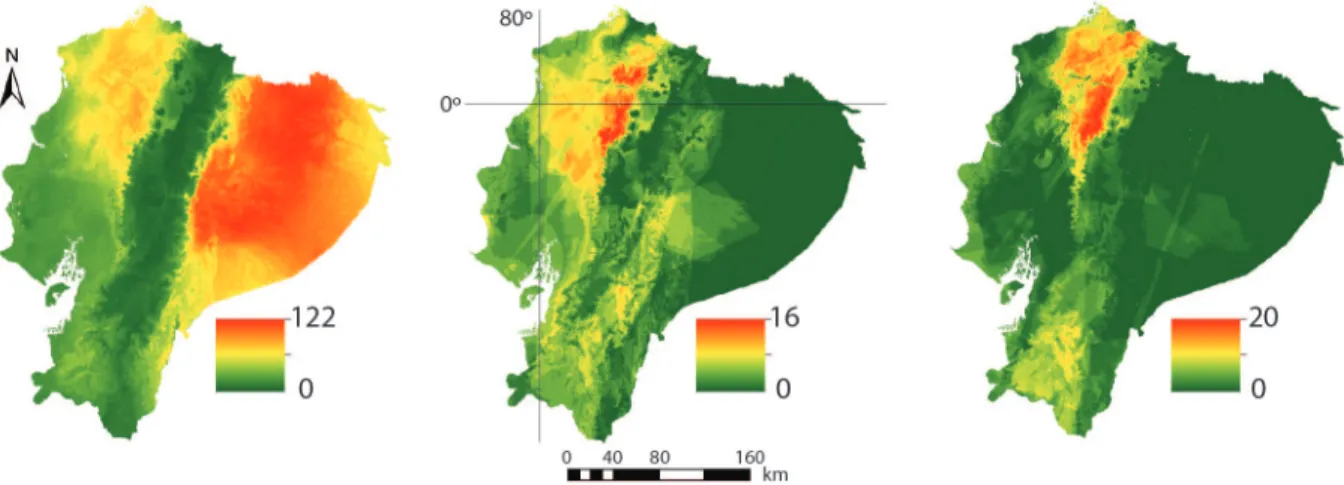
(3) Diversity, threat, and conservation of reptiles from Ecuador. Figure 1. Maps of richness (left), endemism (center), and threat (right) for species of reptiles from continental Ecuador. Gradient values correspond to number of species.. threaten reptiles are widespread mostly along the Andes and adjacent lowlands, with a slightly higher concentration in southern Ecuador (Fig. 2). The areas selected by the importance criterion based on species richness, endemism, and threat are described above; regarding threatened ecosystems, a large part of the Pacific lowlands, as well as Andean slopes in southern Ecuador are the least represented by the PANE. The central and southern Amazon include the areas with the greatest potential to be established as areas of conservation priority, most of them represented by SBP forests (Fig. 2). Conservation priority areas were selected based on three of 12 possible solutions (Table 1). Accordingly, four areas were identified as the most important for the conservation of reptiles in continental Ecuador (Fig. 3): (1) the northwestern slopes of the Andes in Pichincha and Santo Domingo de los Tsáchilas provinces that include the Mindo-Nambillo Protected Forest, remnant Toachi-Pilatón vegetation, and SBP forest; (2) a centralsouth Amazonian area mostly in Morona Santiago province that includes remnant vegetation within the Kutuku. Results Species richness, endemism and threat Two regions in continental Ecuador have the highest numbers of species of reptiles. The most diverse region includes the central and northern Amazonian territories; however, northwestern Ecuador—Chocó and adjacent Andean slopes—is highly diverse as well (Fig. 1). Endemism is mostly concentrated in northwestern Ecuador, with large numbers of endemic species also present both on western and eastern Andean slopes. Similarly, the highest numbers of threatened species occur in northwestern Ecuador, followed by the Andes in southern Ecuador (Fig. 1).. Areas of conservation priority The Pacific lowlands are more accessible to humans than any other regions in continental Ecuador. In contrast, according to the threat criterion, human activities that. Figure 2. Maps of anthropogenic threat (left), importance (center), and opportunity (right), the three criteria used in this study to identify priority areas for the conservation of reptiles in continental Ecuador. SBP = Socio-Bosque protected forest, OPA = Other protected areas, PANE = National Protected Areas System. Amphib. Reptile Conserv.. 53. December 2017 | Volume 11 | Number 2 | e147.
(4) Reyes-Puig et al.. Figure 3. Map of priority areas for the conservation of reptiles in continental Ecuador.. and Shaimi cordilleras and SBP forest; (3) the southern Andean slopes and adjacent lowlands in Azuay and El Oro provinces that include the Molleturo and Mollepungo forests; and (4) the central Pacific coast in Manabí, Santa Elena and Guayas provinces that includes remnant vegetation in the Chongón-Colonche cordillera, as well as SBP areas.. Ecuador have been described or reported in this century. Of these, nearly 35% were discovered in southern Ecuador, which remains a largely undersampled area that has also been repeatedly identified as an area of conservation priority (this study; Cuesta et al. 2015b; Lessmann et al. 2014; Tapia-Armijos et al. 2015). Unlike other terrestrial vertebrates and plants (González-Palacios et al. 2015; Lessmann et al. 2014; Menéndez-Guerrero and Graham 2013), the conservation status and threats to reptiles from continental Ecuador remain poorly studied. For example, the IUCN Red List of Threatened Species (http://www.iucnredlist.org) lists ~25% of the species of reptiles from continental Ecuador (i.e., excluding the Galápagos islands), of which 17% are Data Deficient. Moreover, recent conservation-planning studies based on a variety of taxa do not include data on reptiles (Lessmann et al. 2016; Lessmann et al. 2014), with only two technical reports including up to 118 species of reptiles for the first time (Cuesta et al. 2015a; Cuesta et al. 2015b). Here we present the first comprehensive quantitative study of reptile conservation in continental Ecuador including distribution data of nearly 90% of the species of reptiles from continental Ecuador, as well as information on ecosystem protection. Discussion With three species per 2,000 km2, Ecuador is the most reptile-diverse country in the world if country area is accounted for. The highest diversity of reptiles is located in the central and northern Amazon, as well as the Ecuadorian Chocó and adjacent Andean slopes. This pattern of species richness is concordant with other animal and plant taxa, both at local (Lessmann et al. 2014) and continental scales (Bass et al. 2010; Jenkins et al. 2013; Myers et al. 2000), which highlights the biological importance of these areas. Nonetheless, this pattern should not be taken as definitive because a considerable percentage of Ecuador’s biodiversity has been discovered in recent years, and not necessarily from the most diverse regions. Nearly 10% of species of reptiles from Amphib. Reptile Conserv.. 54. December 2017 | Volume 11 | Number 2 | e147.
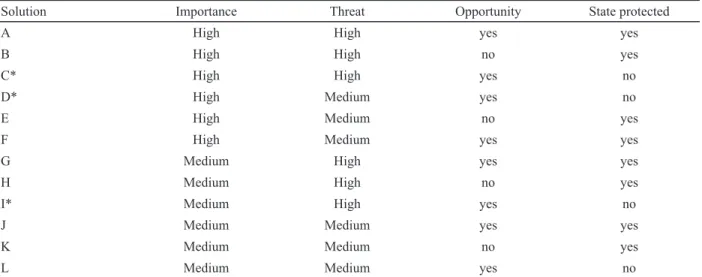
(5) Diversity, threat, and conservation of reptiles from Ecuador Table 1. Solutions to identify areas of conservation priority for reptiles from continental Ecuador. Selected solutions are marked with an asterisk. Solution. Importance. Threat. Opportunity. State protected. A. High. High. yes. yes. B. High. High. no. yes. C*. High. High. yes. no. D*. High. Medium. yes. no. E. High. Medium. no. yes. F. High. Medium. yes. yes. G. Medium. High. yes. yes. H. Medium. High. no. yes. I*. Medium. High. yes. no. J. Medium. Medium. yes. yes. K. Medium. Medium. no. yes. L. Medium. Medium. yes. no. status and anthropogenic activities that might affect reptile populations negatively. We identified parts of the northwestern slopes of the Andes, central-south Amazonian area, southwestern Andean slopes and adjacent lowlands, and the central Pacific coast as priority areas for the conservation of reptiles in continental Ecuador. These areas partially overlap with some of the Marxan-defined areas reported by Lessman et al. (2014) based on 809 species of amphibians, birds, mammals, and plants; and Cuesta et al. (2015) based on 753 species of amphibians, birds, reptiles (118 species), and plants. Thus, in addition to identifying those areas that are priorities for the conservation of reptiles, our study also supports the conservation of general areas that would benefit a larger number of animals and plants in continental Ecuador. Unfortunately, some of these areas are severely threatened. For example, Tapia-Armijos et al. (2015) reported that ~46% of southern Ecuador’s original forests had been converted into pastures and other anthropogenic land cover types by 2008. Similarly, deforestation and extinction in western Ecuador has long been documented (Dodson and Gentry 1991). In conclusion, our study provides further evidence demanding the establishment of protected areas in certain regions of continental Ecuador that remain unprotected and under anthropogenic threat.. Literature Cited Bass MS, Finer M, Jenkins CN, Kreft H, Cisneros-Heredia DF et al. 2010. Global Conservation significance of Ecuador’s YasunÌ National Park. PLoS ONE 5(1): e8767. Böhm M, Collen B, Baillie JEM, Bowles P, Chanson J. et al. 2013. The conservation status of the world’s reptiles. Biological Conservation 157: 372‒385. Busby J. 1991. Bioclim - A bioclimate analysis and prediction system. Pp. 64-68. In: Nature Conservation: Cost Effective Biological Surveys and Data Analysis. Editors, Margules CR, Austin MP. CSIRO, Australia. 207 p. Cuesta F, Merino-Viteri A, Muriel P, Baquero F, Freile J, Torres-Carvajal O, Peralvo M. 2015a. Escenarios de Impacto del Cambio Climático Sobre la Biodiversidad del Ecuador Continental y sus Implicaciones en el Sistema Nacional de Áreas Protegidas. Ministerio de Ambiente del Ecuador, CONDESAN, Pontificia Universidad Católica del Ecuador, Quito, Ecuador. 80 p. Cuesta F, Peralvo M, Baquero F, Bustamante M, MerinoViteri A, Muriel P, Freile J, Torres-Carvajal O. 2015b. Áreas Prioritarias para la Conservación de la Biodiversidad en el Ecuador Continental. CONDESAN, Pontificia Universidad Católica del Ecuador, GIZ, Ministerio de Ambiente del Ecuador, Quito, Ecuador. 111 p. Dodson CH, Gentry AH. 1991. Biological extinction in western Ecuador. Annals of the Missouri Botanical Garden 78(2): 273‒295. Elith J, Leathwick J. 2007. Predicting species distributions from museum and herbarium records using multiresponse models fitted with multivariate adaptive regression splines. Diversity and Distributions 13(3): 265‒275.. Acknowledgements.—We thank A. Merino-Viteri for help with SDMs, and both S. Espinosa and S. Ron for reviewing an earlier version of this manuscript. Special thanks to M. Martins, U. Roll, F. Kraus, S. Meiri, and P. Uetz for filling out the surveys. This work was supported by Pontificia Universidad Católica del Ecuador and Secretaría de Educación Superior, Ciencia, Tecnología e Innovación (SENESCYT) under the “Arca de Noé” Initiative (PIs: S.R. Ron and O. Torres-Carvajal).. Amphib. Reptile Conserv.. 55. December 2017 | Volume 11 | Number 2 | e147.
(6) Reyes-Puig et al. Myers N, Mittermeier RA, Mittermeier CG, da Fonseca GAB, Kent J. 2000. Biodiversity hotspots for conservation priorities. Nature 403(6772): 853‒858. Phillips SJ, Anderson RP, Schapire RE. 2006. Maximum entropy modeling of species geographic distributions. Ecological Modelling 190: 231‒259. Renner IW, Warton DI. 2013. Equivalence of MAXENT and Poisson point process models for species distribution modeling in ecology. Biometrics 69(1): 274‒281. Ríos-Franco C, Franco P, Forero-Medina G. 2013. Toolbox para la Identificación de Áreas Prioritarias para la Conservación, Modelo SIG Dinámico V1.0. Wildlife Conservation Society Colombia - MacArthur Foundation, Santiago de Cali, Colombia. 24 p. Roll U, Feldman A, Novosolov M, Allison A, Bauer A. et al. 2017. The global distribution of tetrapods reveals a need for targeted reptile conservation. Nature Ecology & Evolution 1: 1,677‒1,682. Sanderson EW, Jaiteh M, Levy MA, Redford KH, Wannebo AV, Woolmer G. 2002. The Human Footprint and the Last of the Wild. BioScience 52(10): 891‒904. Tapia-Armijos MF, Homeier J, Espinosa CI, Leuschner C, de la Cruz M. 2015. Deforestation and forest fragmentation in south Ecuador since the 1970s – Losing a hotspot of biodiversity. PLoS ONE 10(9): e0133701. Todd BD, Willson JD, Gibbons JW. 2010. The global status of reptiles and causes of their decline. Pp. 47‒67 In: Ecotoxicology of Amphibians and Reptiles. Second Edition. Editors, Sparling DW, Linder G, Bishop CA, Krest S. CRC Press, Boca Raton, Florida, USA. 944 p. Torres-Carvajal O, Pazmiño-Otamendi G, SalazarValenzuela D. 2017. Reptiles del Ecuador. Versión 2018.0. Museo de Zoología, Pontificia Universidad Católica del Ecuador, Quito, Ecuador. Available: http://bioweb.bio/faunaweb/reptiliaweb [Accessed: 08 December 2017]. Tovar C, Arnillas CA, Cuesta F, Buytaert W. 2013. Diverging responses of tropical Andean biomes under future climate conditions. PLoS ONE 8(5): e63634.. Elith J, Phillips SJ, Hastie T, Dudík M, Chee YE, Yates CJ. 2011. A statistical explanation of MaxEnt for ecologists. Diversity and Distributions 17(1): 43‒57. Gibbons JW, Scott DE, Ryan TJ, Buhlmann KA, Tuberville TD, Metts BS, Greene JL, Mills T, Leiden Y, Poppy S, Winne CT. 2000. The Global Decline of Reptiles, Déjà Vu Amphibians. BioScience 50(8): 653‒666. González-Palacios M, Bonaccorso E, Papeş M. 2015. Applications of geographic information systems and remote sensing techniques to conservation of amphibians in northwestern Ecuador. Global Ecology and Conservation 3: 562‒574. Hijmans RJ, Cameron SE, Parra JL, Jones PG, Jarvis A. 2005. Very high resolution interpolated climate surfaces for global land areas. International Journal of Climatology 25(15): 1,965‒1,978. Jenkins CN, Pimm SL, Joppa LN. 2013. Global patterns of terrestrial vertebrate diversity and conservation. Proceedings of the National Academy of Sciences of the United States of America 110(28): E2602‒ E2610. Killeen TJ, Douglas M, Consiglio T, Jørgensen PM, Mejia J. 2007. Dry spots and wet spots in the Andean hotspot. Journal of Biogeography 34(8): 1,357‒1,373. Lessmann J, Fajardo J, Muñoz J, Bonaccorso E. 2016. Large expansion of oil industry in the Ecuadorian Amazon: biodiversity vulnerability and conservation alternatives. Ecology and Evolution 6(14): 4,997‒5,012. Lessmann J, Muñoz J, Bonaccorso E. 2014. Maximizing species conservation in continental Ecuador: A case of systematic conservation planning for biodiverse regions. Ecology and Evolution 4(12): 2,410‒2,422. Menéndez-Guerrero PA, Graham CH. 2013. Evaluating multiple causes of amphibian declines of Ecuador using geographical quantitative analyses. Ecography 36(7): 756‒769. Mittermeier RA, Robles-Gil P, Hoffmann M, Pilgrim JD, Brooks TB, Mittermeier CG, Lamoreux JL, Fonseca GAB. 2004. Hotspots Revisited: Earth’s Biologically Richest and Most Endangered Ecoregions. CEMEX, Mexico City, Mexico. 390 p.. Amphib. Reptile Conserv.. 56. December 2017 | Volume 11 | Number 2 | e147.
(7) Diversity, threat, and conservation of reptiles from Ecuador. Carolina Reyes-Puig graduated in biological and environmental sciences from Universidad Central del Ecuador in 2012 and received a Master’s degree in conservation biology from the Pontificia Universidad Católica del Ecuador in 2015. She was curator of the Herpetology Section of the Instituto Nacional de Biodiversidad (INABIO) for almost two years, and is now an assistant professor and researcher at the Museo de Zoología and Instituto de Zoología Terrestre of the Colegio de Ciencias Biológicas y Ambientales, Universidad San Fracisco de Quito (USFQ). Her interests include taxonomic relationships of morphological characters in cryptic species of Ecuadorian herpetofauna and the spatial analysis of distribution models for species conservation.. Ana Almendáriz is a researcher and the Curator of Herpetology at the Institute of Biological Sciences at the Escuela Politécnica Nacional in Quito, Ecuador. A native of Quito, Almendáriz holds an undergraduate degree in biology and a Master’s degree in conservation and management of natural resources. She conducts research on amphibians and reptiles throughout Ecuador and has published extensively in her field.. Omar Torres-Carvajal graduated in biological sciences from Pontificia Universidad Católica del Ecuador (PUCE) in 1998, and in 2001 received a Master’s degree in ecology and evolutionary biology from the University of Kansas under the supervision of Dr. Linda Trueb. In 2005 he received a Ph.D. degree from the same institution with the thesis entitled “Phylogenetic Systematics of South American Lizards of the Genus Stenocercus (Squamata: Iguania).” Between 2006–2008 he was a postdoctoral fellow at the Smithsonian Institution, National Museum of Natural History, Washington DC, USA, working under the supervision of Dr. Kevin de Queiroz. He is currently Curator of Reptiles at the Zoology Museum QCAZ of PUCE and a professor at the Department of Biology in the same institution. He has published more than 60 scientific papers on taxonomy, systematics, and biogeography of South American reptiles, with emphasis on lizards. He is mainly interested in the theory and practice of phylogenetic systematics, particularly as they relate to the evolutionary biology of squamates.. Amphib. Reptile Conserv.. 57. December 2017 | Volume 11 | Number 2 | e147.
(8) Reyes-Puig et al. Appendix 1. Reptile conservation survey: risks, distances, and intensity of threats. 1) On a scale from 1 to 10, where 10 is the worst, how bad do you think a primary road is for reptiles? 2) On a scale from 1 to 10, where 10 is the worst, how bad do you think a secondary road is for reptiles? 3) On a scale from 1 to 10, where 10 is the worst, how bad do you think a tertiary road is for reptiles? 4) Imagine that you were to trace a straight line, perpendicular to a road, as far as you think that road has a negative impact on reptiles. How far would you go for a primary road? 0‒5 m. 10 m. 50 m. 100 m. 500 m. 1 km. 5) Imagine that you were to trace a straight line, perpendicular to a road, as far as you think that road has a negative impact on reptiles. How far would you go for a secondary road? 0‒5 m. 10 m. 50 m. 100 m. 500 m. 1 km. 6) Imagine that you were to trace a straight line, perpendicular to a road, as far as you think that road has a negative impact on reptiles. How far would you go for a tertiary road? 0‒5 m. 10 m. 50 m. 100 m. 500 m. 1 km. 7) On a scale from 1 to 10, where 10 is the worst, how bad do you think a mining area is for reptiles? 8) On a scale from 1 to 10, where 10 is the worst, how bad do you think an oil-well area is for reptiles? 9) In your opinion, what is a mine’s ratio of negative impact for reptiles? 0‒5 m. 10 m. 50 m. 100 m. 500 m. 1 km. 500 m. 1 km. 10) In your opinion, what is an oil-well’s ratio of negative impact for reptiles? 0‒5 m. 10 m. 50 m. 100 m. 11) On a scale from 1 to 10, where 10 is the worst, how bad do you think livestock husbandry and agriculture is for reptiles? 12) If you were to define a ratio of negative impact for reptiles, where livestock/agriculture facilities represent the center, how far would you go? 0‒5 m. Amphib. Reptile Conserv.. 10 m. 50 m. 100 m. 58. 500 m. 1 km. December 2017 | Volume 11 | Number 2 | e147.
(9)
Figure
Documento similar
Background: The aim of this study was to analyze the distribution of oral and maxillofacial lesions affecting chil- dren and adolescents patients from a single oral pathology
The results of this study revealed that oil palm plantations developed on land cover from secondary forest or shrubs had an impact on the number of species and the diversity
Stable isotopes applied to the study of the concrete/bentonite interaction in the FEBEX in situ test
S patial distribution of δ 13 C values along the concrete plug and the first centimeters of the bentonite barrier points to the existence of a diffusion front of carbon species from
Based on all this review of the literature on the subject, we will depart from the hypothesis that can predict the behaviour and the level of physical activity in leisure time
This study aims to estimate the impact of the land cover change from shrubs to oil palm plantation on mammal species richness, evenness, and composition and estimate the amount
Therefore, the predominant objective of the current study has been to analyze the precision of the most used digital models of global elevations such as SRTM, ASTER, ALOS
Livestock management has a direct impact on the conservation of scavenger species, especially for obligate scavengers, whose populations widely benefit from the carrion provided
distribution patterns of NAS species from milk and teat skin in dairy herds with automatic milking
