Seagrass (Posidonia oceanica) seedlings in a high CO2 world: from physiology to herbivory
12
0
0
Texto completo
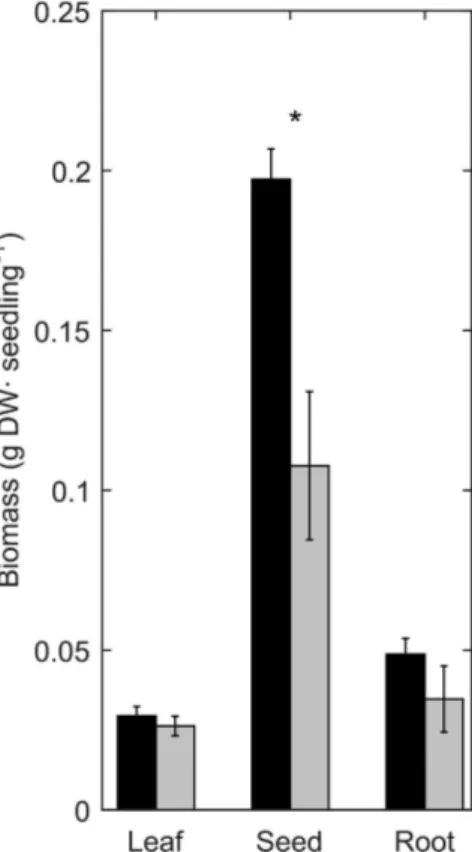
(2) www.nature.com/scientificreports/ are predicted to benefit by this increase in CO2 concentrations in two ways. First, increasing CO2 availability increases carbon fixation rates20,21. Secondly, a higher pCO2 will reduce photorespiration because of the higher diffusion of CO2, increasing the efficiency of carbon uptake22,23 and overall photosynthesis24. As a result of the increased carbon assimilation, studies in terrestrial plants show increases in biomass, non-structural carbohydrates and C:N ratios25. Due to the absorbing potential of the ocean (30–40% of anthropogenic CO2 released to the atmosphere26), seawater would increase its pCO2, with more CO2 available for photosynthetic organisms. Since most seagrasses have a C3 photosynthetic metabolism, they are predicted to benefit by the increase in CO2 availability21. Indeed, even though most seagrass species have carbon-concentrating mechanisms, they seem to be limited by the current CO2 concentration, as increased CO2 availability in the water enhances photosynthesis27–29. However, how this predicted increase in photosynthesis would translate into increase in plant performance or abundance remains unclear although long term experiments and studies in CO2 vents found increased productivity and density respectively at low pH (7.6 and 7.3)30,31. Besides, there are no conclusive patterns about long-term effects of elevated pCO2 in carbon budget or chemical composition in most seagrasses32–35. Furthermore, beyond plant productivity effects, changes in CO2 concentrations may also modify the capacity of plants to resist or tolerate herbivory36. Plants have developed diverse mechanisms against herbivory; their tolerance strategies reduce the impact of herbivory on plant fitness (e.g. increasing carbon storage to regrow after damage) and their resistance strategies reduce the feeding preference or performance of the herbivore (e.g. decreasing nutritional quality)36,37. Indeed, plant nutritional quality as well as chemical defenses are key resistance traits in controlling plant consumption by herbivores37,38. Increased pCO2 often decreases nutritional quality (increasing C/N35,39) and increases chemical defenses (e.g. phenolic compounds) in terrestrial plants, with consequences for plant-herbivore interactions40,41. Nevertheless, the scarce available literature in seagrasses suggest a decrease, rather than an increase, in the concentration of phenolic compounds with increased pCO242,43. Furthermore, the consequences of CO2-driven changes in seagrass defense strategies, as well as the consequences for plant-herbivore interactions remain poorly studied, and so far no clear general patterns emerge43–46. In addition, environmental changes in resource availability, such as high CO2 concentrations, may affect the trade-offs in resource allocation between growth and secondary metabolism in plants47,48 with significant ecological costs (e.g. outcome of interactions with herbivores, pathogens or competitors) that might be difficult to predict a priori. Understanding the effects of elevated pCO2 on the performance of seagrass seedlings is important as they represent a particularly vulnerable period experiencing high mortality rates49. Furthermore, herbivore pressure exerted on seedlings has critical effects on plant populations50, shaping composition and structure of plant communities51. Because of the critical ecological importance of early life stages and the likely physiological differences with adult stages, the effects of future high pCO2 in plant early life stages require specific examination. In this study we hypothesized that under increased CO2 availability seagrass seedlings 1) would increase their incorporation of carbon and perform better and therefore, 2) become less palatable for herbivores and thus, less preferred. To test this, we experimentally assessed the effects of increased CO2 concentrations predicted for the end of 21st century in newly emerged seedlings of P. oceanica on several morphological and physiological responses. Additionally, we estimated the effects of high pCO2 on seedling survivorship and their palatability to herbivores. To our knowledge, this is the first study examining the effects of increased CO2 availability on early life stages of seagrasses and the implications for interactions with herbivores. Given the importance of early life history changes in providing potential for adaptation and colonization to new environments, understanding how increased CO2 will influence the performance of seagrass seedlings is critical for evaluating the consequences of future CO2 increases on seagrass populations.. Results. Seedling photosynthetic traits. ETRmax and saturation irradiance (Ek) were significantly higher (27% and 24% respectively) after 60 days of treatment in the leaves of seedlings grown under high pCO2 (Supplementary material Fig. S1, Table 1). While there were no differences in AF (control pCO2: 0.641 ± 0.025, high pCO2: 0.628 ± 0.08, one-way ANOVA: F(1/12) = 0.023, P = 0.89), maximum quantum yield (Y) nor in the photosynthetic quantum efficiency (α) between pCO2 treatments (Table 1). Furthermore, no differences in photosynthetic parameters were evident after 90 days between treatments, with ETRmax and Ek decreasing in both treatments (Supplementary material Fig. S1, Table 1). Seedling size and mortality. While initial seedling size (i.e. leaf width, maximum leaf length, number of leaves, number of roots, and total root length) was similar between treatments, the number of leaves was significantly higher in seedlings from the high pCO2 treatment after 60 days (Fig. 1, Table 2). Leaf width, maximum leaf length and number of roots did not differ between treatments despite substantial growth along the experimental period. No significant difference between pCO2 treatments was found in total root length after 90 days (Fig. 1, Table 1). CO2 concentrations did not affect the mortality of seedlings (control pCO2: 7.6 ± 2.79%, high pCO2: 8.4 ± 3.1%, one-way ANOVA: F(1/12) = 0.04, P = 0.84). Seed biomass under high pCO2 was almost 2-fold higher than for control seedlings, while there where no differences between treatments for leaf and root biomass (Fig. 2, Table 3). Seedling chemical traits. The δ13C in leaves of seedlings from the high pCO2 treatment (−20.5 ± 1.19 δ‰ ) was significantly lower than in control plants (−16.4 ± 1.39 δ‰), (Table 3). Carbon content increased in leaves and roots when compared to the beginning of the experiment, but differences related to CO2 treatments were only observed in seeds, which had a higher C content under high pCO2 (Fig. 3 Table 3). The nitrogen content of seeds decreased and that of roots increased throughout the experiment and did not differ between experimental treatments. Conversely, leaf nitrogen content was ca. 17% lower in the high pCO2 when compared to the control, which increased by 13% throughout the experimental period. Scientific Reports | 6:38017 | DOI: 10.1038/srep38017. 2.
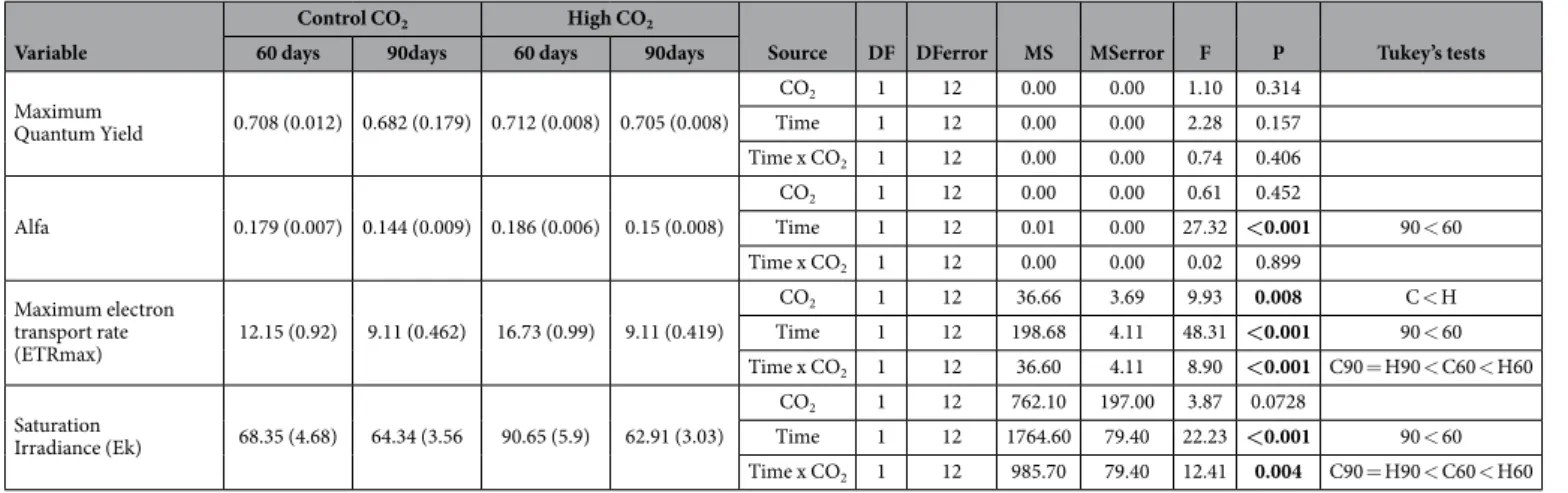
(3) www.nature.com/scientificreports/ Control CO2 Variable Maximum Quantum Yield. Alfa. Maximum electron transport rate (ETRmax) Saturation Irradiance (Ek). 60 days. High CO2. 90days. 60 days. 90days. Source. 0.708 (0.012) 0.682 (0.179) 0.712 (0.008) 0.705 (0.008). 0.179 (0.007) 0.144 (0.009) 0.186 (0.006). 12.15 (0.92). 68.35 (4.68). 9.11 (0.462). 16.73 (0.99). 64.34 (3.56. 90.65 (5.9). MS. MSerror. F. P. CO2. DF DFerror 1. 12. 0.00. 0.00. 1.10. 0.314. Time. 1. 12. 0.00. 0.00. 2.28. 0.157. Time x CO2. 1. 12. 0.00. 0.00. 0.74. 0.406. CO2. 1. 12. 0.00. 0.00. 0.61. 0.452. Time. 1. 12. 0.01. 0.00. 27.32 <0.001. Time x CO2. 1. 12. 0.00. 0.00. 0.02. 0.899 0.008. 0.15 (0.008). Tukey’s tests. 90 < 60. CO2. 1. 12. 36.66. 3.69. 9.93. Time. 1. 12. 198.68. 4.11. 48.31 <0.001. Time x CO2. 1. 12. 36.60. 4.11. 8.90. <0.001 C90 = H90 < C60 < H60. CO2. 1. 12. 762.10. 197.00. 3.87. 0.0728. Time. 1. 12. 1764.60. 79.40. 22.23 <0.001. Time x CO2. 1. 12. 985.70. 79.40. 12.41. 9.11 (0.419). 62.91 (3.03). 0.004. C < H 90 < 60. 90 < 60 C90 = H90 < C60 < H60. Table 1. Mean, standard error and results of repeated measures ANOVA in photosynthetic parameters and Tukey HSD test (H: HighCO2, C: Control CO2, 60: 60 days 90: 90 days, n = 7).. Figure 1. Leaf width (a), maximum leaf length (b), root length (c), number of roots (d), and number of leaves (e) measured in seedlings growing under high CO2 (black) or control (grey) conditions, at the beginning of the experiment and after 25,60 and 90 days. Total root length (c) was only measured at the beginning and after 90 days of experiment. Error bars indicate standard error. Asterisk indicates statistically significant differences between treatments. Hence, the leaf C/N ratio was 14% higher in CO2-enriched plants when compared to controls (Fig. 3, Table 3). CO2 enrichment resulted in higher (more than 30%) content of sucrose in seeds and roots, while no significant changes were detected between treatments in starch content. Sucrose content in leaves was almost two fold higher in the increased pCO2 treatment compared to the non-enriched (Fig. 4, Table 3). The increase in CO2 availability did not affect the total phenolic content (Kruskal Wallis test. χ2 = 0.102, df = 1, P = 0.749) nor the fiber content (Fig. 4, Table 3) of leaves, while it significantly decreased (39%) phenolic content in the seeds (Kruskal Wallis test, χ2 = 6.208, df = 1, P = 0.013).. Herbivore feeding experiment.. Sea urchins consumed a significantly higher amount of fresh leaf tissue biomass from leaves grown under high pCO2 in comparison to control pCO2 conditions (Wilcoxon signed-ranks paired test, z = 2.78, n = 19, P = 0.004, Fig. 5).. Discussion. Early life seagrass stages could benefit under the future elevated CO2 predicted scenarios. Our results show that, in general, seedling photosynthetic performance was enhanced under elevated pCO2 levels during the initial phases of seedling development, leading to increased sucrose content of leaves, roots and seeds, and an overall increase in carbon storage. These positive effects could translate into having more resources stored to resist or recover from stressful conditions. On the other hand, increased CO2 availability led to biochemical changes in leaves that resulted in shifts in the palatability of this tissue. While currently the major source of photosynthetic inorganic carbon uptake in P. oceanica seems to be in form of HCO3− rather than CO2[aq], a future increase in CO2[aq] may change this ratio28,52. The higher ETRmax observed after 60 days of experiment suggests a greater ability to transfer electrons under high CO2 conditions. Scientific Reports | 6:38017 | DOI: 10.1038/srep38017. 3.
(4) www.nature.com/scientificreports/ Variable Leaf Width. Maximum Leaf Length. Number of Leaves. Number of Roots. Total Root Length. Source. DF. DFerror. MS. MSerror. F. P. CO2. 1. 12. 0. 0.001. 0.12. 0.733. Time. 3. 36. 0.219. 0. Time x CO2. 3. 36. 0. 0. CO2. 1. 12. 0.034. 0.333. Time. 3. 36. 51.38. 0.1. Time x CO2. 3. 36. 0.05. 0.1. 514.37 <0.0001 0.18. 0.909. 0.1. 0.754. 525.88 <0.0001 0.54. 0.661. 13.4. 0.003. CO2. 1. 12. 4.153. 0.31. Time. 3. 36. 23.39. 0.126. Time x CO2. 3. 36. 0.426. 0.126. 3.29. 0.032. CO2. 1. 12. 0.001. 0.055. 0.02. 0.923. 184.99 <0.0001. Time. 3. 36. 17.31. 0.029. 602.5. <0.0001. Time x CO2. 3. 36. 0.009. 0.029. 0.32. 0.811. CO2. 1. 6. 0.8. 3.99. 0.18. 0.674. Time. 3. 23. 740.3. 4.5. 162.9. <0.0001. Time x CO2. 3. 23. 6.5. 4.5. 1.43. 0.244. Tukey’s tests 0 < 25 < 60 < 90. 0 < 25 < 60 < 90 C60 < H60 0 < 25 < 60 < 90 C60 < H60 0 < 25 < 60 < 90. 0 < 90. Table 2. Results of Repeated Measures ANOVA in morphometric parameters, and Tukey HSD test (H: HighCO2; C: Control CO2; 0: beginning experiment; 25: 25 days; 60: 60 days; 90: 90 days, n = 7).. Figure 2. Mean dry Biomass (g) of leaves, seeds and roots of seedlings growing under high CO2 (black) or control (grey) conditions. Error bars indicate standard error. Asterisk indicates statistically significant differences between treatments.. Interestingly, seeds of Posidonia spp seedlings have photosynthetic activity that enhances seedling growth53. While we did not measure the photosynthetic activity of the seed, a higher CO2 availability could have also increased photosynthesis in this organ, potentially contributing to a higher total photosynthetic activity when compared to seedlings from other species or adults. As demonstrated by the δ13C values in our study, seedlings from high pCO2 treatments exhibited reduced CO2 fractionation, suggesting that seedlings growing under present CO2 are likely CO2-limited. In addition, leaves from the increased pCO2 treatment had a higher content of sucrose, an effect that has been also found in other studies with adult seagrasses39. Sucrose is the principal end-product of leaf photosynthesis54; and the higher content found in our study is thus likely resulting from the increased photosynthetic activity during the. Scientific Reports | 6:38017 | DOI: 10.1038/srep38017. 4.
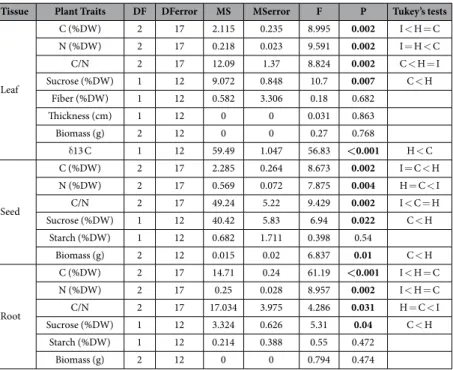
(5) www.nature.com/scientificreports/ Tissue. Leaf. Seed. Root. Plant Traits. DF. DFerror. MS. MSerror. F. P. C (%DW). 2. 17. 2.115. 0.235. 8.995. 0.002. Tukey’s tests I < H = C. N (%DW). 2. 17. 0.218. 0.023. 9.591. 0.002. I = H < C. C/N. 2. 17. 12.09. 1.37. 8.824. 0.002. C < H = I. Sucrose (%DW). 1. 12. 9.072. 0.848. 10.7. 0.007. C < H. Fiber (%DW). 1. 12. 0.582. 3.306. 0.18. 0.682. Thickness (cm). 1. 12. 0. 0. 0.031. 0.863. Biomass (g). 2. 12. 0. 0. 0.27. 0.768. δ13 C. 1. 12. 59.49. 1.047. 56.83. <0.001. H < C. C (%DW). 2. 17. 2.285. 0.264. 8.673. 0.002. I = C < H. N (%DW). 2. 17. 0.569. 0.072. 7.875. 0.004. H = C < I. C/N. 2. 17. 49.24. 5.22. 9.429. 0.002. I < C = H C < H. Sucrose (%DW). 1. 12. 40.42. 5.83. 6.94. 0.022. Starch (%DW). 1. 12. 0.682. 1.711. 0.398. 0.54. Biomass (g). 2. 12. 0.015. 0.02. 6.837. 0.01. C < H. C (%DW). 2. 17. 14.71. 0.24. 61.19. <0.001. I < H = C. N (%DW). 2. 17. 0.25. 0.028. 8.957. 0.002. I < H = C. C/N. 2. 17. 17.034. 3.975. 4.286. 0.031. H = C < I C < H. Sucrose (%DW). 1. 12. 3.324. 0.626. 5.31. 0.04. Starch (%DW). 1. 12. 0.214. 0.388. 0.55. 0.472. Biomass (g). 2. 12. 0. 0. 0.794. 0.474. Table 3. Results of one way ANOVAs in plant traits and Tukey HSD test (I: Initial, H: HighCO2, C: Control CO2, n = 7).. Figure 3. Percentage of dry weight in Nitrogen (N), Carbon (C), and Carbon Nitrogen ratio (C/N), in leaves (a), seeds (b) and roots (c) of seedlings at the beginning of the experiment (white) or after growing under high CO2 (black) or control (grey) conditions. Error bars indicate standard error and different letters indicate statistically significant differences across treatments (Tukey).. early development of the seedlings. In general, higher CO2 availability increases photosynthetic activity in seagrasses30,34,35,55 which sometimes translates into increases in aboveground biomass or growth33,35,39. However this increase in photosynthesis and thus in carbon incorporation is not always allocated to aboveground growth32,34,45. In our study, seedlings under high pCO2 did not allocate carbon to changes in aboveground size at the end of the experimental period but rather to maintain or slow the decrease of seed biomass. Similarly, adult seagrasses can also exhibit an increase in belowground biomass56 or changes in the chemical composition of below and aboveground tissues32,45. In this study, seeds exhibited lower sucrose content in the control treatment, which suggests that seedlings growing under high pCO2 had a lower consumption of sucrose from seeds or that sucrose was produced through photosynthesis, mobilized to belowground tissues and stored in seeds. This effect of increased non-structural carbohydrates in belowground tissues has been also found in adult seagrasses under experimental increase in CO2 availability32,39. In seedlings, this is particularly important since seeds store and supply carbon and nutrients to the seedling during the first year of its life57. Increased carbon reserves and biomass of the seed would benefit seedling survival and resilience to stressful conditions, especially in seagrasses such as P. oceanica in which the buoyant fruits disperse to new habitats away from the original meadow. Having more resources to tolerate or resist adverse light and temperature conditions or damage by herbivores would likely improve seedling establishment and Scientific Reports | 6:38017 | DOI: 10.1038/srep38017. 5.
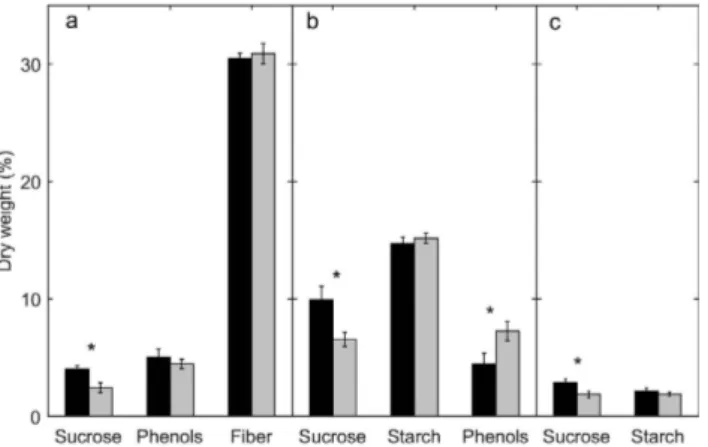
(6) www.nature.com/scientificreports/. Figure 4. Percentage of dry weight in sucrose, starch, total phenol content (Phenols), and fiber in leaves (a). seeds (b) and roots (c) of seedlings growing under high CO2 (black) or control (grey) conditions. Error bars indicate standard error. Asterisk indicates statistically significant differences between treatments.. Figure 5. Percentage of fresh weight consumed by herbivores from leaf tissue of seedlings growing under high CO2 (black) or control (grey) conditions. Error bars indicate standard error. Asterisk indicates statistically significant differences between treatments. survival58, which are key features of a successful population expansion process. Particularly in P. oceanica in which flowering frequency varies greatly spatially and among years (0–26%)59 with a low reproductive success (3–11% of seedlings available for establishment) mainly due to seed predation60. Despite the cost of less carbon available for growth, carbon allocation to defense and storage often results in higher survivorship of organs and individuals61. Secondary metabolites are associated with defense mechanisms in plants (e.g. feeding deterrence62,63) being for some herbivores more determinant of their preference than other attributes such as carbohydrates or fibers64. According to the resource availability hypothesis (RAH65) plants grown under high resource availability will invest less in defense components than plants grown under limited resourced environments. Therefore, seagrasses grown under elevated nutrient availability (usually a limiting resource66) often decrease the production of chemical defenses such as phenols67,68. Being carbon-based compounds, most of the studies in terrestrial plants25 and some species of macroalgae69 have found increases in phenolic compounds with elevated CO2 availability. Yet, because CO2 is also a resource that can greatly limit primary production in seagrasses28,52,70, we may expect a decrease in phenolics (rather than the increase often observed in terrestrial plants) under high CO2 scenarios, following RAH. Indeed both a decrease42,43 as well as no changes45, but never an increase, in phenolic compounds have been reported in seagrass leaves growing under elevated CO2 conditions. While we did not find significant changes in phenol content in leaves associated with CO2 availability, we did observe it in seeds. Since defense has a cost, not all plant parts are equally defended, as they contribute differently to fitness71,72. Seeds have multiple important functions (e.g. carbon storage, nutrient supply and photosynthesis) which are critical for seedling survival. Thus, seeds may be an organ whose defense is prioritized under resource-limited conditions (e.g. present-day levels of CO2). Seeds from seedlings of the control treatments had significantly higher phenol content than those from the increased pCO2 treatment, which were Scientific Reports | 6:38017 | DOI: 10.1038/srep38017. 6.
(7) www.nature.com/scientificreports/ bigger (higher biomass), with higher carbon content and more stored sucrose. Having more resources (i.e. CO2) available in the environment may have decreased the investment of carbon on seed defense towards favoring the storage of other more rapidly available carbon-based compounds such as sucrose73. A decrease in nutritional quality (as a decrease in nitrogen or increased C/N content) in response to high CO2 has been commonly observed in terrestrial25,74 and marine plants32,35,39, and it has been attributed to a dilution of nitrogen due to increased leaf growth75, increases in leaf carbohydrates and structural material, higher plant internal nitrogen requirements76,77 and/or reductions in protein concentrations78. Some studies in Zostera noltei also found a lower N content under high pCO2 conditions together with a lower nitrate uptake79. This reduced nitrate uptake could be the reason for the lower nitrogen content observed in leaves in the high pCO2 treatment in this study, which would not be related to a dilution of nitrogen by increased growth since there were no differences in leaf biomass at the end of the experiment. The reduced nutritional quality observed in seagrass leaves could have consequences for herbivores that may compensate this low nutritional quality by increasing their feeding rates80,81. Unexpectedly, in our study, leaves with lower nitrogen content were preferred by sea urchins, whereas herbivores typically prefer tissues with higher N content82–84. However, N content also includes nitrogen in insoluble forms and alkaloids84, and does not necessarily reflect availability and quality for herbivores. In addition, factors other than nitrogen content may also be influencing the palatability of seagrass to herbivores. Leaf fiber content may reduce the preference of grazers by reducing the digestibility to herbivores85, increasing leaf toughness86 or decreasing the preference for high carbon-fiber plant species87. The neutral detergent fiber method measures most of the groups of structural constituents of plant cells (e.g. cellulose, lignin, hemicellulose). Yet, not all the components are similar in terms of production costs and defensive properties. Lignin provides better structural and chemical defensive properties than cellulose, which has half the biosynthesis cost in glucose equivalents88. Therefore, even though we did not detect differences in the fiber content between treatments, we cannot rule out that the relative composition of chemical components of the fiber could have differed under high CO2 concentrations43,89,90, and consequently, may have modified the palatability of the tissues. One of the biochemical traits that changed with higher pCO2 availability was sucrose content in leaves, which may have enhanced plant palatability. In insects, for instance, sugars increase stimulation to taste91 and can mask the deterrent effect of other compounds92. Additionally, we performed the feeding experiments only with the sea urchin P. lividus, whereas different herbivore species may have responded differently to CO2-driven changes in plant chemical composition45,74 or epiphyte abundance or composition since it is expected that fleshy epiphytes may increase93 and calcareous epibionts would decrease their abundance under low pH conditions30. While we only performed the feeding experiments under ambient CO2 water conditions, studies to date with adult sea urchins do not suggest strong changes in feeding rates94,95, nor in preferences (S.R. Fitzpatrick, personal communication) under ambient vs. high pCO2 conditions. In summary, the results of our experiment suggest that seedlings of P. oceanica might perform better under a high CO2 scenario. The enhanced photosynthetic activity and carbon fixation increased the amount of resources available for storage, which would benefit these early life stages to resist or recover from stress. Yet, positive effects might be counterbalanced by changes in grazing pressure due to increased palatability, although allocation of resources to tolerance could allow seedlings to survive and persist to shifts in herbivory pressure.. Materials and Methods. Fruit collection and seed germination. Beach-stranded fruits of Posidonia oceanica were collected in Palma Bay (Mallorca, Balearic Islands, Western Mediterranean) during May 2013 and transported to the laboratory in a cooler with seawater. Seeds were extracted from the fruits and maintained in aquaria at constant temperature (17 °C) with UV-filtered seawater for approximately one month until the initiation of the experiment. Experimental design and setup. To evaluate the effect of CO2 availability on P. oceanica seedlings, seawater was aerated with a mix of air and pure CO2 gasses using Mass Flow Controllers (Aalborg, USA) in order to obtain experimental CO2 values of actual (ca.500 ppm hereafter control treatment) and future oceanic conditions (ca. 1550 ppm, hereafter high pCO2 treatments). Seventeen seedlings of homogeneous size (control pCO2: 0.759 ± 0.007 g wet mass seedling−1, high pCO2: 0.758 ± 0.010 g wet mass seedling−1; one-way ANOVA: F(1/12) = 0.015; P = 0.908) were randomly assigned to each of the seven replicate 9-L aquaria with control or high pCO2 treatments and maintained in these conditions for 90 days in 14:10 h (light: dark) light cycle. In order to maintain pH conditions and to avoid changes in other parameters of carbonate systems (i.e. alkalinity) seedlings were grown without substrate. Aquariums were cleaned and re-filled every 7 days with filtered seawater (10 μm plus UV filter) and CO2 pre-treated seawater to maintain stable salinity levels and water quality. Water conditions.. Two discrete pH samples (total scale) were taken once a week from each aquarium and analyzed by spectrophotometric method under controlled temperature (17 °C). At the same time, two replicate water samples (50 cc) from each aquarium were taken for dissolved inorganic carbon (DIC) and Total Alkalinity (AT). Water samples were fixed with supersaturated HgCl2 (Merck, Analar) to avoid biological activity and changes in AT conditions. AT values were obtained by double endpoint titration to pH 4.45 and 4.41 (NBS scale) with HCl (Fixanal ) according to Dickson Sop 3b (version 3.01), using a Tritando 808 and Aquatrode plus (Metrohm ). The accuracy of measurements was checked against certified reference seawater (CRM, Batch 101, Dickson Scripps Institution of Oceanography, San Diego, USA). Salinity was measured daily (Hanna Instruments) and maintained at 36 psu while light and temperature were continuously recorded using HOBO data loggers (Onset ) . Carbonate system parameters were estimated using CO2SYS96 with dissociation constants (K1 and K2) according. ®. ®. ®. Scientific Reports | 6:38017 | DOI: 10.1038/srep38017. 7.
(8) www.nature.com/scientificreports/ to Millero et al.97 and KHSO4 dissociation constant after Dickson98. A summary of experimental treatment conditions is shown in Supplementary material Table S1.. Seedling photosynthetic traits. Photosynthetic measurements were performed by pulse amplitude mod-. ulated (PAM) fluorometry (Walz, Effeltrich, Germany) on the seedlings after 60 and 90 days of exposition to control and high pCO2 conditions. First, the maximum quantum yield on dark-adapted seedlings was determined in three seedlings per aquarium by applying a saturating light pulse in the second leaf of each seedling after a 5-min period of dark-adaptation. To reduce variability within seedlings, all measurements were made approximately 2 cm above the leaf meristem. Effective quantum yield was measured after 10 s-exposures to 0, 11, 36, 72, 82, 140, 231, 300 and 455 μmol m−2 s−1 photon flux densities to obtain Rapid Light Curves (RLCs) in the same dark-adapted seedlings. Leaf absorbance (AF) was measured by placing 1–4 layers of leaves in front of the PAR sensor instrument and recording the percentage light absorbed by the seagrass99. AF was calculated as 1- exp (-α) where αis the slope of the linear correlation of the ln of the light transmitted against the number of leaf layers. Electron Transport Rates (ETR) from the RLC data were calculated as ETR = yield × irradiance × 0.5 × AF100. ETR values were plotted against the incident absorbed PAR and the photosynthetic quantum efficiency (α) was calculated as the slope of the linear part of the light response curve and the saturation irradiance (Ek) as the division of ETRmax by the initial slope. The maximum electron transport rate (ETRmax) and the maximum quantum yield (Y) were calculated as the maximum ETR and effective quantum yield (∆F/Fm’) of each ETR-PAR curve.. Seedling size and mortality.. Leaf width of the second leaf, maximum leaf length, total root length and number of leaves and roots of each seedling were measured at the beginning of the experiment and after 25, 60 and 90 days with the exception of root length that was only measured at the beginning and at the end of the experiment (90 days) to avoid damage. Leaf thickness was measured in the second leaf at the mid-point of their length with a precision caliper (resolution 0.01 mm) in three seedlings per aquaria. Seedling mortality was calculated as the percentage of seedlings dead after 90 days relative to the initial number of seedlings placed in each replicate aquarium. A seedling was considered dead when all leaves were shed from the sheath or necrotic. After 90 days, five seedlings were randomly selected from each experimental aquarium and dried for 48 h at 60 °C to determine biomass of leaves, roots and seed of each one.. Seedling chemical traits.. Effects of CO2 enriched seawater in the inorganic carbon intake of leaves, were analyzed using stable isotope ratios. Leaves of four seedlings per aquaria were dried (60 °C for 48 hours), ground and treated with HCL fumes (37%, 12–24 h) to remove carbonates101. Stable isotopes signatures were analyzed from 0.5 mg in a NC1500 elemental analyzer (Carlo Erba, Milan, Italy) combined with a Delta Plus XL isotope ratio mass spectrometer (ThermoQuest, Bremen, Germany). Isotope ratios in samples were calculated as:. (. ). δX = R sample/R standard –1 × 1000 . where X is 13C, and R is the corresponding ratio of 13C/12C. Commercial CO2 was used as working standard and two internal standards with δ13C −3 0.63‰ and −11.65‰ (Vienna- PDB, V-PDB) were used for the isotopic analyses. For carbon, 22 internal standards (organic and inorganic material) ranging from −49.44‰ to + 28.59‰ (V-PDB) were contrasted with the IAEA international references NBS-28, NBS-29, NBS-20 (carbonates) and NBS-22, IAEA-CH-7, IAEA-CH-6 (organic material). The precision, calculated after correction of the mass spectrometer daily drift, was ± 0.1‰ for δ13C. Regarding seedling traits related to herbivory, we considered total phenolic compounds, fiber, nitrogen content (% dry weight, DW), sucrose content (%DW) and C/N of leaves as resistance traits, whereas the number of leaves, and the carbon (% DW), sucrose and starch (%DW) content of seeds and roots were considered tolerance traits. Pooled plant material (ca. 6 seedlings) of each experimental aquarium was ultrafrozen (−8 0 °C), freeze-dried, and ground to a fine powder to determine the concentration of carbon, nitrogen, fiber, sucrose and total phenols in leaves and carbon, nitrogen, starch and sucrose in seeds and roots and total phenols in seeds. In order to have an initial reference on carbon and nitrogen contents, 6 samples of seedlings (pooled plant material of ca. 6 seedlings each) were freeze-dried at the beginning of the experiment. Carbon and nitrogen content in leaves, seeds and roots were analyzed using a Carlo-Erba CNH elemental analyzer (EA1108). Total phenols were extracted from ca. 4 mg of ground tissue with 1.5 mL of methanol 50% for 24 h and were determined with spectrophotometer (Hitachi, U-2900) following a modified Folin-Ciocalteu method using caffeic acid as standard (modified from Bolser et al.102). Non-structural carbohydrates in leaves (sucrose), and seeds and roots (sucrose and starch) were measured using methodology described by Invers66. Sucrose and other soluble sugars were obtained after three sequential extractions with 95% (v/v) ethanol at 80 °C for 15 min. The remaining pellet of roots and seeds was dissolved in 0.1N NaOH for 24 h at room temperature for starch extraction. Soluble sugars and starch contents of extracts were determined by spectrophotometry using an anthrone assay with sucrose as standard. Neutral detergent fiber content (NDF) was measured in 25–30 mg of leaf sample (see de los Santos et al.103, modification from Van Soest et al.104). The amount of NDF in each sample was obtained by difference in dry biomass and is referred as ‘fiber content’ hereafter.. Feeding experiment. In order to examine how biochemical changes due to increased CO2 availability modify plant palatability, we performed a feeding assay with herbivorous sea urchins. After 90 days of treatment, four seedlings from each experimental aquarium of both pCO2 treatments were used in a two-choice experiment. The feeding assay was performed in an indoor seawater flow-through system (i.e. ambient CO2 conditions) and Scientific Reports | 6:38017 | DOI: 10.1038/srep38017. 8.
(9) www.nature.com/scientificreports/ a light:dark photoperiod of 12:12 h. Similar-sized sea urchins (4.98 ± 0.66 cm, one-way ANOVA: F(1/22) = 1.695; P = 0.21) of the species Paracentrotus lividus, the main invertebrate herbivore on P. oceanica meadows, were acclimated for a period of 48 hours and fed with Ulva lactuca ad libitum. Individual urchins were placed in cages of 225 cm2 covered with a 1 cm mesh and offered similar amounts of leaf tissue clean of epiphytes (c.a. 3–4 leaves from one seedling) from control and high CO2 treatments. Control cages without herbivores were used to measure any potential changes in leaf tissue not related to grazing. The weight changes in the controls were used to correct the autogenic changes in the feeding replicates. The corrected consumption was calculated as: TreatmentInitial (FW) ⁎ (ControlFinal (FW)/ControlInitial (FW) ) − TreatmentFinal (FW). The experiment consisted of 20 replicates and ended when approximately 50% of initial material was consumed. Following the procedures of previous feeding behavior experiments45, replicates in which all the offered samples were either totally consumed or fully intact were not considered in the statistical analysis.. Statistical analyses. Differences in initial wet weights between treatments as well as seedling mortality and size of sea urchins were analyzed using a one-way ANOVA analysis. Plant size traits were analyzed using repeated measures ANOVA analyses with time (days) as within-subject factor and pCO2 treatment (high and control) as the between subject factor. The effects of experimental treatments on plant chemical traits (leaf total phenol content, leaf thickness, leaf fiber content, non-structural carbohydrates of leaves, seeds and roots, and biomass of leaves, seed and roots) obtained at the end of the experiment were analyzed by means of one-way ANOVA tests. Carbon and nitrogen contents of leaf, seed and roots were also compared with the initial samples with a one-way ANOVA. Total phenolic content of leaves and seeds was analyzed with Kruskal-Wallis rank sum test as the data were not normal even after transformation. The mean value of each aquarium was used as replicate for all the above-mentioned analyses. The analysis of two-choice experiments was performed using a Wilcoxon signed-ranks paired test. Post hoc analyses were performed with Tukey multiple comparisons of means. Data were checked for normality with the Saphiro-Wilk test and homogeneity of variances with the Bartlett test. ANOVAs were conducted without transformation of the variables.. References 1. 2. 3. 4.. 5. 6. 7. 8. 9. 10. 11. 12. 13. 14. 15. 16. 17. 18. 19. 20. 21. 22. 23. 24. 25. 26. 27.. Orth, R. et al. A Global Crisis for Seagrass Ecosystems. Bioscience 56, 987–996 (2006). Fourqurean, J. W. et al. Seagrass ecosystems as a globally significant carbon stock. Nat. Geosci. 5, 505–509 (2012). Mazarrasa, I. et al. Seagrass meadows as a globally significant carbonate reservoir. Biogeosciences 12, 4993–5003 (2015). Pergent, G. et al. Climate change and Mediterranean seagrass meadows: A synopsis for environmental managers. Mediterr. Mar. Sci. 15, 462–473 (2014). Borowitzka, M. A. & Lethbridge, R. C. In Seagrasses: With Special Reference to the Australasian Region (eds Larkum, A. W. D., McComb, A. J. & Shepherd, S. A.) 458–499 (Elsevier Ltd, 1989). Jackson, E. L., Rees, S. E., Wilding, C. & Attrill, M. J. Use of a seagrass residency index to apportion commercial fishery landing values and recreation fisheries expenditure to seagrass habitat service. Conserv. Biol. 29, 899–909 (2015). Waycott, M. et al. Accelerating loss of seagrasses across the globe threatens coastal ecosystems. Proc. Natl. Acad. Sci. USA. 106, 12377–81 (2009). Boudouresque, C. F., Bernard, G., Pergent, G., Shili, A. & Verlaque, M. Regression of Mediterranean seagrasses caused by natural processes and anthropogenic disturbances and stress: A critical review. Bot. Mar. 52, 395–418 (2009). Jump, A. S., Marchant, R. & Peñuelas, J. Environmental change and the option value of genetic diversity. Trends Plant Sci. 14, 51–58 (2009). Kramer, A. T. & Havens, K. Plant conservation genetics in a changing world. Trends Plant Sci. 14, 599–607 (2009). Hughes, A. R., Inouye, B. D., Johnson, M. T. J., Underwood, N. & Vellend, M. Ecological consequences of genetic diversity. Ecol. Lett. 11, 609–623 (2008). Orth, R., Harwell, M. & Inglis, G. In Seagrasses: Biology, Ecology and Conservation (eds. Larkum, A., Orth, R. J. & Duarte, C. M.) 111–133 (Springer, 2006). Jahnke, M., Olsen, J. L. & Procaccini, G. A meta-analysis reveals a positive correlation between genetic diversity metrics and environmental status in the long-lived seagrass Posidonia oceanica. Mol. Ecol. 24, 2336–2348 (2015). Ridley, H. N. The dispersal of plants throughout the world. (Reeve & Company, 1930). Canadell, J. G. et al. Contributions to accelerating atmospheric CO2 growth from economic activity, carbon intensity, and efficiency of natural sinks. Proc. Natl. Acad. Sci. USA. 104, 18866–18870 (2007). Le Quéré, C. et al. Trends in the sources and sinks of carbon dioxide. Nat. Geosci. 2, 831–836 (2009). IPCC. Climate Change 2013: The Physical Science Basis. Summary for Policymakers. Ipcc 1–29 (2013). Wigley, T. M. L., Richels, R. & Edmonds, J. A. Economic and environmental choices in the stabilization of atmospheric CO 2 concentrations. Nature 379, 240–243 (1996). Pörtner, H. O., Langenbuch, M. & Reipschläger, A. Biological impact of elevated ocean CO2 concentrations: Lessons from animal physiology and earth history. J. Oceanogr. 60, 705–718 (2004). Giordano, M. & Beardall, J. & Raven, J. a. CO2 concentrating mechanisms in algae: mechanisms, environmental modulation, and evolution. Annu. Rev. Plant Biol. 56, 99–131 (2005). Koch, M., Bowes, G., Ross, C. & Zhang, X. H. Climate change and ocean acidification effects on seagrasses and marine macroalgae. Glob. Chang. Biol. 19, 103–132 (2013). Bowes, G., Ogren, W. L. & Hageman, R. H. Phosphoglycolate production catalyzed by ribulose diphosphate carboxylase. Biochem. Biophys. Res. Commun. 45, 716–722 (1971). Ehleringer, J. R. In A History of Atmospheric CO2 and its Effects on Plants, Animals and Ecosistems (eds Ehleringer, J. R., Cerling, T. E.& Dearing, M. D.) 214–231 (Springer, 2005). Long, S. P., Ainsworth, E., Rogers, A. & Ort, D. R. Rising atmospheric carbon dioxide: plants FACE the future. Annu. Rev. Plant Biol. 55, 591–628 (2004). Robinson, E. a, Ryan, G. D. & Newman, J. A. A meta-analytical review of the effects of elevated CO2 on plant – arthropod interactions highlights the importance of interacting environmental and biological variables. New Phytol. 194, 321–336 (2012). Houghton, R. A. Balancing the Global Carbon Budget. Annu. Rev. Earth Planet. Sci. 35, 313–347 (2007). Beer, S., Bjork, M., Hellblom, F. & Axelsson, L. Inorganic carbon utilisation in marine angiosperms (seagrasses). Funct. Plant Biol. 29, 349–354 (2002).. Scientific Reports | 6:38017 | DOI: 10.1038/srep38017. 9.
(10) www.nature.com/scientificreports/ 28. Invers, O., Zimmerman, R. C., Alberte, R. S., Pérez, M. & Romero, J. Inorganic carbon sources for seagrass photosynthesis: An experimental evaluation of bicarbonate use in species inhabiting temperate waters. J. Exp. Mar. Bio. Ecol. 265, 203–217 (2001). 29. Borum, J. et al. Photosynthetic response to globally increasing CO2 of co-occurring temperate seagrass species. Plant. Cell Environ. 39, 1240–1250 (2016). 30. Cox, T. E. et al. Effects of ocean acidification on Posidonia oceanica epiphytic community and shoot productivity. J. Ecol. 103, 1594–1609 (2015). 31. Hall-Spencer, J. M. et al. Volcanic carbon dioxide vents show ecosystem effects of ocean acidification. Nature 454, 96–99 (2008). 32. Campbell, J. E. & Fourqurean, J. W. Effects of in situ CO2 enrichment on the structural and chemical characteristics of the seagrass Thalassia testudinum. Mar. Biol. 160, 1465–1475 (2013). 33. Russell, B. D. et al. Future seagrass beds: Can increased productivity lead to increased carbon storage? Mar. Pollut. Bull. 73, 463–469 (2013). 34. Apostolaki, E. T., Vizzini, S., Hendriks, I. E. & Olsen, Y. S. Seagrass ecosystem response to long-term high CO2 in a Mediterranean volcanic vent. Mar. Environ. Res. 99, 9–15 (2014). 35. Takahashi, M., Noonan, S. H. C., Fabricius, K. E. & Collier, C. J. The effects of long term in-situ CO 2 enrichment on tropical seagrass communities at volcanic vents. ICES J. Mar. Sci. 73, 876–886 (2016). 36. Strauss, S. Y. & Agrawal, A. A. The ecology and evolution of plant tolerance to herbivory. Trends Ecol. Evol. 14, 179–185 (1999). 37. Fritz, R. S. & Simms, E. L. Plant Resistance to Herbivores and Pathogens, ecology, evolution, and genetics. Univ. of Chicago Press (Univ. of Chicago Press, 1992). 38. Hay, M. E. Marine chemical ecology: Chemical signals and cues structure marine populations, communities and ecosystems. In Annual Review of Marine Science 1, 193–212 (2009). 39. Jiang, Z. J., Huang, X. P. & Zhang, J. P. Effects of CO2 enrichment on photosynthesis, growth, and biochemical composition of seagrass Thalassia hemprichii (Ehrenb.) Aschers. J. Integr. Plant Biol. 52, 904–913 (2010). 40. Zvereva, E. L. & Kozlov, M. V. Consequences of simultaneous elevation of carbon dioxide and temperature for plant-herbivore interactions: a metaanalysis. Glob. Chang. Biol. 12, 27–41 (2006). 41. Stiling, P. & Cornelissen, T. How does elevated carbon dioxide (CO2) affect plant–herbivore interactions? A field experiment and meta-analysis of CO2 -mediated changes on plant chemistry and herbivore performance. Glob. Chang. Biol. 13, 1823–1842 (2007). 42. Arnold, T. et al. Ocean Acidification and the Loss of Phenolic Substances in Marine Plants. PLoS One 7, e35107 (2012). 43. Arnold, T., Freundlich, G., Weilnau, T., Verdi, A. & Tibbetts, I. R. Impacts of Groundwater Discharge at Myora Springs (North Stradbroke Island, Australia) on the Phenolic Metabolism of Eelgrass, Zostera muelleri, and grazing by the Juvenile Rabbitfish, Siganus fuscescens. PLoS One 9, e104738 (2014). 44. Martinez-Crego, B., Olive, I. & Santos, R. CO2 and nutrient-driven changes across multiple levels of organization in Zostera noltii ecosystems. Biogeosciences 11, 7237–7249 (2014). 45. Tomas, F., Martinez-Crego, B., Hernan, G. & Santos, R. Responses of seagrass to anthropogenic and natural disturbances do not equally translate to its consumers. Glob. Chang. Biol. 21, (2015). 46. Burnell, O. W., Russell, B. D., Irving, A. D. & Connell, S. D. Eutrophication offsets increased sea urchin grazing on seagrass caused by ocean warming and acidification. Mar. Ecol. Prog. Ser. 485, 37–46 (2013). 47. Bryant, J. P., Chapin, F. S. & Klein, D. R. Carbon nutrient balance of boreal plants in relation to vertebrate herbivory. OIKOS 40, 357–368 (1983). 48. Herms, D. A. & Mattson, W. J. The dilemma of plants: to grow or defend. Q. Rev. Biol. 67, 283–335 (1992). 49. Lambers, H., Chapin, F. S. & Pons, T. L. In Plant Physiological ecology (eds Lambers, H., Chapin III, F. & Pons, T.) 375–402 (Springer, 2008). 50. Watkinson, A. R. In Plant Ecology (ed. Crawley, M. J.) 359–400 (Blackwell Scientific Publications, 1997). 51. Barton, K. E. & Hanley, M. E. Seedling-herbivore interactions: Insights into plant defence and regeneration patterns. Ann. Bot. 112, 643–650 (2013). 52. Invers, O., Tomas, F., Of, B. & Science, M. Potencial effect of increased global CO2 availability on the depth distribution of the seagrass Posidonia oceanica (L.) Delile: A tentative assessment using a carbon balance model. Bull. Mar. Sci. 71, 1191–1198 (2002). 53. Celdran, D., Lloret, J., Verduin, J. & van Keulen, M. & Marín, A. Linking Seed Photosynthesis and Evolution of the Australian and Mediterranean Seagrass Genus Posidonia. PLoS One 10, e0130015 (2015). 54. Lunn, E. J. In Encyclopedia of life sciences. (John Wiley & Sons, 2008). 55. Ow, Y. X., Collier, C. J. & Uthicke, S. Responses of three tropical seagrass species to CO2 enrichment. Mar. Biol. 162, 1005–1017 (2015). 56. Palacios, S. L. & Zimmerman, R. C. Response of eelgrass Zostera marina to CO2 enrichment: Possible impacts of climate change and potential for remediation of coastal habitats. Mar. Ecol. Prog. Ser. 344, 1–13 (2007). 57. Balestri, E., Gobert, S., Lepoint, G. & Lardicci, C. Seed nutrient content and nutritional status of Posidonia oceanica seedlings in the northwestern Mediterranean Sea. Mar. Ecol. Prog. Ser. 388, 99–109 (2009). 58. Moles, A. T., Westoby, M., Moles, A. T., Westoby, M. & Westoby, M. Seedling survival and seed size: a synthesis of the literature. Society 92, 372–383 (2004). 59. Balestri, E. Flowering of the seagrass Posidonia oceanica in a north-western Mediterranean coastal area: temporal and spatial variations. Mar. Biol. 145, 61–68 (2004). 60. Balestri, E. & Cinelli, F. Sexual reproductive success in Posidonia oceanica. Aquat. Bot. 75, 21–32 (2003). 61. Bloom, A. J., Chapin, F. S. & Mooney, H. A. Resource limitation in plants- an economic analogy. Annu. Rev. Ecol. Syst. 363–392 (1985). 62. Hay, M. E. & Steinberg, P. D. In Herbivores: Their Interactions with Secondary Plant Metabolites (eds Rosenthal, G. A. & Berembaum, M. A.) 371–413 (Elsevier, 1992). 63. Bennett, B. Y. R. N. & Wallsgrove, R. M. Secondary metabolites in plant defence mechanisms. Tansley Rev. 72, 617–633 (1994). 64. Buchsbaum, R., Valiela, I. & Swain, T. The role of phenolic compounds and other plant constituents in feeding by Canada geese in a coastal marsh. Oecologia 63, 343–349 (1984). 65. Coley, P. D., Bryant, J. P. & Chapin, F. S. Resource availability and plant antiherbivore defense. Science 230, 895–899 (1985). 66. Invers, O., Kraemer, G. P., Pérez, M. & Romero, J. Effects of nitrogen addition on nitrogen metabolism and carbon reserves in the temperate seagrass Posidonia oceanica. J. Exp. Mar. Bio. Ecol. 303, 97–114 (2004). 67. Goecker, M. E., Heck, K. L. & Valentine, J. F. Effects of nitrogen concentrations in turtlegrass Thalassia testudinum on consumption by the bucktooth parrotfish Sparisoma radians. Mar. Ecol. Prog. Ser. 286, 239–248 (2005). 68. Tomas, F. et al. Plant genotype and nitrogen loading influence seagrass productivity, biochemistry, and plant-herbivore interactions. Ecology 92, 1807–17 (2011). 69. Celis-Plá, P. S. M. et al. Macroalgal responses to ocean acidification depend on nutrient and light levels. Front. Mar. Sci. 2, (2015). 70. Zimmerman, R. C., Kohrs, D. G., Steller, D. L. & Alberte, R. S. Impacts of CO2 Enrichment on productivity and light requirements of Eelgrass. Plant Physiol. 115, 599–607 (1997). 71. McKey, D. In Herbivores: Their Interaction with Secondary Plant Metabolites (eds Rosenthal, G. A. & Janzen, D. H.) 55–133 (Academic Press, 1979). 72. Rhoades, D. F. In Herbivores, Their Interactions with Secondary Plant Metabolites: The chemical participants (eds Rosenthal, G. & Janzen, D.) 353 (Academic Press, 1979).. Scientific Reports | 6:38017 | DOI: 10.1038/srep38017. 10.
(11) www.nature.com/scientificreports/ 73. Endara, M.-J. & Coley, P. D. The resource availability hypothesis revisited: a meta-analysis. Funct. Ecol. 25, 389–398 (2011). 74. Bezemer, T. M. & Jones, T. H. Plant-insect herbivore interactions in elevated atmospheric CO2: Quantitative analyses and guild effects. Oikos 82, 212–222 (1998). 75. Bazzaz, F. A. In Plant Resource Allocation (eds Bazzaz, F. A. & Grace, J.) 1–30 (Elsevier, 1997). 76. Luo, Y., Field, C. B. & Mooney, H. A. Predicting responses of photosynthesis and root fraction to elevated CO2: interactions among carbon, nitrogen, and growth. Plant. Cell Environ. 17, 1195–1204 (1994). 77. Yin, X. Responses of leaf nitrogen concentration and specific leaf area to atmospheric CO2 enrichment: A retrospective synthesis across 62 species. Glob. Chang. Biol. 8, 631–642 (2002). 78. Rogers, G., Milham, P., Gillings, M. & Conroy, J. Sink strength may be the key to growth and nitrogen responses in N-deficient wheat at elevated CO2. Funct. Plant Biol. 23, 253–264 (1996). 79. Alexandre, A., Silva, J., Buapet, P., Björk, M. & Santos, R. Effects of CO2 enrichment on photosynthesis, growth, and nitrogen metabolism of the seagrass Zostera noltii. Ecol. Evol. 2, 2625–2635 (2012). 80. Cruz-Rivera, E. & Hay, M. E. Can quantity replace quality? Food choice, compensatory feeding, and fitness of marine mesograzers. Ecology 81, 201–219 (2000). 81. DeLucia, E. H., Nabity, P. D., Zavala, J. A. & Berenbaum, M. R. Climate Change: Resetting Plant-Insect Interactions. Plant Physiol. 160, 1677–1685 (2012). 82. Cebrian, J. & Duarte, C. M. Patterns in leaf herbivory on seagrasses. Aquat. Biol. 60, 67–82 (1998). 83. Pierce, N. E. & Berry, A. In In the Light of Evolution: Essays from the Laboratory and Field (eds Losos, J. B., Quammen, D. & Browne, J.) 121–133 (Roberts & Co., 2011). 84. Mattson, W. J. J. Herbivory in relation to plant nitrogen content. Annu. Rev. Ecol. Syst. 11, 119–61 (1980). 85. Lincoln, D. E. The influence of plant carbon dioxide and nutrient supply on susceptibility to insect herbivores. Vegetatio 104–105, 273–280 (1993). 86. Coley, P. D. Herbivory and defensive characteristics of tree species in lowland tropical forest. Ecol. Monogr. 53, 209–234 (1983). 87. Mariani, S. & Alcoverro, T. A multiple-choice feeding-preference experiment utilising seagrasses with a natural population of herbivorous fishes. Mar. Ecol. Prog. Ser. 189, 295–299 (1999). 88. Williams, K., Percival, F., Merino, J. & Mooney, H. a. Estimation of tissue construction cost from heat of combustion and organic nitrogen content. Plant Cell Environ. 10, 725–734 (1987). 89. Cotrufo, M. F. & Ineson, P. Does elevated atmospheric CO2 concentrations affect wood decomposition? Plant Soil 224, 51–57 (2000). 90. Newman, J. A. et al. Effects of elevated CO2, nitrogen and fungal endophyte-infection on tall fescue: Growth, photosynthesis, chemical composition and digestibility. Glob. Chang. Biol. 9, 425–437 (2003). 91. Bernays, E. A. & Chapman, R. F. Host-plant selection by phytophagous insects. (Chapman & Hall, 1994). 92. Cocco, N. & Glendinning, J. I. Not all sugars are created equal: some mask aversive tastes better than others in an herbivorous insect. J. Exp. Biol. 215, 1412–1421 (2012). 93. Rodolfo-Metalpa, R., Lombardi, C., Cocito, S., Hall-Spencer, J. M. & Gambi, M. C. Effects of ocean acidification and high temperatures on the bryozoan Myriapora truncata at natural CO2 vents. Mar. Ecol. 31, 447–456 (2010). 94. Carey, N., Harianto, J. & Byrne, M. Sea urchins in a high CO2 world: partitioned effects of body-size, ocean warming and acidification on metabolic rate. J. Exp. Biol. 219, 1178–1186 (2016). 95. Brown, M. B., Edwards, M. S. & Kim, K. Y. Effects of climate change on the physiology of giant kelp, Macrocystis pyrifera, and grazing by purple urchin, Strongylocentrotus purpuratus. Algae 29, 203–215 (2014). 96. Pierrot, D., Lewis, E. & Wallace, D. W. MS Excel Program Developed for CO2 System CalculationsProgram developed for CO2 system calculations. ORNL/CDIAC-105a. (Carbon Dioxide Information Analysis Center, Oak Ridge National Laboratory, US Department of Energy, 2006). 97. Millero, F. J., Graham, T. B., Huang, F., Bustos-Serrano, H. & Pierrot, D. Dissociation constants of carbonic acid in seawater as a function of salinity and temperature. Mar. Chem. 100, 80–94 (2006). 98. Dickson, A. G. Thermodynamics of the dissociation of boric acid in synthetic seawater from 273.15 to 318.15 K. Deep Sea Res. Part A. Oceanogr. Res. Pap. 37, 755–766 (1990). 99. Beer, S. et al. Measuring photosynthetic rates in seagrasses by pulse amplitude modulated (PAM) fluorometry. Mar. Ecol. Prog. Ser. 174, 293–300 (1998). 100. Beer, S., Björk, M., Gademann, R. & Ralph, P. In Global Seagrass Research Methods (eds Short, F. & Coles, R. G.) 183–198 (Elsevier B.V., 2001). 101. Hedges, J. I. & Stern, J. H. Carbon and nitrogen determinations of carbonate-containing solids. Limnol. Oceanogr. 29, 657–663 (1984). 102. Bolser, R. C., Hay, M. E. & Lindquist, N. Chemical defenses of freshwater macrophytes against crayfish herbivory. J Chem Ecol 24:1639–16. J. Chem. Ecol. che 24, 1639–1658 (1998). 103. de los Santos, C. B. et al. Leaf-fracture properties correlated with nutritional traits in nine Australian seagrass species: implications for susceptibility to herbivory. Mar. Ecol. Prog. Ser. 458, 89–102 (2012). 104. Van Soest, P. J., Robertson, J. B. & Lewis, B. A. Methods for dietary fiber, neutral detergent fiber, and nonstarch polysaccharides in relation to animal nutrition. J. Dairy Sci. 74, 3583–3597 (1991).. Acknowledgements. E. Cerezo, E. Oliver, and D. Rita helped with set up and sample preparation. GH was supported by the Graduate Fellowship Program co-funded by the European Social Fund and the Government of the Balearic Islands (Conselleria d´Educació, Cultura i Universitats). LR was supported during this experiment by Becas Chile fellowship program from Comisión Nacional de Investigación Científica y Tecnológica de Chile (CONICYT). This study was supported by POSIPLANT (CTM2011-27377) to JT and FT, EstresX project (CTM2012-32603) and MedSeA (FP7-ENV-2010-265103) to CMD and the Ramón y Cajal Program to FT.. Author Contributions. G.H., L.R., L.B., F.T. and J.T. conceived the experiment. G.H., L.R., and L.B., conducted the experiment. A.D. conducted the isotopes analysis. F.T., J.T. and CMD contributed with reagents/material/laboratory equipment. G.H. L.R and F.T. prepared the manuscript. All authors reviewed and contributed to the manuscript.. Additional Information. Supplementary information accompanies this paper at http://www.nature.com/srep Competing financial interests: The authors declare no competing financial interests. How to cite this article: Hernán, G. et al. Seagrass (Posidonia oceanica) seedlings in a high-CO2 world: from physiology to herbivory. Sci. Rep. 6, 38017; doi: 10.1038/srep38017 (2016). Scientific Reports | 6:38017 | DOI: 10.1038/srep38017. 11.
(12) www.nature.com/scientificreports/ Publisher's note: Springer Nature remains neutral with regard to jurisdictional claims in published maps and institutional affiliations. This work is licensed under a Creative Commons Attribution 4.0 International License. The images or other third party material in this article are included in the article’s Creative Commons license, unless indicated otherwise in the credit line; if the material is not included under the Creative Commons license, users will need to obtain permission from the license holder to reproduce the material. To view a copy of this license, visit http://creativecommons.org/licenses/by/4.0/ © The Author(s) 2016. Scientific Reports | 6:38017 | DOI: 10.1038/srep38017. 12.
(13)
Figure
Documento similar
Directly brewed compost extract added to the nutrient solution improves baby leaf lettuce growth and quality (reducing the nitrate content and enhancing the content of
No significant differences were seen in leaf and root total -SH contents between the control (33Mn+0Cd) and 0Mn+0Cd treatments, whereas they increased 6 and 4.9 times in the roots
Seasonal change in (A) leaf δ 15 N values, (B) leaf nitrogen total content and (C) area-based leaf nitrogen content for TW-FI (Transfer 281. water-Full Irrigation), TW-RDI
Ozone treatments only increased leaf K concentration, did not change the total nitrogen and phosphorus extracted by plants, but decreased the total potassium extracted.. In
Relationships between plant water status and leaf structural traits with spectral indicators in Citrus species. Shaded boxes correspond to significant relationships according to
In lettuce cultivation, the increased in the concentration of the nutrient solution in the floating system increased the fresh yield and leaf mineral content of the plant 37
Overall, local plant community phylogenetic traits, together with plant species leaf traits (habit, length and C con- tent) and mycorrhizal type (AM or ECM), are major predictors
Particularly, we examined which meadow attributes (i.e., seagrass leaf area and density, cover and richness of associated algae, and biomass of leaf epiphytes) and envi- ronmental
