The effect of migration on the labor market outcomes of the sender household: a longitudinal approach using data from Nicaragua
23
0
0
Texto completo
(2)
(3) WELL-BEING AND SOCIAL POLICY VOL 2, NUM. 2, pp. 5-25. THE EFFECT OF EMIGRATION ON THE LABOR MARKET OUTCOMES OF THE SENDER HOUSEHOLD: A LONGITUDINAL APPROACH USING DATA FROM NICARAGUA Edward Funkhouser Department of Economics California State University, Long Beach efunkhou@csulb.edu. Abstract. I. n this paper, I use longitudinal data from the 1998 and 2001 Living Standard Measurement Surveys in Nicaragua to examine the impact of the emigration of household members on the household labor market integration and poverty. The main findings of the paper are that households from which an emigrant left had a reduction in members, a reduction in working members, a reduction in labor income than otherwise similar households. However, those households also had a reduction in poverty. This finding is a result of the different patterns of migration from Nicaragua to the United States and Costa Rica. Households with emigrants to Costa Rica tend to be poorer, to have emigrants that were working prior to migration, and to have the greatest relative improvements in poverty following emigration. ——— Key words: migration, remittances, labor market outcomes, poverty . Classification JEL: D7, I12, I18.. Introduction nternational migration is now viewed as the household response to the economic changes of the globalization process. There is now a growing literature that has examined the motives to emigrate and which explores the effects of emigration and remittances within a household decision.1 While it has long been recognized that international migration and remittances have important effects on households and labor markets in the sender countries, recent improvements in data collection have greatly increased the ability to study these effects. Previously, most researchers relied on cross-sectional data and limited questions on migrants and remittances. With such data,. I. 1. A good review of the motives to remit can be found in Rappaport and Docquier (2005).. 5.
(4) THE EFFECT OF EMIGRATION ON THE LABOR MARKET OUTCOMES OF THE SENDER HOUSEHOLD: A LONGITUDINAL APPROACH USING DATA FROM NICARAGUA. researchers examined the effect of emigration and remittances on household outcomes by comparing outcomes of households from which emigrants left (or that received remittances) with the outcomes of those that did not.2 The key element of this approach is the control group for the comparison or the estimate of outcomes that would have occurred without migration or remittances when characteristics that are unobserved to the researcher are important determinants of outcomes. Over the past decade, data on migration and remittances has improved in several ways that have benefited researchers. First, statistical institutes conducted surveys have included modules with more questions about migration and remittances.3 Second, more systematic collection of other data for the household allows better controls for other household characteristics. And third, there are more surveys that follow households over time.4 In this paper, I use data from both before and after emigration to determine the effects of emigration on household labor market outcomes. The innovation of the paper is a difference-indifferences approach that controls for other characteristics of the emigrant household as well as other changes that commonly affect all households. By controlling for the initial situation of the household, the estimates provide an estimate of the effect migration and remittances that is not possible with the cross-sectional approach used in previous studies. The organization of the paper is as follows. In the next section (Section 1), I discuss the pattern of emigration from Nicaragua. I then describe the data from the 1998 and 2001 Living Standard Measurement Surveys (LSMS) for Nicaragua and the basic patterns from those data. In Section 2, I present the methodological approach to determining the effects of emigration on household outcomes. Section 3 presents the results of the estimation. And Section 4 includes discussion – including a comparison of results with cross-sectional methods – and concluding remarks.. 1. Data and Summary Characteristics 1.1 Emigration from Nicaragua Emigration from Nicaragua increased substantially in the 1980s, leveled off during the 1990s, and increased again beginning in the late 1990s. Whereas most of the migration from the 1980s was to 2 One approach to this issue is to use a selection model for the presence of an emigrant to predict household characteristics without an emigrant. Adams (2005) uses this approach for Guatemala with cross-sectional data for 2000 using a selection model for the presence of remittances. The identifying variable for the first stage regression is age of the household head. He finds that the additional effect of remittances is to reduce poverty in Guatemala, especially severe poverty. He finds that remittances reduce poverty, but that households that receive remittances tend to view remittances as temporary sources of income. Many of these studies are summarized in World bank (2006). 3 See, for example, Adams and Page (2003). 4 For Mexico, the Mexican Migration Project (http://mmp.opr.princeton.edu/) has combined all of these features for a large number of sender communities. For the Philippines, Yang (2005) and Yang and Martinez (2006), use longitudinal data on households to examine the effect of exchange rate shocks (caused by the Asian financial crisis) to remittances on changes in household outcomes. They find that exchange rate induced increases in remittances lead to higher human capital formation, entrepreneurship, increased child schooling, reduced child labor, and increased hours worked in self-employment. For Central America, studies of the effects of emigration using the more recent national-level data sources are limited.. 6.
(5) WELL-BEING AND SOCIAL POLICY VOL 2, NUM. 2, pp. 5-25. the United States, there was a change towards migration to Costa Rica during the 1990s By the late 1990s, the destination for most emigrants was to Costa Rica and over ten percent of the population of Costa Rica was Nicaraguans. There are now approximately 250,000 Nicaraguans in each of the United States and Costa Rica, representing over 10 percent of the native-born population of Nicaragua. Another increase in emigration following 1998 occurred after Hurricane Mitch in October 1998.5 Most of these emigrants went to Costa Rica, which, in response to the hurricane, granted amnesty to emigrants that had entered the country legally (but did not have permanent status) prior to the hurricane.6. 1.2 Data — 1998 and 2001 LSMS The Instituto Nacional de Estadistica y Censo (INEC) and the World Bank conducted Living Standards Measurement Surveys in Nicaragua in 1998, and 2001.7 Each survey contains detailed demographic and labor market information for a national sample of households. In addition, the 2001 survey (only) includes a module with household members residing outside the country. The 1998 survey was conducted before Hurricane Mitch and, following the hurricane, a subset of the 1998 households in areas most affected by the hurricane was re-interviewed in 1999 to assess damage. The 2001 LSMS was designed to provide a longitudinal panel with the 1998 LSMS. Of the 4,209 households in the 1998 survey, 3,018 can be matched in the 2001 survey. The final sample contains 2,994 matched households. Within the households that can be matched between 1998 and 2001, there are 17,475 individuals enumerated in the 1998 LSMS.8 Of these, 12,319 can be matched directly with the line numbers for 1998 provided in the 2001 survey household roster.9 Other persons can be matched using information on age and sex. The number of persons in the 1998 who were matched to the 2001 data is shown in Appendix Table . Following the Hurricane in October/November 1998, a subset of households were reinterviewed in 1999. Many, but not all, of the questions from 1998 were repeated and additional questions on the impact of the hurricane were included. Selection for inclusion in the 1999 survey was based on residence in areas affected by the hurricane. For purposes of this paper, I use inclusion in the 1999 survey (or non-inclusion) as an instrument for impact of the hurricane. 5. In Nicaragua, approximately 3,000 people died and nearly one million people were affected. The areas most affected by the hurricane were in the north, especially Chinandega and Leon. See for example IADB (2000). 6 There are now several descriptive studies of emigrants and remittances from Nicaragua, including Funkhouser (1992, 1995), Pritchard (1999), Blanco, del Carmen, and Hernandez (2002), and the ILO (2001). Previous studies of the effects of emigration from Nicaragua and remittances on labor market outcomes have used crosssectional data. Funkhouser (1992) found that migration and remittances affect labor force participation and self-employment of remaining household members using data for Managua in 1989. And Barham and Boucher (1998) examined the impact of remittances on income inequality using a small sample of households in the Atlantic Region Funkhouser, Perez Sainz, and Soto (2003) examined the integration of Nicaraguans into the Costa Rican labor market. 7 A LSMS was also conducted in 1993. 8 These are out of the total of 23,643 individuals in the 1998 LSMS. 9 There are persons in the 2001 LSMS that are reported to have been included in the 1998 LSMS, but for which the 1998 line numbers do not match.. 7.
(6) THE EFFECT OF EMIGRATION ON THE LABOR MARKET OUTCOMES OF THE SENDER HOUSEHOLD: A LONGITUDINAL APPROACH USING DATA FROM NICARAGUA. 1.3 Emigrants in the LSMS The unique aspect of this study is the observation of emigrants before and after migration. In the 2001 data, there are 352 persons that emigrated between 1998 and 2001 and can be matched from the line numbers for 1998 provided in the emigrant file in 2001. These persons resided outside the country in 2001. In addition, there are 430 persons from the matched households that are included in the emigrant file for 2001 that emigrated prior to the 1998 LSMS and continued to reside outside the country in 2001.. Figure 1 Emigrants to Costa Rica and US. Source: Calculations from LSMS. The pattern of emigration found in the LSMS is shown in Figure 1 using weights. The increase in the proportion of emigrants to Costa Rica begins in the mid-1990s. The increase in migration after 1998 is also quite striking. There is not strong evidence that areas most affected by the hurricane were associated with larger out-migrations following 1998, at least at the level of the Department. In Appendix Table 2, I report the proportion of households that were included in the 1999 survey, the proportion of the population that migrated prior to 1998, and the proportion of the population of the Department that emigrated between 1998 and 2001. Overall, the department most affected by the hurricane had migration rates similar to other departments before and after 1998.. 8.
(7) WELL-BEING AND SOCIAL POLICY VOL 2, NUM. 2, pp. 5-25. 1.4 Summary information Summary information on individuals using the LSMS data is provided in Tables 1 through 3. In Table 1, descriptive information about emigrants and non-migrants are shown for the different cuts of the data. In Table 2, household means are shown. And in Table 3, the labor market insertion of households according to migration status is presented. Table 1 Characteristics of Households by Reporting of Emigrant Outside Nicaragua in 2001. 9.
(8) THE EFFECT OF EMIGRATION ON THE LABOR MARKET OUTCOMES OF THE SENDER HOUSEHOLD: A LONGITUDINAL APPROACH USING DATA FROM NICARAGUA. 1.4.1 Characteristics of individuals by migration status In Table 1, summary characteristics calculated from the matched sample are shown for emigrants and non-emigrants. In the first three columns (Columns 1 to 3), the characteristics of persons in households without emigrants, non-emigrants in households with emigrants that left between 1998 and 2001, and emigrants are shown. In Column (4), characteristics from a restricted list of variables for emigrants that left prior to 1998 are calculated from the 2001 data (since information on these emigrants are not available in the 1998 data). And in the last four columns (Columns 5 to 9) information is calculated separately for households from which emigrants went to the U.S. and households from which emigrants went to Costa Rica). Emigrants are more likely to be male, more likely to reside in urban areas, and have more years of education, on average, than non-emigrants. Recent emigrants also tend to be younger than the non-migrant population. These patterns are similar even when comparing within the same household. Comparing emigrants and non-emigrations within all households with emigrants, emigrants are more likely to have been working, but to have lower average income in primary occupation, prior to migration than other household members. This finding, though, masks very different patterns for emigrants to the United States and to Costa Rica. Emigrants to the United States are less likely to have been working than other members of the same household and to come from households in which other members are less likely to be working than persons in households without emigrants. Moreover, though average income of non-emigrant members in households with subsequent emigrants was much higher than that in other households, emigrants themselves had incomes similar to the population average. In contrast, emigrants to Costa Rica were more likely to be working than other household members prior to migration and employment rates in those households are similar to those in households without emigrants (Column 1). Average income of all household members in households with emigrants to Costa Rica is lower than that in non-migrant population and emigrants have, on average, lower labor incomes than other household members. Much of these differences are due to the different geographic patterns of migration. Emigrants to the U.S. are disproportionately more likely to come from urban areas and Managua. Emigrants to Costa Rica are more likely to come from rural areas , are much more likely to come from the Central region, and are very unlikely to come from Managua. 1.4.2 Household composition The effects of emigration on household composition are shown in Table 2. In the table, household characteristics are followed between 1998 and 2001 for all households (Columns 1 and 2), households without recent emigrants (Columns 3 and 4), and households from which a member emigrated between 1998 and 2001 (Columns 5 and 6). Average household size of emigrant households was larger than non-emigrant households prior to emigration by over one person. Following emigration, though, those households were smaller than households from which no one emigrated. This reduction was about equally divided between reductions in adult members and child members. Households from which there was. 10.
(9) WELL-BEING AND SOCIAL POLICY VOL 2, NUM. 2, pp. 5-25. Table 2 Characteristics of Households in Matched Sample Panel A. All Households, Matched Sample. 11.
(10) THE EFFECT OF EMIGRATION ON THE LABOR MARKET OUTCOMES OF THE SENDER HOUSEHOLD: A LONGITUDINAL APPROACH USING DATA FROM NICARAGUA. emigration between 1998 and 2001 were more likely to have been female headed prior to emigration and this difference increased slightly following migration. Both households with emigrants and households without emigrants had about 2 members working before and after migration. The change in labor income, though, is very different. In households without emigrants, nominal labor income increased between 1998 and 2001. In households with emigrants, labor income was higher than that of non-emigrants in 1998, remained constant between 1998 and 2001, and was lower than that in households without emigrants in 2001. Mean household consumption is measured in cordobas and increased between 1998 and 2001. The increase was proportionally similar in households with emigrants and households without emigrants. But because households with emigrants started out with a higher level of consumption, the absolute magnitude of the increase in consumption was higher in households with emigrants. Overall, poverty declined in Nicaragua between 1998 and 2001. In the matched households, the reduction was from 38.1 percent to 34.6 percent of households. Despite the reduction in labor. Table 2 Panel B. Households with Emigrants, Matched Sample. 12.
(11) WELL-BEING AND SOCIAL POLICY VOL 2, NUM. 2, pp. 5-25. income for households with an emigrant between 1998 and 2001, poverty decreased in those households with an emigrant, falling to 22.9 percent in 2001.10 In Panel B of Table 2, I present the main labor market indicators separately for households with emigrants to the United States and households with emigrants to Costa Rica. The higher consumption with similar poverty rates for households with emigrants in 1998 is explained by the differences in poverty rates between households with emigrants to the United States and those with emigrants to Costa Rica. Households with emigrants to the United States had poverty rates of 9.9 percent in 1998 and 6.2 percent in 2001. Households with emigrants to Costa Rica had poverty rates of 52.2 percent in 1998 and 30.8 percent in 2001. 1.4.3 Labor market insertion of households In Table 3, I explore in more detail the labor market insertion of households with emigrants and those without emigrants. To do so, I identify those individuals that can be matched between 1998 and 2001 and those that cannot. For each individual that can be matched, I identify employment state in the two years – working in both 1998 and 2001, working in 1998 and not working in 2001, not working in 1998 and working in 2001, and not working in both years. For those that cannot be matched, I identify whether the individual was working or not in the survey year that was observed. The final group are the emigrants that left between 1998 and 2001 that are identified in the 1998 data, also according to working status.11 For each type of individual, the average contribution to household labor market income is shown in the table. Total household labor income, shown in the top row, is the same as in Table 2 and again shows that households from which emigrants leave had higher income prior to emigration. The smaller gain in income between 1998 and 2001 in households with emigrants is due three sources. First, there is a smaller increase in income for those members who worked in both 1998 and 2001. Second, there is more income from unmatched individuals in 1998 than in 2001. And third, the labor income from the emigrants is not included in 2001. The final two columns, though, show the different pattern in the households in which emigrants were working prior to migration, which again is related to the destination of the emigrant. In those households, household income was about equal to those households in which there was no subsequent emigrant. The income of the non-emigrants in 1998 was lower than in other households and, even though there was a gain in income between 1998 and 2001 for matched nonemigrants, income in 2001 of those persons continued to be lower. More importantly, the working emigrant in those households contributed about half of total labor income.. 10 The poverty definitions are those made by INEC and the World Bank. These definitions compare the household consumption aggregate, poverty to the income required to consume 2,187 calories on average. For 1998, the poverty line was 354 cordobas per person per month in 1998. In 2001, it was 430 cordobas per person per month. See INEC (2001,2002). 11 The household members in 1998 are the household members that are matched in both years, the unmatched members that are observed working or not working in 1998, and the emigrants (that were observed in 1998 prior to migration). The household members in 2001 are the household members that are matched and the unmatched members that are observed working or not working in 2001.. 13.
(12) THE EFFECT OF EMIGRATION ON THE LABOR MARKET OUTCOMES OF THE SENDER HOUSEHOLD: A LONGITUDINAL APPROACH USING DATA FROM NICARAGUA. Table 3 Contributions to Household Labor Income. Note: Household totals for each year include only persons who were observed in that year. Persons in the matched sample are observed in both years. Persons in the unmatched sample are observed only in one year. And emigrants were observed in the household in 1998, but not 2001.. 14.
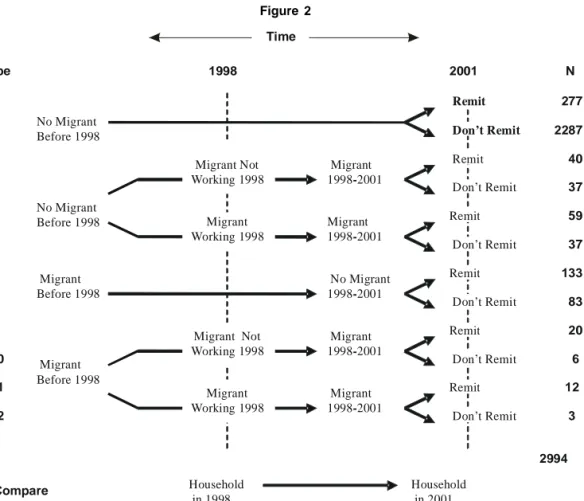
(13) WELL-BEING AND SOCIAL POLICY VOL 2, NUM. 2, pp. 5-25. 1.4.4 Summary With these data, household characteristics prior to migration can be observed. Households from which emigrants subsequently migrated are of two types. First are households with emigrants that went to the United States. These households have higher income, higher average education, and the emigrant was less likely to be working or contribute a significant part of labor income of the household. Second are households with emigrants that went to Costa Rica. These households are more likely to be rural and out of the capital and to have other characteristics similar to the general Nicaraguan population. Emigrants from these households were more likely to be working and to contribute a significant part of household income prior to migration.. 2. Empirical Approach The main innovation of this paper is the use of longitudinal data to examine the situation of households before and after migration. There are four characteristics that will be useful to classify Figure 2 Time Type. 1998. 2001. 1 2. Remit No Migrant Before 1998. 3 4 5. No Migrant Before 1998. 6 7 8. 11. 2287. Migrant 1998-2001. Remit. 40. Don’t Remit. 37. Migrant Working 1998. Migrant 1998-2001. Remit. 59. Don’t Remit. 37. No Migrant 1998-2001. Remit Don’t Remit. 83. Migrant Not Working 1998. Migrant 1998-2001. Remit. 20. Migrant Working 1998. Migrant 1998-2001. Remit. 12. Don’t Remit. 3. Migrant Before 1998. 12. 277. Migrant Not Working 1998. Migrant Before 1998. 9 10. Don’t Remit. N. 133. 6. Don’t Remit. 2994 Compare. Household in 1998. Household in 2001. 15.
(14) THE EFFECT OF EMIGRATION ON THE LABOR MARKET OUTCOMES OF THE SENDER HOUSEHOLD: A LONGITUDINAL APPROACH USING DATA FROM NICARAGUA. households – whether there was a migrant prior to 1998, whether there was a migrant between 1998 and 2001, whether the 1998-2001 migrant was working in the household in 1998, and whether the household received remittances in 2001. Based on these four characteristics, twelve household types are identified in Figure 2 (along with the number of households in the sample). The empirical approach of the paper is to observe changes in outcomes between 1998 and 2001 across different types of households, and identify the effect of emigration and remittances from the difference in change between households with emigration and without (or households with remittances and without). For example, the combined effect of a migrant leaving a household between 1998 and 2001 for households that did not have a previous migrant is the comparison of types 3 through 7 with types 1 and 2. And the separate effect of remittances among those households that had 1998-2001 migrants is the comparison of types 3 and 5 with types 4 and 6. One approach is to simply look at differences in outcomes and calculate the difference in difference across the various groups. However, there are other factors besides emigration or remittances, that likely affect these differences. If these variables are not randomly distributed across the 12 groups defined above, any differential impact of them on the outcomes of interest will bias the estimates of the effect of emigration or remittances. As a result, each comparison will be of the form (Yi,2001 - Yi,1998 )= α + Xi,1998 β + Ti γ + ε it. (1). where Yit is outcome Y for household or individual i at time t; Xit is a vector of characteristics of household or individual i at time t; Ti is a vector of dummy variables for household type for household or individual i; and ε it is a random error. The coefficients of interest, γ i, measure the difference in difference effect of being in each household type, controlling for other characteristics, relative to the household type that is omitted (household type 2). Household outcomes include household size, number of persons working in the household, labor income, household consumption, and poverty status. Control variables include number of household members in 1998 (except column 0), age of household head in 1998, years of education of household head in 1998, and female headed in 1998. Individual outcomes include whether the individual was matched between 1998 and 2001 (as a measure of stability), whether the individual was working, the labor income of the individual, and whether the individual was working in the same job in 2001 as in 1998. Controls for the individuallevel outcomes include region dummy variables, a rural dummy variable, age in 1998, age squared, years of education in 1998, and a female dummy. In the difference-in-difference model, the independent variables measured in levels (not changes) control for different rates of change over time by the included characteristic. For example, including year of education for the labor income outcome controls for changes in the returns to education over time and the possibility that members of household with emigrants are disproportionately positively or negatively affected by those changes. Similarly, geographic controls net out differences over time that are systematic across region.. 16.
(15) WELL-BEING AND SOCIAL POLICY VOL 2, NUM. 2, pp. 5-25. 3. Results In the following sections, I present the results of the estimation of Equation (1) using four definitions of household type. • Households with recent emigrants versus other households • Households with recent emigrants to Costa Rica, households with recent emigrants to the United States, and other households • Households with migrants only before 1998, households with both migrants before 1998 and recent migrants, households with only recent migrants, households without migrants that receive remittances, and households with migrants that receive remittances (additive with presence of migrants variables) • All household types shown in Figure 2 In addition, for comparison, I estimate the cross-sectional estimates that are similar to the method used in other studies. Each of these regressions examines changes between 1998 and 2001. The change for the omitted group is used to control for other factors that changed during those years. It should be kept in mind that even though all 2,904 households (and the individuals in these households) are used in the regressions, the estimates of the coefficients of interest are imprecise because of the small number of households with emigrant members.. 3.1 Household outcomes In Table 4, the effects of recent migrants on household outcomes are shown for household size, number of adult household members, number of working members, the logarithm of household labor income, the logarithm of household consumption, and whether the household is in poverty. For each variable, the dependent variable is the difference between the 2001 value and the 1998 value. The entries in the table are the estimated coefficients on the household type variables only. With households with no recent emigrants as the omitted group, the entries are the difference in difference estimate for households with recent migrants. Regression 1 (in the first row) is the result from a cross-sectional regression similar to those employed in other studies (though 2001 outcomes are regressed against 1998 characteristics to be comparable with the other rows). Regressions 2 and 3 present the difference-in-difference results comparing households with recent emigrants with households without recent emigrants – without controls in Regression 2 and with controls in Regression 3. Regression 4 separates the effects for households with recent emigrants to Costa Rica and households with recent emigrants to the United States. And Regression 5 creates separate categories according to the presence of migrants that emigrated before and after 1998 and the receipt of remittances in 2001. In each regression, the comparison group is households that did not have migrants (and remittances in Regression 5). Household composition is affected by emigration. But though, households with emigrants decreased in size by 1.655 members (Column 2), about one-third of this would have happened because of the demographic composition of the household prior to emigration (Column 3). Of this. 17.
(16) THE EFFECT OF EMIGRATION ON THE LABOR MARKET OUTCOMES OF THE SENDER HOUSEHOLD: A LONGITUDINAL APPROACH USING DATA FROM NICARAGUA Table 4 Household Outcomes. Note: Each entry in Regression (0) to (3) is the coefficient and standard error from a separate regression. Each pair of coefficients in the rows for Regression (4) (within a column) are from a separate regression. Each set of coefficients in the rows for Regression (5) (within a column) are from a separate regression. Geographic controls include department dummy variables and rural dummy variable. Household controls include number of household members in 1998 (except column 0), age of household head in 1998, years of education of household head in 1998, and female headed in 1998. N for all regressions in Columns (1)-(3) and (5)-(6) is 2,994. N for Column (4) is 2406. N for Column (7) is 2070.. 18.
(17) WELL-BEING AND SOCIAL POLICY VOL 2, NUM. 2, pp. 5-25. one-third, most is due to the smaller growth in the number of child members in households that have emigrants compared to those that did not (not shown in the table). These patterns are similar for households with emigrants in Costa Rica and the United States, with the relative reduction in adults being slightly larger for migration to the United States, and the relative reduction in children being slightly larger for migration to Costa Rica. This is consistent with migration to Costa Rica coming from younger households. The comparison with the cross-section findings in Column (1) that show little difference in the size of households according to the presence of emigrants after controls is instructive. In fact, this finding is about right – households with emigrants started out larger than other households and, after emigration, decreased in size to be comparable to other households. The final rows in Regression 5 indicate that it is only households that had migrants that have significantly different change in household size between 1998 and 2001. Remittances have little effect on household size, whether or not a migrant had left the household. The number of working members in households decreased between 1998 and 2001 in households from which there was an emigrant relative to households from which there was not an emigrant, though the magnitude of this change is small (about one fourth of a worker in Regression 3). The magnitude is larger (.38 worker) for migration to Costa Rica, though the difference is statistically insignificant. Again, while the cross-sectional results show the post-migration similarity in the number of working household members, Regression 1 does not reveal the decline in working household members that follows emigration of a member. The main finding is that emigration of a household member is associated with a statistically significant and large fall in household labor income for migration to Costa Rica. and a change that is not statistically significant for households with emigrants to the United States. The separation into households according to migration and remittance status indicates both that the source of the fall in labor income is the loss of recent emigrants and that non-migrant households with remittances have lower labor income than other households. In this case, the cross-sectional estimate underestimates the effect of emigration on household labor income. There is a statistically significant reduction in the poverty rate of 8.8 percentage points for households with recent emigrants compared to households without emigrants between 1998 and 2001. All of this difference derives from the reduction in the poverty rate of 14.1 percentage points for households with emigrants that went to Costa Rica (Regression 3) and households with only recent emigrants (Regression 5). In the estimation of the effect of emigration on poverty, the crosssectional estimates are very similar to the longitudinal ones. The estimates with household types by migration and remittance status are shown in Table 5. Each column in the table reports the results of one regression, with entry in the table being the regression coefficient on a dummy variable for household type. The same control variables from Table 4 are used in each regression. The household types are those shown in Figure 2. There are three main findings from this table. First, household composition and household labor market outcomes are mainly associated with households that had only a recent migrant (types 3,4, 5, 6). In these households, the number of members declines, and (with the exception of type 3 – migrant not working, receive remittances) labor income falls. Second, households from which a working emigrant left (types 5,6, 11, and 12) look different from households with emigrants that did not work prior to migration. (types 3,4, 9,10). Not. 19.
(18) THE EFFECT OF EMIGRATION ON THE LABOR MARKET OUTCOMES OF THE SENDER HOUSEHOLD: A LONGITUDINAL APPROACH USING DATA FROM NICARAGUA. surprisingly, in those households, the reduction in household members is mainly adults, there is larger reduction in working members, and labor income falls more dramatically. What is interesting, though, is that these effects are much stronger for households that only had a recent migrant (groups 5 and 6). Third, the receipt of remittances has little effect on household composition, but does influence the working status of members and the labor income of households. The statistically significant example of this is the comparison of groups 5 and 6, in which the change in labor income is lower in households that receive remittances. Moreover, the receipt of remittances does have an effect on consumption and poverty for households with recent emigrants. Table 5 Differences in Outcomes by Household Type Household Members. Adult Members. Working Members. Ln Labor Income. Ln Cons.. Poverty. NM,Rem. -.025 (.143). .006 (.100). .021 (.113). -.153 (.079). .077 (.040). -.043 (.038). NM98,MNW, Rem. -.862 (.307). -.335 (.268). .526 (.366). .195 (.184). .066 (.098). -.052 (.060). NM98,MNW, NRem. -.664 (.301). -.266 (.348). .091 (.322). -.292 (.162). .048 (.095). -.095 (.047). NM98,MW, Rem. -1.838 (.349). -1.650 (.217). -.929 (.211). -.713 (.173). -.086 (.066). -.233 (.075). NM98,MW, NRem. -1.520 (.256). -1.174 (.240). -.974 (.268). -.490 (.147). -.236 (.099). -.097 (.100). M98,NM, Rem. .109 (.197). -.133 (.145). -.212 (.153). -.030 (.147). .054 (.053). -.138 (.070). M98,NM, NRem. -.192 (.231). -.071 (.156). -.025 (.297). -.074 (.150). .016 (.060). -.023 (.036). M98,MNW, Rem. -1.013 (.432). -1.114 (.400). .590 (.430). -.003 (.337). -.115 (.102). .045 (.061). M98,MNW, NRem. .392 (.729). .774 (.470). -.036 (.414). -.563 (.184). .323 (.180). -.299 (.215). M98,MW, Rem. -.094 (.362). .263 (.276). -.036 (.414). -.430 (.370). .270 (.176). .125 (.209). M98,MW, NRem. -1.481 (.380). -2.231 (.204). .400 (.520). .435 (.670). .150 (.103). -.318 (.258). 2,904. 2,334. 2,904. 2,904. N. 2,904. 2,904. Key: M98 – Migrant Before 1998, NM98 – No Migrant Before 1998, NM – No Migrant After 1998, MNW – Migrant After 1998 that did not work in 1998, MW – Migrant After 1998 that did work in 1998, Rem – Household Received Remittances in 2001, NRem – Household Did Not Receive Remittances in 2001.. 20.
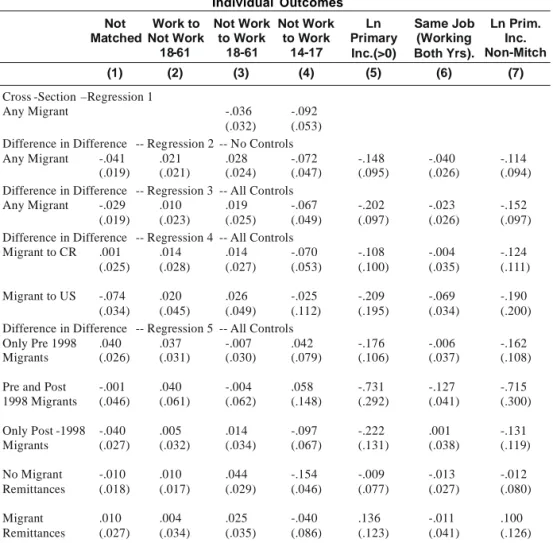
(19) WELL-BEING AND SOCIAL POLICY VOL 2, NUM. 2, pp. 5-25. 3.2 Individual outcomes I next turn to the labor market outcomes of non-migrant household members in Table 6. Five outcomes are included – whether the household member could be matched between 1998 and 2001, whether the member changed status from working to not working, whether the member changed status from not working to working, the change in the logarithm of income in primary occupation (only for those working in both years), whether the member had the same job between Table 6 Individual Outcomes Not Work to Not Work Not Work Matched Not Work to Work to Work 14-17 18-61 18-61 (1). (2). (3). (4). Ln Primary Inc.(>0). Same Job Ln Prim. (Working Inc. Both Yrs). Non-Mitch. (5). (6). (7). -.148 (.095). -.040 (.026). -.114 (.094). -.202 (.097). -.023 (.026). -.152 (.097). -.108 (.100). -.004 (.035). -.124 (.111). -.209 (.195). -.069 (.034). -.190 (.200). -.176 (.106). -.006 (.037). -.162 (.108). Cross -Section –Regression 1 Any Migrant. -.036 -.092 (.032) (.053) Difference in Difference -- Regression 2 -- No Controls -.041 .021 .028 -.072 Any Migrant (.019) (.021) (.024) (.047) Difference in Difference -- Regression 3 -- All Controls Any Migrant -.029 .010 .019 -.067 (.019) (.023) (.025) (.049) Difference in Difference -- Regression 4 -- All Controls Migrant to CR .001 .014 .014 -.070 (.025) (.028) (.027) (.053) Migrant to US. -.074 .020 (.034) (.045) Difference in Difference -- Regression 5 .040 .037 Only Pre 1998 (.026) (.031) Migrants. .026 -.025 (.049) (.112) -- All Controls -.007 .042 (.030) (.079). Pre and Post 1998 Migrants. -.001 (.046). .040 (.061). -.004 (.062). .058 (.148). -.731 (.292). -.127 (.041). -.715 (.300). Only Post -1998 Migrants. -.040 (.027). .005 (.032). .014 (.034). -.097 (.067). -.222 (.131). .001 (.038). -.131 (.119). No Migrant Remittances. -.010 (.018). .010 (.017). .044 (.029). -.154 (.046). -.009 (.077). -.013 (.027). -.012 (.080). Migrant Remittances. .010 (.027). .004 (.034). .025 (.035). -.040 (.086). .136 (.123). -.011 (.041). .100 (.126). Note: Each entry in Regression (0) to (3) is the coefficient and standard error from a separate regression. Each pair of coefficients in the rows for Regression (4) (within a column) are from a separate regression. Each set of coefficients in the rows for Regression (5) (within a column) are from a separate regression. Geographic controls include department dummy variables and rural dummy variable. Individual controls include age in 1998, age squared, years of education in 1998, and a female dummy. N for all regressions in Columns (1) is 7352; in Column (2) is 4908; in Column (3) is 1259; in Column (5) is 2035; in Column (6) is 3077; and in Column (7) is 1769.. 21.
(20) THE EFFECT OF EMIGRATION ON THE LABOR MARKET OUTCOMES OF THE SENDER HOUSEHOLD: A LONGITUDINAL APPROACH USING DATA FROM NICARAGUA. the two years, and the change in self-employment status. For these comparisons, age restrictions are based on age in 1998. The organization of the table is similar to that of Table 4. Each regression is estimated separately and only the coefficients on the household type variables are included. Again, for comparison, the estimates from one cross-section are shown in the top row. Though I do not report a separate table for the different household types, as in Table 5 for household outcomes, I mention the statistically significant results from those estimations. There are four main observations on the table. First, household members in households from which someone emigrated to the United States between 1998 and 2001 are less likely to be matched between years than members of other households. Second, there is not a strong effect of emigration or remittances on the work status of adults (those aged 18 to 62 in 1998). The exception is that adults in household types 6 and 12 (households with recent working migrant that does not remit) are less likely to drop out of the labor force than other types of households. However, teenagers that entered working age between 1998 and 2001 were less likely to work if they lived in a household from which someone emigrated. And there is a statistically significant negative effect of the receipt of remittances on work status of those 14 to 17 in 1998 in households without members that had emigrated prior to 2001. The strongest effects are for household types 1 (no migrant with remittances) 5 (migrant that previously worked with remittances), and 9 (migrant not previously working with remittances). In household type 10 (migrant that had not been working, no remittances), teenagers are more likely to be working in 2001 relative to other households. Third, there is a negative effect of emigration on the earnings of non-emigrant household members that worked in both 1998 and 2001. Calculated over all emigrants, working members in households with emigrants earned 20 percentage points less than persons in households without emigrants, controlling for the characteristics of the household and individual. This pattern of change between 1998 and 2001 is similar in households with only migrants that left before 1998 and those with only migrants that left between 1998 and 2001. The effect is larger in households that had both earlier and later migrants. The strongest effects are for households types 4 (migrant not working, no remittances), 5 (migrant that previously worked with remittances), 10 (migrant that had not been working, no remittances), and 11 (migrant previously working with remittances). And fourth, members of migrant households are less likely to have been working in the same job in 2001 as they were in 1998, though this effect is only statistically significant for members of households from which a member emigrated to the United States and households with multiple migrants. The strongest effects are for household types 10 and 11, that are 16-18 percentage points less likely to be in the same job.. 3.3 Did Mitch cause both migration and different labor market outcomes? It is possible that the observed patterns are the result of Hurricane Mitch having a negative effect on both labor market outcomes and, as a result, inducing migration. The observed effect of migration on changes in household and individual labor market income would be misleading, being the result of the hurricane and not the result of migration. To examine whether this is the case, I re-estimate the effects of migration and remittances on household labor income and individual income using the sub-sample of households that was not re-interviewed in 1999. These results are reported in. 22.
(21) WELL-BEING AND SOCIAL POLICY VOL 2, NUM. 2, pp. 5-25. the final columns of Tables 4 and 6. These estimates are estimated even more imprecisely than those in the other columns. The coefficients show both that households in regions affected by Mitch experienced larger declines in household and individual income and that the basic patterns with the full sample hold with the restricted sample. The results suggest that the observed patterns are not the result of a spurious correlation between migration and labor market outcomes both caused by Hurricane Mitch. However, the finding that households most likely to be affected by Mitch had stronger labor market responses to migration suggests that migration was a response to the natural disaster for those households. Because of the small sample size, though, this result is suggestive and deserves further attention.. 4. Summary and Concluding Remark The regressions for households and individuals present a consistent story of the effects of emigration and remittances on labor market outcomes in the sender country. There are effects of emigration are on household composition, the number of workers in the household, and labor income. The contribution of the emigrant to the household prior to emigration is an important determinant of the comparison after emigration. In households in which the migrant was working, these effects are even larger. These patterns have offsetting effects on the well-being of household members that did not migrate, especially households from which working members emigrated. The value of consumption in households with emigrants to Costa Rica increased, but remained well below the average for all households. But because the number of members fell in those households, poverty declined significantly and was below the rate for all households in 2001. There are three other implications of these findings. First, labor market insertion of emigrants prior to migration and the importance of remittances after migration do not suggest that household economic urgency is the basis for migration to the United States. For emigrants to Costa Rica, though, the results are consistent with a household economic strategy. Second, the finding that households with emigrants that left prior to 1998 do not continue to improve their economic situation relative to other households suggests that the gains to migration for the sender household are short- or medium-term. And third, the finding that remittances alone have a small impact on labor market outcomes conflicts somewhat with other studies. While the finding may indicate that remittances are not captured well in the data (especially in light of consumption being greater than labor income), it may also indicate that controls for labor market insertion prior to migration found in longitudinal data are important. As a way of synthesizing these results, I consider the lifecycle of a household. Labor market outcomes are significantly affected with the departure of recent migrants. Within the first three years following emigration, labor market income falls and labor market integration of younger household members declines. These effects weaken, though, as households that have emigrants that have been absent longer than three years do not have three-year changes that are different from other households.. 23.
(22) THE EFFECT OF EMIGRATION ON THE LABOR MARKET OUTCOMES OF THE SENDER HOUSEHOLD: A LONGITUDINAL APPROACH USING DATA FROM NICARAGUA. Appendix Table 1 Results of Matching Between 1998 and 2001 Households that are Matched between Years Matching Variables. Matched Cases. Line ID in 1998 Survey Date of birth, sex, lineno Age+3, sex,HH relationship, lineno Age+2, sex, HH relationship, lineno Age+4, sex, HH relationship, lineno Date of birth, sex Age+3, sex,HH relationship Age+2, sex, HH relationship Age+4, sex, HH relationship Age+3, sex Age+2, sex Age+4, sex Sex and Line Not matched Emigrants. 12,319 22 16 230 13 47 53 95 22 39 71 16 1,165 3,020 347. Total Households. 17,475 2,994. Table 2 Migrants and Areas Affected by Hurricane Mitch Only Migrants Only Migrants Both Before Percent in Before 1998 After 1998 and After 1999 Survey N. Segovia Jinotega Madriz Esteli Chinandega Leon Matagalpa Boaco Managua Masaya Chontales Granada Carazo Rivas Rio San Juan RAAN RAAS. 3.6 2.0 3.8 5.9 8.3 13.7 7.0 6.8 9.8 6.3 9.5 12.5 15.6 19.0 6.0 2.5 11.2. 4.7 0.5 5.9 8.0 11.8 8.1 2.7 6.3 4.9 5.4 5.9 16.8 6.4 18.9 6.9 1.5 10.0. 0.8 0.5 0 0 2.3 0.7 0.7 0 1.6 0.4 3.0 4.0 0.6 4.7 1.0 0 1.1. 4.2 8.5 17.1 40.3 28.5 52.4 30.3 31.6 0 11.7 0 0 0 2.7 0 18.7 3.8. Note: The “before” rates are for all years prior to 1998; the “after” rates are for a 3-year period. Source: Calculations from LSMS.. 24.
(23) WELL-BEING AND SOCIAL POLICY VOL 2, NUM. 2, pp. 5-25. References. Adams, Richard. “Remittances, Poverty, and Investment in Guatemala.” Chapter 2 in International Migration, Remittances, and Brain Drain, edited by Ozden and Schiff. New York: World Bank and Palgrave, 2006.. Available online at: http://www.iadb.org/regions/re2/ consultative_group/backgrounder3.htm. International Labour Organization (ILO). Estudio Binacional: Situación Migratoria entre Costa Rica y Nicaragua – Análisis del Impacto Económico y Social para Ambos Países. San José: ILO, December 2001.. Adams, Richard, and John Page. “International Migration, Remittances, and Poverty in Developing Countries.” World Bank Policy Research Working Paper 3179. Washington: World Bank, December 2003.. Instituto Nacional de Estadísticas y Censos (INEC) / Mejoramiento de Encuestas de Condiciones de Vida (MECOVI). “Perfil y Características de la Pobreza 2001.” Managua: INEC, 2002.. Barham, Bradford, and Stephen Boucher. “Migration, Remittances, and Inequality: Estimating the Net Effects of Migration on Income Distribution.” Journal of Development Economics 55 (April 1998): 307-31.. Instituto Nacional de Estadísticas y Censos (INEC) / Mejoramiento de Encuestas de Condiciones de Vida (MECOVI). “Perfil y Características de la Pobreza en Nicaragua.” Managua: INEC, February 2001.. Blanco-Artola, Josefa del Carmen, and Alcibiadez Hernandez. “Nicaragua.” Chapter 6 in Informes Nacionales sobre Migración Internacional en Países de Centroamérica, edited by SIEMCA. Santiago de Chile: SIEMCA, CEPAL-OIM-BID, 2002.. Pritchard, Diana. “Nicaragua: Uso Productivo de las Remesas Familiares.” United Nations, Economic Commission on Latin America, LC/MEX/R 718. Mexico: ECLAC, 1999.. Funkhouser, Edward. “Remittances from International Migration: A Comparison of El Salvador and Nicaragua.” Review of Economics and Statistics 77, no. 1 (February 1995): 137-46.. Rappaport, Hillel, and Frederic Docquier. “The Economics of Migrant Remittances.” IZA Discussion Paper 1531. Bonn: Institute for the Study of Labor, March 2005.. Funkhouser, Edward. “Migration from Nicaragua: Some Recent Evidence.” World Development 20, no. 8 (August 1992): 1209-18.. World Bank. “Remittances, Households, and Poverty.” Chapter 5 in 2006 Global Economic Prospects. Washington D.C.: World Bank, 2006.. Funkhouser, Edward, Juan Pablo Perez-Sainz, and Carlos Sojo. “Social Exclusion of Nicaraguans in the Urban Metropolitan Area of San Jose.” In Social Exclusion: Who is In, Who is Out, and Does it Matter?, coordinated by Jere Behrman, Miguel Szekely, and Alejandro Gaviria. IADB, 2002.. Yang, Dean. “International Migration, Human Capital, and Entrepreneurship: Evidence from Philippine Migrants’ Exchange Rate Shocks.” World Bank Policy Research Working Paper Series 3578. Washington D.C.: World Bank, April 2005.. Inter-American Development Bank (IADB). “Central America after Hurricane Mitch: The Challenge of Turning a Disaster into an Opportunity.” Consultative Group for the Reconstruction and Transformation of Central America. IADB 2000.. Yang, Dean, and Claudia Martinez. “Remittances and Poverty in Migrants’ Home Areas: Evidence from the Philippines.” Chapter 3 in International Migration, Remittances, and Brain Drain, edited by Ozden and Schiff. New York: World Bank and Palgrave, 2006.. 25.
(24)
Figure

Documento similar
teriza por dos factores, que vienen a determinar la especial responsabilidad que incumbe al Tribunal de Justicia en esta materia: de un lado, la inexistencia, en el
The results obtained from a series of experiments on a real dataset show that some of the proposed methods are able to select relevant time features, which allow simple classifiers
Results obtained from experiments on a real dataset show that the contribution of time features vary considerable when assessed by different methodologies, and moreover, the accuracy
Abstract: Transepidermal water-loss (TEWL), stratum-corneum hydration (SCH), erythema, elas- ticity, pH and melanin, are parameters of the epidermal barrier function and
For our sample, we select heads of household between the ages of 18 and 60 years of age (inclusive) who participate in the labor market, and of whom we have information on wages.
While the effect of education and experience on labour market outcomes has been
Similarly other factors like the household size, the number of adult household members working or the sex of the household head are statistical significant in explaining
In this line, Model 10 shows that the negative relationship between debt arrears and SAH is over and beyond the effects of the current economic condition of the
