1
NanoUV-VIS: An Interactive Visualization
Tool for Monitoring the Evolution of Optical
Properties of Nanoparticles Throughout
Synthesis Reactions
Bryan Calderón-Jiménez1,2, Gabriel F. Sarmanho1,3, Karen E. Murphy1, Antonio R. Montoro
Bustos1, and Jose R. Vega-Baudrit4
1National Institute of Standards and Technology,
Gaithersburg, MD 20899, USA
2Costa Rican Metrology Laboratory,
San Jose, 1736-11501, Costa Rica
3National Institute of Metrology, Quality and Technology,
Duque de Caxias, Rio de Janeiro, 2679-9001, Brazil
4National Laboratory of Nanotechnology,
San Jose, 1174-1200, Costa Rica
[email protected] / [email protected] [email protected] / [email protected] [email protected]
[email protected] [email protected]
Software DOI: https://doi.org/10.18434/M3T952
Software Version: 1.0
Key words: 2D spectrum; 3D spectrum; full width at half maximum; maximum optical absorbance; nanoparticles; surface plasmon resonance peak; ultraviolet/visible spectroscopy.
Accepted: September 6, 2017
Published: September 20, 2017
https://doi.org/10.6028/jres.122.037
1.
Summary
Engineered nanoparticles (NPs) are being used for a broad array of high-technology applications, including sensing, imaging, targeted drug delivery, biodiagnostics, catalysis, optoelectronics, and film growth seeding [1, 2]. The enhanced optical, electrical, and catalytic properties of metal NPs are strongly correlated with their size, shape, and structure [3]. As such, physicochemical characterization of NPs is critically important to ensure their effective use and applicability.
In this context, ultraviolet-visible spectroscopy (UV-VIS) is one of the most widely used methods for measuring the optical properties and electronic structures of NPs [4]. UV-VIS absorption bands are related to important properties such as the diameter [5], shape [2], and polydispersion [6] of metallic and
How to cite this article: Calderón-Jiménez B, Sarmanho GF, Murphy KE, Montoro Bustos AR, Vega-Baudrit JR (2017) NanoUV-VIS: An Interactive Visualization Tool for Monitoring the Evolution of Optical Properties of Nanoparticles Throughout Synthesis Reactions.
semiconductor NPs. Thus, this analytical technique is used during NP synthesis to monitor NP formation, to assess suspension stability under different conditions and media [7, 8], and to establish the optical properties of the newly formed nanomaterials [9].
In view of the extensive use of UV-VIS for NP characterization and monitoring of NP formation during synthesis reactions, we developed NanoUV-VIS, an interactive web application designed for the analysis of multiple UV-VIS absorbance spectra measured as a function of time. Graphical visualizations of the data in two dimensions (spectrum plot, contour plot) and three dimensions (surface plot) are created by this tool. In addition, the NanoUV-VIS tool evaluates and estimates important parameters related to the absorption bands of NPs, including maximum optical absorbance, surface plasmon resonance (SPR) peak, and the full width at half maximum (FWHM) of the UV-VIS spectra. This information is available to download as a table in the software, as well as in the form of interactive plots, where the scientist can compare the behavior of these parameters in order to better interpret the outcomes of the experiment.
Though NanoUV-VIS was designed to visualize NP synthesis, this tool can be used for a wide range of other applications in nanotechnology and nanoscience, such as the assessment of suspension stability, the investigation of the influence of coating agents on the NP optical properties, and the monitoring of seed-mediated NP synthesis, among others. Moreover, this data analysis and visualization tool can be extended to other fields beyond nanotechnology in which spectrochemical analysis by UV-VIS plays an important role.
2.
Software Specifications
The framework behind the NanoUV-VIS tool is Shiny [10], an open-source package that enables the creation of web-based applications using R Statistical Software [11].1 Shiny allows for implementation of
the numerous capabilities of R, enabling R programmers to develop and deploy web applications without requiring knowledge of HTML, CSS, or JavaScript.
NanoUV-VIS takes advantage of two R packages for an interactive visualization: (i) Plotly [12] was used to provide flexible and interactive graphics to the users; and (ii) DT [13] provides an R interface to the JavaScript library data tables, which makes possible to interact with the tables (i.e., to search the table for a specific value).
The software specifications are shown in Table 1 below:
Table 1. Software specifications.
NIST Operating Unit(s) Inorganic Measurement Science Group, Chemical Sciences Division, MML Category Visualization software
Targeted Users Nanoscience, spectrochemistry, chemical and materials scientists Operating Systems Microsoft, Linux, MacOS
Programming Language R
Inputs/Outputs
Input: data in CSV format
Output: spectrum plots, contour plots, 3D scatter plots, data table listing measured maximum optical absorbance, SPR peak and FWHM.
Documentation Source code: https://github.com/usnistgov/NanoUV-VIS
Accessibility N/A
Disclaimer https://www.nist.gov/director/licensing
3.
Experimental Section
To demonstrate applicability, a silver nanoparticle (AgNP) synthesis experiment was conducted using UV-VIS to monitor the progression of the synthesis process. AgNPs were synthesized by reduction of silver nitrate (AgNO3) with sodium borohydride (NaBH4) using a modified version of the procedure described in Ref. [14]. AgNO3 (> 99.9999 %) and NaBH4 (> 98 %) were purchased from the Aldrich Chemical Company. Deionized water (resistivity of 18 MΩ·cm at 25 °C) was used to prepare all the solutions.
1 Certain trade names, commercial equipment, instruments, or materials are identified in this paper to foster understanding. Such
Briefly, 10 g of 1.0 mmol L−1AgNO3 solution was added with a constant flow of 0.6743 g min−1to 30 g of 2.0 mmol L−1NaBH4 contained in a reaction vessel that was chilled over an ice bath. The reaction mixture was stirred at 700 rpm (11.67 Hz) using a magnetic stir plate. After all the AgNO3 had been added, the stirring was stopped.
The reaction was monitored for 140 min from the point at which AgNO3 was first added, taking
measurements at intervals of 4 min. The monitoring system consisted of a reaction vessel and one peristaltic pump that recirculated and introduced the sample into the UV-VIS spectrophotometer (Perkin Elmer, Lambda 900). A flow-through cell (Helma® absorption cuvette) with a path length of 2 mm and a chamber volume of 124 μL was used for this purpose.
The following spectrophotometer parameters (Table 2) were used to acquire the spectra:
Table 2. Instrumental parameters.
Instrument parameters
Lamps D2 and tungsten
UV-VIS slit width 2 nm Photomultiplier gain 30
Photomultiplier response 0.2 s Scanning parameters
Range 800 nm to 250 nm
Data interval 1.00 nm
Scan speed 266.75 nm min−1
4.
Data Visualization
The first step in the use of NanoUV-VIS is introducing the spectra data in CSV format. Two possible options are displayed that depend on the number of data files:
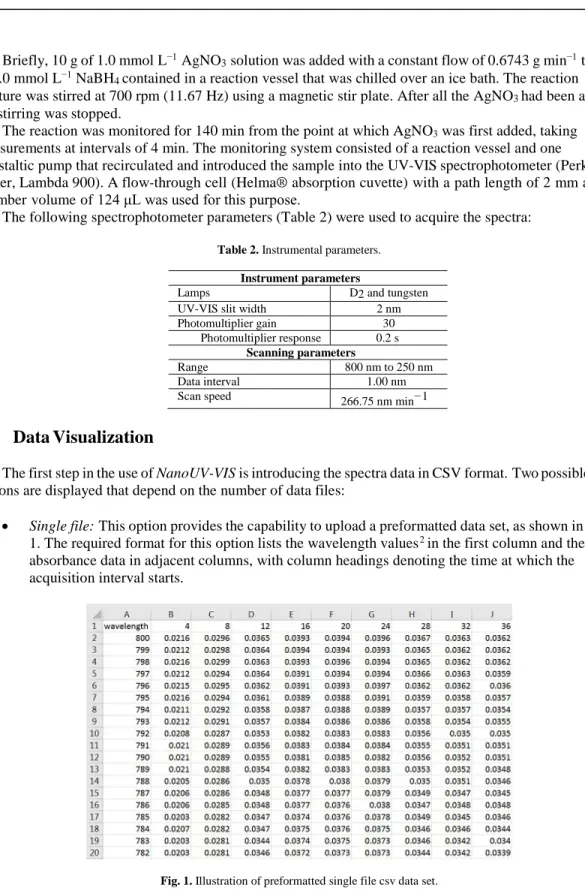
• Single file: This option provides the capability to upload a preformatted data set, as shown in Fig. 1. The required format for this option lists the wavelength values2in the first column and the
absorbance data in adjacent columns, with column headings denoting the time at which the acquisition interval starts.
Fig. 1. Illustration of preformatted single file csv data set.
• Multiple files: This option provides the capability to upload multiple3CSV files in the same
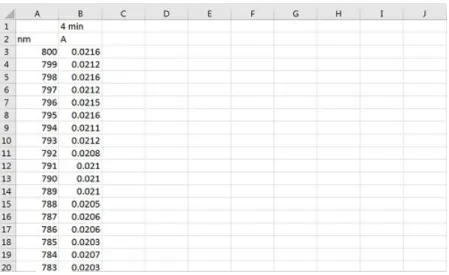
format, as shown in Fig. 2. It has been designed for instruments that generate or export data as an independent file, representing the measured spectrum at a specific scanning start time. This tool uses the time label (second column in Fig. 2) to generate the graphical visualization. Therefore, it is crucial to enter this time label in the CSV files for a correct running and visualization of the tool.4
Fig. 2. Illustration of an independent file exported by the instrument.
Once data are correctly uploaded, the resulting plots can be viewed and explored using the visualization panel.
Specifically, NanoUV-VIS provides a wide array of data visualization options:
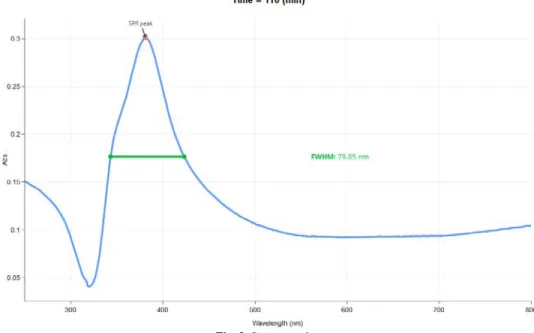
• Individual or mixed spectrum plots of all UV-VIS data, with the ability to inspect the main properties of each curve and compare them with others (Fig. 3). This representation offers the experimenter the ability to obtain the SPR peak and FWHM, information that can be associated with the particle size of the NPs and the degree of polydispersion and/or aggregation of the NPs. Also, the spectrum plot provides easy visualization and exploration of the spectra, allowing for the selection of specific UV-VIS regions, the capability to zoom in on specific regions, and the ability to download the displayed spectra in a variety of graphical formats, including png and html.
3 This option also generates a joint table by merging all CSV files, which can be saved and used for future visualizations with the
single file option.
Fig. 3. Spectrum plot.
• A surface plot, which enables a simultaneous visualization of all the acquired spectra, producing a three-dimensional (3D) surface plot with unlimited degree of movement (Fig. 4). This plot enables the experimenter to study and gain better understanding of the evolution of the NP synthesis reaction. It is possible to use the surface plot to identify significant changes in the maximum absorbance, SPR peak, and FWHM that occur during the synthesis process.
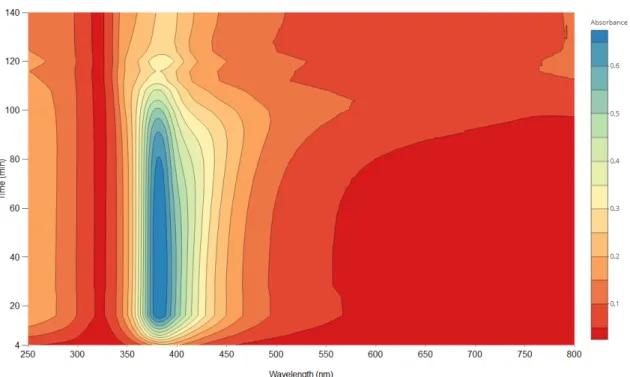
• A contour plot, which is another combined way to visualize all the acquired spectra in a two-dimensional (2D) graph, where the lines or contours represent the third dimension/variable, e.g., absorbance (Fig. 5). In this contour plot, time is plotted as the ordinate, and wavelength is plotted as the abscissa, with the contour lines showing the amount of measured absorbance. The intensity of the absorbance is represented by a color scale, ranging from red for the lower measured absorbance to blue for the higher. Also, this plot allows the experimenter to immediately observe the evolution of the formation of NPs during the synthesis reaction as well as the formation of aggregates associated with the increase of measured absorbance in the region from 500 nm to 800 nm. Thus, this contour plot provides a visual assessment of NP stability throughout the synthesis reaction.
Fig. 5. Contour plot.
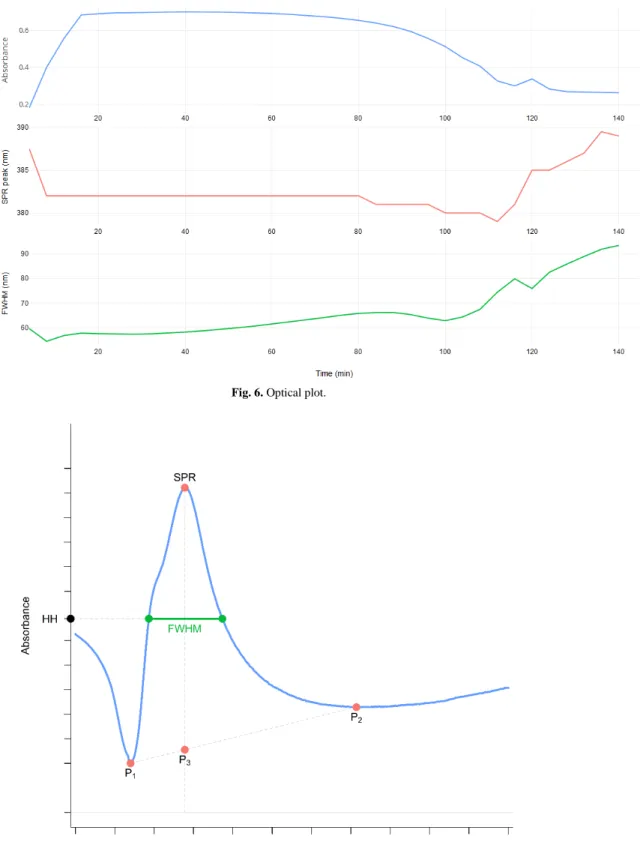
For better visualization and understanding of the spectra, NanoUV-VIS displays a summary of the different variables determined in the analysis (maximum optical absorbance, SPR peak, and FWHM). Figure 6 shows the graphical output of the summarized data, enabling simultaneous comparison of the data.
Fig. 6. Optical plot.
Finally, Fig. 8 illustrates the mix spectrum plot designed to select, compare, and overlap multiple spectra taken during the synthesis process, allowing the experimenter to compare the spectra in different periods of time.
Fig. 8. Mix spectrum plot.
5.
Application of the Visualization Tool to Monitor the Synthesis of AgNPs
NanoUV-Vis is a versatile tool that can be widely used to understand and monitor the evolution of NP synthesis reactions. In this study, the synthesis of AgNPs was chosen to exemplify the applicability of the tool to monitor and visualize the synthesis of NPs. As can be readily observed in the surface plot (Fig. 4), there is a period of rapid formation (first 16 min) of a high particle number concentration of AgNPs, as indicated by the rapid and pronounced increase in absorbance. This observed rapid formation is consistent with established theories and mechanisms of the nucleation and growth of NPs in solution to produce thermodynamically stable NPs [15].
Subsequently, the synthesis is expected to reach a metastable period [16]. Figures 5 and 6 (blue line) show that the absorbance remains stable for approximately 55 min, indicating that the particle number concentration was constant for this period of time. An observed SPR peak wavelength of ≈ 382 nm (Fig. 6, red line) suggests the formation of small NPs (≤ 10 nm) [17]. The fact that the SPR peak remains constant indicates that the NP size does not change during this period of time.
It is important to note that this synthesis was performed without any steric or electrostatic stabilizing agent. Thus, the stabilization of the AgNPs comes from the borohydride (BH4−) that remained in excess in
the reaction medium. As can be seen in Fig. 5 and Fig. 6, after the metastable period (t > 60 min), there is a decrease in the maximum absorption of the UV-VIS spectra, indicating a decrease in the AgNP number concentration. This may signal that the remaining BH4− has partially converted to borate B(OH)4−, due to
the high tendency of BH4− to be hydrolyzed in water [18]. This aspect would promote the coalescence or
increase in the wavelengths of the SPR peak and FWHM (Figs. 6 and 8), indicating an increase in the polydispersion and the size of the AgNP population.
The contour plot (Fig. 5) allows the experimenter to easily identify the aggregation of AgNPs during the final stage of the synthesis, as indicated by the large increase in the measured absorbance in the region from 500 nm to 800 nm. This aggregation occurs after the complete conversion of the BH4− to B(OH)4−. In
this case, the lack of both a strong oxidizing agent and a stabilizing agent in the medium would contribute to surface oxidation [18] and consequently would promote the aggregation of the NPs.
6.
Impact
As illustrated in this article, NanoUV-VIS provides new possibilities for convenient data visualization that leads to better understanding of the evolution of NP synthesis processes. In addition, this tool can be used to study the stability of NPs dispersions, including aggregation and destabilization processes. Finally, the applicability and impact of this tool are not limited to UV-VIS spectrochemical data acquisition. The functionality can additionally be expanded by incorporating new R functions and modules, providing potential uses of this tool in other analytical techniques such as fluorescence spectroscopy, dynamic light scattering, and hyphenated systems (e.g., asymmetric flow field-flow fractionation and size exclusion chromatography on-line coupled to UV-VIS), among others.
Acknowledgments
The authors would like to acknowledge Thomas Lafarge (NIST Statistical Engineering Division) for his valuable technical suggestions in developing this application. We also want to acknowledge Melody Smith (NIST Material Measurement Laboratory) for providing the spectrophotometer facilities to perform the experiment.
7.
References
[1] Caldero´n-Jime´nez B, Johnson ME, Montoro Bustos AR, Murphy KE, Winchester MR, Vega Baudrit JR (2017) Silver nanoparticles: Technological advances, societal impacts, and metrological challenges. Frontiers in Chemistry 5:6. https://doi.org/10.3389/fchem.2017.00006.
[2] Attia YA, Buceta D, Requejo FG, Giovanetti LJ, Lo´pez-Quintela MA (2015) Photostability of gold nanoparticles with different shapes: The role of Ag clusters. Nanoscale 7(26):11273–11279. https://doi.org/10.1039/C5NR01887K.
[3] Sun Y, Xia Y (2002) Shape-controlled synthesis of gold and silver nanoparticles. Science 298(5601):2176–2179. https://doi.org/10.1126/science.1077229.
[4] Smitha S, Nissamudeen K, Philip D, Gopchandran K (2008) Studies on surface plasmon resonance and photoluminescence of silver nanoparticles. Spectrochimica Acta Part A: Molecular and Biomolecular Spectroscopy 71(1):186–190.
https://doi.org/10.1016/j.saa.2007.12.002.
[5] Haiss W, Thanh NT, Aveyard J, Fernig DG (2007) Determination of size and concentration of gold nanoparticles from UV-VIS spectra. Analytical Chemistry 79(11):4215–4221. https://doi.org/10.1021/ac0702084.
[6] Agnihotri S, Mukherji S, Mukherji S (2014) Size-controlled silver nanoparticles synthesized over the range 5–100 nm using the same protocol and their antibacterial efficacy. RSC Advances 4(8):3974–3983. https://doi.org/10.1039/C3RA44507K.
[7] Pinto VV, Ferreira, MJ, Silva R, Santos HA, Silva F, Pereira CM (2010) Long time effect on the stability of silver nanoparticles in aqueous medium: Effect of the synthesis and storage conditions. Colloids and Surfaces A: Physicochemical and Engineering Aspects 364(1):19–25. https://doi.org/10.1016/j.colsurfa.2010.04.015.
[8] Gorham JM, Rohlfing AB, Lippa KA, MacCuspie RI, Hemmati A, Holbrook D (2014) Storage wars: How citrate-capped silver nanoparticle suspensions are affected by not-so-trivial decisions. Journal of Nanoparticle Research 16(4):2339.
https://doi.org/10.1007/s11051-014-2339-9.
[9] Kelly KL, Coronado E, Zhao LL, Schatz GC (2003) The optical properties of metal nanoparticles: The influence of size, shape, and dielectric environment. Journal of Physical Chemistry B 107(3):668–677. https://doi.org/10.1021/jp026731y.
[10] Chang W, Cheng J, Allaire J, Xie Y, McPherson J (2017) shiny: Web Application Framework for R. R package version 1.0.3.9000 http://shiny.rstudio.com.
[11] R Core Team (2017) R: A Language and Environment for Statistical Computing (R Foundation for Statistical Computing Vienna, Austria). https://www.R-project.org/.
[12] Sievert C, et al. (2017) plotly: Create Interactive Web Graphics via plotly.js. R package version 4.6.0. https://CRAN. R-project.org/package=plotly.
[14] Mulfinger L, Solomon SD, Bahadory M, Jeyarajasingam AV, Rutkowsky SA, Boritz C (2007) Synthesis and study of silver nanoparticles. Journal of Chemical Education 84(2):322. https://doi.org/10.1021/ed084p322.
[15] Thanh NT, Maclean N, Mahiddine S (2014) Mechanisms of nucleation and growth of nanoparticles in solution. Chemical Reviews 114(15):7610–7630. https://doi.org/10.1021/cr400544s.
[16] Polte J, Tuaev X, Wuithschick M, Fischer A, Thuenemann AF, Rademann K, Kraehnert R, Emmerling F (2012) Formation mechanism of colloidal silver nanoparticles: Analogies and differences to the growth of gold nanoparticles. ACS Nano 6(7):5791–5802. https://doi.org/10.1021/nn301724z.
[17] Paramelle D, Sadovoy A, Gorelik S, Free P, Hobley J, Fernig DG (2014) A rapid method to estimate the concentration of citrate capped silver nanoparticles from UV-visible light spectra. Analyst 139(19):4855–4861. https://doi.org/10.1039/C4AN00978A. [18] Wuithschick M, Paul B, Bienert R, Sarfraz A, Vainio U, Sztucki M, Kraehnert R, Strasser P, Rademann K, Emmerling F, Polte J
(2013) Size-controlled synthesis of colloidal silver nanoparticles based on mechanistic understanding. Chemistry of Materials 25(23):4679–4689. https://doi.org/10.1021/cm401851g.
About the authors: Bryan Calderón-Jiménez is a research chemist at the Costa Rican Metrology Laboratory (LACOMET), Costa Rica. Bryan is currently acting as a guest researcher in the Chemical Sciences Division at NIST. He is currently working on his Ph.D. degree in the fields of the physicochemical characterization of metallic nanoparticles, development of statistical and web applications for
characterization, and manufacturing of stable nanoparticles. Gabriel F. Sarmanho is a researcher at the National Institute of Metrology, Quality and Technology (INMETRO), Brazil. He is currently acting as a guest researcher in the Statistical Engineering Division (SED) of NIST. As an applied statistician in the metrological field, he develops statistical models, methods, and software tools to analyze measurement data, focusing in parametric and nonparametric inference, Bayesian modelling, uncertainty evaluation, and interlaboratory data assessment, including key comparisons and proficiency testing. Karen E. Murphy is a research chemist in the Chemical Sciences Division at NIST and serves as the nanometrology team leader for the Inorganic Measurement Science Group. Karen’s research involves the use of inductively coupled plasma mass spectrometry (ICP-MS) for the accurate analysis of inorganic elements in nanomaterials, clinical and environmental samples. Her research focuses on the application of single particle (sp) ICP-MS and isotope dilution analysis, including the development of high-accuracy sample preparation procedures utilizing chemical separations. Dr. Antonio R. Montoro Bustos is a guest
researcher in the Chemical Sciences Division at NIST. His research efforts are focused on the application of spICP-MS for the characterization of nanomaterials at environmentally relevant concentrations, including establishing the metrological traceability of the technique and studying impacts of matrix effects on the analytical performance of spICP-MS. Dr. Jose R. Vega-Baudrit is the director of the National Laboratory of Nanotechnology of Costa Rica. His research and contributions are focused in the field of the development and characterization of polymers and in the area of nanoscience and nanotechnology.