Gustatory reaction time and time intensity measurements of trehalose and sucrose solutions and their mixtures
24
0
0
Texto completo
(2) GUSTATORY REACTION TIME AND TIME INTENSITY MEASUREMENTS OF TREHALOSE AND SUCROSE SOLUTIONS AND THEIR MIXTURES.. GALMARINI, MARA VIRGINIA *1,2; ZAMORA, MARÍA CLARA1,2; CHIRIFE, JORGE2. 1. Consejo Nacional de Investigaciones Científicas y Técnicas (CONICET), Av. Rivadavia 1917 –. (C1033AAJ) - Buenos Aires, Argentina. 2. Facultad de Ciencias Agrarias, Pontificia Universidad Católica Argentina (UCA), Cap. Gral.. Ramón Freire 183 - (C1426AVC) - Buenos Aires, Argentina.. *Corresponding author: Mara Galmarini, TEL/FAX: (54-11) 4552-2711/2721/2724; email: mgalmarini@gmail.com. Potential reviewers: Professor Gordon Birch. g.g.birch@reading.ac.uk. Dr. John Piggott. j.r.piggott@strath.ac.uk. 1.
(3) ABSTRACT. Dynamic sweetness perception of commercial food grade trehalose, sucrose solutions and their mixtures was studied for a wide range of concentrations. For Gustatory Reaction Time (GRT) concentrations ranged from 2.3 to 13.8% sucrose and up to 23.0% for trehalose. For Time Intensity (T-I) sucrose or trehalose solutions (concentration range 2.3 – 36.8%) and their combinations (23.0 and 36.8% total solids) were analyzed. Trehalose had bigger GRT along the studied range. Both sugars presented similar values for persistence and times of plateau and to maximum intensity, while a significant difference was observed in intensity and GRT at equal concentrations. Trehalose had longer persistence than sucrose in equi-sweet solutions. Overall sweetness profile of some sucrose solutions (i.e. 29.9% sucrose solution and 0.6 sucrose/trehalose ratio mixture at 36.8% total solids) were perceived as similar to mixtures of sucrose/trehalose or single trehalose solutions; which suggests the possibility of sugar replacement without completely modifying sweetness perception.. Practical Applications It has been suggested that trehalose may be a potential substitute for sucrose and other sugars used in food formulation because, although its chemical structure is very similar to that. of sucrose, it is more stable at low pH and high temperatures. It is not involved in caramelization and does not participate in Maillard reaction with amino acids/proteins. In order to fully establish the potential of trehalose as a functional replacement of sucrose we have determined the sweetness dynamic profile (Gustatory Reaction Time and Time-Intensity curves) of trehalose solutions and sucrose/trehalose solutions; this aspect is needed for adequately replacing (partially or totally) sucrose in food systems.. Key words: Trehalose; sucrose; sweetness; time-intensity; gustatory reaction time; sensory analysis.. 2.
(4) INTRODUCTION. Trehalose is a non reducing disaccharide composed of two glucose molecules linked by an α, α -1,1 glycosidic bond. It is naturally found in mushrooms, yeasts, certain spores (Crowe et al. 1988) and even insects hemolymph (Lee, 1980). In the past years it has been studied due to its physical, chemical and biological properties. It has become increasingly available for food application as produced by the Hayashibara method (Cargill, 2004). being considered a generally recognized as safe (GRAS) multipurpose ingredient for all uses in food in accordance with current good manufacturing practices. Even though its chemical structure is very similar to that of sucrose, trehalose has an extraordinary chemical stability which makes it particularly interesting as a functional food additive. It is more stable than sucrose at low pH conditions and high temperatures. It is hardly involved in caramelization and does not result in Maillard reaction with amino acids and proteins, thus preserving the natural color of the product. In aqueous solutions it presents a water activity (aw) lowering behavior identical to that of sucrose at the same concentrations (Galmarini et al. 2008). This allows its use in combination with sucrose to optimize sweetness without altering the aw which is related to microbial stability. Trehalose has a mild sweetness equivalent to 45% of sucrose (American Dietetic Association, 2004; Birch et al. 1970) but little work has been reported on its dynamic profile, which is known to give a closer description to actual perception during ingestion. For this purpose the two main tools usually utilized to describe sweetness dynamic profile are, T-I curves and GRT. T-I curves quantify the continuous perceptual changes that occur in a specified attribute, providing temporal information about perceived sensations, from onset through extinction. They can be characterized by several parameters including, maximum intensity (Imax), time to maximum intensity (Tmax), total duration of sweet taste (Tdur), time for sweetness intensity to decline to half its maximum value (T50max), area under curve (AUC), rate of increase. 3.
(5) (Rinc), rate of decrease (Rdec) and plateau time (Tplat). Portmann and Birch (1995) described. sweet taste of trehalose only in terms of intensity and persistence by SMURF (Sensory Measuring Unit for Recording Flux) technique. However, they did not evaluate other important parameters that describe changes in sweetness along time which can be obtained by T-I records. It is to be noted that their evaluations were carried out along a small concentration range (2.3 to 9.2%) and also the trehalose used at that time was not a commercial product, as the one currently used by the food industry (Hayashibara, Cargill,. 2004). Gustatory Reaction Time (GRT) is defined as the minimum time required by a subject to report any taste changes after onset of taste stimulation at low concentration levels; being this the scope in which T-I has a smaller sensitivity (Zamora et al. 1998). This kind of study contributes to explaining the dynamic behavior of substances near threshold and up to near half supraumbral range (i.e. 15% in sucrose solutions, Zamora et al 1998). No previous work was found in literature describing GRT for trehalose. The aim of the present work was to characterize sweetness perception for trehalose and sucrose solutions as well as their mixtures using dynamic methods such as GRT and T-I; a wide range of solid concentrations was considered.. MATERIALS AND METHODS Preparation of solutions All tested solutions were prepared with commercial food grade crystalline trehalose (dihydrate) provided by Cargill Inc., Wayzata MN, U.S.A., commercial sucrose from Ledesma S.A., Argentina and distilled water. Solution concentrations tested by GRT technique were, 2.3%; 4.6%; 9.2% and 13.8 % for sucrose; and, 2.3%; 4.6%; 9.2%; 13.8%; 16.1% and 23.0% for trehalose. These concentrations were selected based on previous work by Zamora et. al (1998) which showed that the greater variation of GRT is found near threshold concentration becoming constant at. 4.
(6) higher concentrations, i.e. 15% for sucrose. The studied range for trehalose was extended due to its lower sweetness intensity at equal concentrations. The T-I method was used to evaluate pure saccharide solutions (sucrose or trehalose) as well as their mixtures; in this case concentrations were, 2.3%; 9.2%; 16.1%; 23.0%; 29.9% and 36.8%, for sucrose and trehalose. These were chosen based on previous work from Portmann. and Birch (1995). Regarding sucrose/trehalose mixtures they had a total solid content of 23.0 and 36.8 %, and were prepared by replacing different amounts of sucrose by trehalose obtaining mixtures ranging between pure sucrose to pure trehalose with the following sucrose/trehalose (s/t) ratio, 15.0; 4.3; 3.0; 1.7; 1.3; 0.8; 0.6; 0.3; 0.2; 0.06 at total concentrations of 23.0 and 36.8%. In order to find the significantly different mixture solutions within mixtures compositions, all blends were analyzed by paired comparison. All solutions were kept at 4ºC and tested at 18±2 ºC. Gustatory Reaction Time (GRT) GRT of sucrose and trehalose solutions was evaluated using a computerized system developed by Guirao and Zamora (1999). This equipment consisted of a pumping system, a computerized interface and a push button. The pumping system delivered a standardized amount of a chosen solution directly into the mouth of the assessor. The software commanded this pumping system allowing to control the duration of stimuli presentation (400 milliseconds) and interstimuli intervals (3000 milliseconds). Once the stimuli was delivered, the subject had to press the push button as soon as something different from water was identified (“go no go” procedure). This response was registered by the software recording the time (in milliseconds) elapsed between pumping and button pressing. For this part of the experiment nine assessors (all females, 22 to 50 years old) students and staff from Facultad de Ciencias Agrarias, Pontificia Universidad Católica Argentina were recruited. They were first trained in the technique and use of the equipment with distilled water along two sessions of 15 minutes each. During these training sessions judges had to press the button as soon as they felt water (Touch Reaction Time) on the tongue surface. In this way they got acquainted with the technique whilst their individual Touch Reaction Time (TRT) was. 5.
(7) obtained. Sugar solutions were evaluated over 10 sessions of 15 minutes in individual booths under day light (6500 K). An amount of 4 ml of sample was pumped directly into the mouth of the assessor, solutions were presented in random order and rinsing with distilled water between samples was mandatory. Paired comparison A panel of 12 assessors (3 men, 9 women; 16-50 years old; students and staff from Facultad de Ciencias Agrarias, Pontificia Universidad Católica Argentina) evaluated all the solutions mentioned in Preparation of Solution (sucrose/trehalose mixtures with a total solid content of 23.0 and 36.8 %, ranging between pure sucrose to pure trehalose with the s/t ratio, 15.0; 4.3; 3.0; 1.7; 1.3; 0.8; 0.6; 0.3; 0.2; 0.06 ) by forced choice paired comparison (ASTM, 1977). Evaluation was performed in duplicate obtaining a total of 24 answers. Each assessor received two samples (10 mL) presented in three digit coded plastic cups and they had to choose the sweetest one. Rinsing between samples with distilled water was allowed. The first two pairs tested were the pure sucrose solutions (23.0% and 36.8%) against 15.0 sucrose/trehalose ratio mixture at both total solids content. Assessors had to choose the sweetest one. If this comparison proved significantly different then the next tested pair was 15.0 s/t ratio mixtures against 4.0 s/t ratio mixtures, if not 4.0 s/t ratio mixtures were testes against pure sucrose solutions. Time-Intensity (T-I) Measurements Sweetness evolution over time was studied according to ISO TC 34/SC 12 N 385 (1999) using a computer software specially designed for this purpose. Assessors used a mouse to move a cursor along a 500 pixel line which represented a 20cm unstructured line scale on the monitor. For each sample and assessor data were automatically recorded every 0.35 seconds. The software provided the T-I curve as well as eight parameters which described it; maximum intensity reached (Imax), time elapsed to maximum intensity (Tmax), total duration of sweet taste (Tdur), time for sweetness intensity to decline to half its maximum value (T50max), area under curve (AUC), rate of increase of sweet taste (Rinc), rate of decrease of sweet taste (Rdec) and plateau time (time during which taste intensity remained constant) (Tplat). Assessors were. 6.
(8) prompted by the computer to expectorate the sample at 10 seconds while continually recording perceived intensity until sweet flavor reached extinction. Only the assessors who participated in both the GRT evaluations and the paired comparison experiment carried out the T-I test (females, 22 to 50 years old). For this part of the experiment assessors were trained in order to minimize individual differences and standardize T-I curves along intensity and time axes. For this purpose three sucrose concentrations within the range used in this study were used as standards, 2.3; 23.0; 36.8%. These were given the following Imax reference values on a 0 -100 scale: 5-15 (low concentration); 50 – 60 (medium concentration); 90 -100 (high concentration). Taking these reference values into account, the nine assessors performed the T-I curves of each standard solution in duplicate. These were analyzed obtaining a Tdur for each standard by eliminating extremely long and short times and calculating the mode value of this parameter. Afterwards, assessors re-did their evaluation of the standards but now with a reference value for Imax and Tdur. Once assessors replicated the curves for the standard solutions, they could begin testing unknown solutions. The number of training sessions depended on learning skills of each assessor, ranging from four to six of 15 minutes each. A balanced design was used so that all concentrations could be compared against each other. At the beginning of each session and before analyzing unknown samples, judges evaluated the standard solutions. These were also included as unknown samples for control. Trained assessors evaluated samples in triplicate along ten sessions of 40 minutes each in individual booths under day light (6500 K). Data Analysis. Average TRT values of each assessor were subtracted from their GRT values, in order to evaluate only gustatory response dismissing motor and cognitive individual differences. Ten values were obtained per assessor for every solution; media, standard deviation and range were calculated. Final average values presented highly significant differences among standard deviations (p<0.0001, Bartlett´s test) even after mathematical. 7.
(9) transformation, therefore the non parametric Kruskal Wallis test and subsequent Connover´s test were used. The gradients of the curves (GRT vs. concentration) obtained for each. assessor for sucrose and trehalose were compared by t- test for two paired samples. Significance level of paired comparison test was calculated by binomial test based on the number of correct answers. The T-I data for triplicates of the 18 treatments were analyzed separately using noncentered Principal Component Analysis (PCA) (Dijksterhuis et al. 1994; Piggott et al. 2000). Characteristic parameters were calculated for each of these new curves obtained by non-centered PCA (in triplicate for each studied solution) and were analyzed by an Analysis of Variance (ANOVA) and Student Neuman-Keuls (SNK) using replicates and solutions as factors. These parameters were then averaged in order to perform a PCA and non hierarchical k means cluster analysis. Analyses were carried out with SPSS v. 13.0 (Inc. Chicago, IL), Unscrumbler v. 9.7 (CAMO ASA, N-0115 Oslo, Norway) and Infostat v. 2007 (Universidad Nacional de Córdoba, Argentina).. RESULTS AND DISCUSSION Gustatory Reaction Time (GRT) For both sugars (trehalose or sucrose) GRT decreased with the increase of concentration, as shown in Fig. 1. At any concentration sucrose was detected earlier than trehalose, i.e. a smaller GRT; for example a 4.6% sucrose solution had almost the same GRT as 13.8% trehalose solution. As noted in Fig. 1 trehalose at 2.3% solution has a relatively large standard deviation as compared to other data. This may be attributed to the fact that 2.3% is close to threshold concentration of trehalose (Lee and Birch, 1975). For both sugars, GRT may be fitted to a power function of concentration, following Pieron´s Law (Pieron, 1914, 1920, 1952),. 8.
(10) (GRT) -to = kC-α. where GRT is Gustatory Reaction Time, to an asymptotic RT reached at higher stimulus intensities, k the range of changes between to value and the maximum RT determined at threshold, C the concentration of the stimulus and α the exponent of the function. The average empirical exponents of 10 assessors (α± SD) were found to be -0.52 ± 0.05 for sucrose and -0.37 ± 0.05 for trehalose, this values being significantly different (t- test for two paired samples, p<0.001). Even though GRT did not reach a constant value, the behavior of the curve seems to be asymptotic at high concentration values. Present results show that trehalose has a longer taste detection time than sucrose. This phenomenon could be explained by the good fitting between the equatorial disposition of hydroxyl groups and the structure of water. The stereochemical compatibility (water – trehalose) prevents the AH-B bonding to the receptor (Portmann and Birch, 1995) which results not only in a lower sweetness intensity but also in greater GRT. Paired Comparison Both pure sucrose solutions at 23.0 and 36.8% were not perceived as different from 15.0; 4.3 and 3.0 s/t ratio mixtures but were both perceived as significantly different (p<0.05 and p<0.01 respectively) from mixtures with 1.7 s/t ratio. These significantly different binary solutions of 1.7 s/t ratio at 23.0 and 36.8% total solids were also perceived as different from mixtures 0.6 s/t ratio at 23.0 and 36.8% (p<0.001 for both cases). These 0.6 s/t ratio solutions were also found different from 0.2 s/t ratio solutions for both total solids content with p<0.001 for 23.0% and p<0.01 for 36.8%. For 36.8% total solids, the 0.2 s/t mixture was found different from pure trehalose solution (p<0.05) but in terms of 23.0% total solids solutions it was found different from pure trehalose solution (p<0.001) and from 0.06 s/t ratio solution (p<0.001). This was the only case in which the differences did not remain constant between the two total solid contents.. 9.
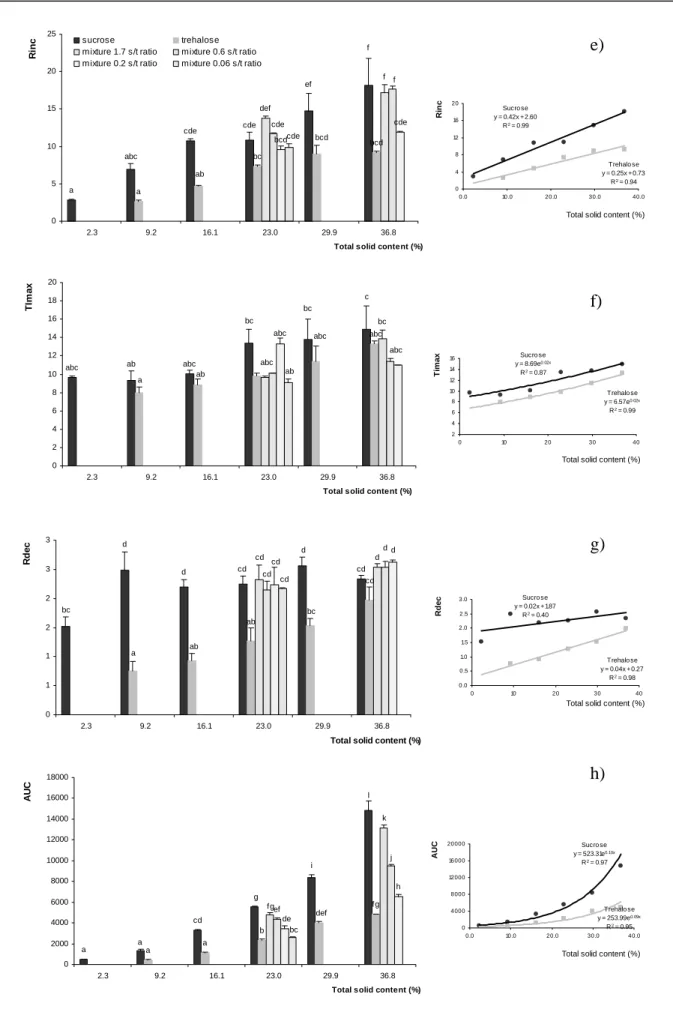
(11) The data obtained could be extrapolated to other sucrose/trehalose mixtures with a different amount of total solids within the given range (23.0%-36.8% of total solid content), knowing that in order to perceive a difference in sweetness intensity in a mixture, the sucrose/trehalose should be of 1.7 or less. Sweetness dynamic profile Results of ANOVA for T-I parameters showed that sources of variation were type of sugar (trehalose vs. sucrose) and their concentrations; however replication and replication*concentration were not significant supporting the interpretation that the assessors were consistent with their evaluations. Fig. 2 shows the values obtained for Imax (a), Tdur (b), Tpla (c), T50max (d), Rinc (e), TImax (f), Rdec (g) and AUC (h) in terms of concentration for both sugars and their mixtures (18 treatments). Imax was the parameter that showed the highest variation among concentrations and sugars; all pure solutions were significantly different at p<0.05. Imax values and concentrations were related by a power function (See Fig. 2a; being r2= 0.98 and 0.99 for sucrose and trehalose respectively). Exponent (β) of power function was 0.79 for sucrose and 1.32 for trehalose. According to Guirao (1980) there is a positive correlation between absolute threshold values and β: the higher the threshold of a given substance the bigger the value of β. This suggestion agrees with the experimental fact that trehalose has a much bigger threshold value than sucrose (1.5 g/100 ml for trehalose and 0.65 g/100mL for sucrose; Lee and Birch, 1975).. Birch et al. (1970), stated that sucrose is 40-45% sweeter than trehalose. In present work the Imax values of both sugars were compared at each concentration observing that their sweetness ratio (trehalose/sucrose) varied from 0.32 to 0.51 (mean 0.44) in the range studied. It is to be noted that present results were obtained by extrapolating parameters from a dynamic technique which is not specially designed for this purpose. Binary solutions were perceived as different (see Fig. 2a) from each other and from pure solutions with the same total solid content (p<0.05); however there were some similarities with. 10.
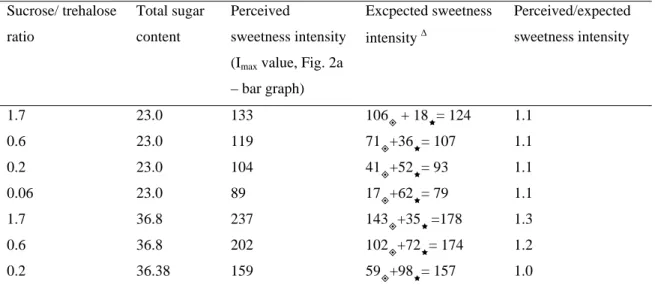
(12) pure solutions at other concentrations. A mixture of 23.0% total sugar with a 0.2 s/t ratio was perceived alike pure sucrose at 16.1%; while 23.0% mixture of 0.6 s/t ratio was similar to pure trehalose at 36.8%. In order to evaluate if there was a synergic, additive or suppressive behavior between the studied sugars, perceived and expected sweetness intensity were compared. This data is presented in Table 1. Perceived sweetness intensity was given by the Imax values obtained (Fig. 2 a – bar graph) while expected sweetness intensity was calculated by adding sweetness intensity of pure sugar solutions at their concentration in the mixture by means of the equations presented in Fig. 2 a. Even though the proportion perceived/expected sweetness intensity ranged from 1.0 to 1.3, these results were not statistically significant (t- test for two paired samples, p>0.05). In sensory evaluation same quality interactions are often predicted by a sigmoideal shaped psychophysical function, with expansive, linear or compressive phases (Keast and Breslin, 2003). The linear region is in the middle of the function and should result in intensity additivity when two concentrations from this region are added together and have a β close to 1. The mixtures studied belong to this region (linear) and their β is near the mentioned value, which explains why an additive behaviour, except of synergism, was found. This is also suggesting that both sugars interact with the same receptors given that if two sweet compounds act via the same mechanism, mixtures of two should behave in an additive manner (Hayes 2008). Fig 2b presents the obtained results for Tdur. For sucrose this parameter was described as a linear function of concentration in the range studied (r2= 0.97) but for trehalose the same behavior was observed only up to a concentration of 29.9% (r2=0.99); after that value the parameter remained constant. Pure solutions at equal concentrations presented no significant differences except at 36.8% where sucrose showed a much higher persistence than trehalose (p<0.05). In this way, equal concentrations showed significant differences for Imax but not for Tdur. When comparing the values of Tdur for equi-sweet concentrations by means of the equations presented in Fig 2a, the ratio trehalose/sucrose obtained is 1.5 for the linear studied range. This shows that in equally. 11.
(13) intense solutions trehalose is much more persistent than sucrose. In previous work Portmann and Birch (1995) reported that trehalose presented a greater persistence than sucrose at equal concentrations while the findings of this work reveal that this bigger persistence is found for equi-sweet concentrations. Among binary solutions with a 36.8% total solids significant differences were found, being the solution with a greater proportion of trehalose similar to pure 36.8% trehalose solution and less persistent than the other two mixtures (p<0.05).. For the parameter Tpla (Fig 2c) 36.8% pure sucrose was the only solution which was perceived as significantly different (p<0.05) from every other solution, showing the highest value. Fig 2d shows that both sugars presented similar linear functions of T50max in terms of concentration. The greater differences among pure solutions were observed for concentrations, 16.1%; 23.0% and 36.8%. In binary solutions of 36.8% total solids, the one with the least trehalose content presented a greater T50max than the other two mixtures with the same total sugars. Both sugars presented a Rinc that followed a linear function in terms of concentration (Fig 2 e), having sucrose a greater gradient as a consequence of its higher intensity. Mixtures at 23.0% presented the same values as the pure solutions at the same concentration except for 1.7 s/t ratio solution which was different only from pure trehalose solution. On the other hand, 36.8% binary solutions with a 1.7 and 0.6 s/t ratio had a Rinc equivalent to that of a pure sucrose solution at 36.8% and different from pure trehalose at the same concentration while 0.2 s/t was different from pure sucrose but not from pure trehalose solution. TImax (Fig 2 f) was similar for both sugars and their mixtures along the studied concentration range. These results agree with those obtained for Tdur and Tpla which did not present big variations. The Rdec (Fig. 2 g) for sucrose was almost constant along the concentration range here studied, while for trehalose this parameter showed a positive linear dependency on concentration (r2=0.98). These results show that an increase in perceived intensity is. 12.
(14) accompanied by an increase in persistence for sucrose but not for trehalose. For this parameter, mixtures at 23.0% were all significantly different (p< 0.05) from trehalose pure solution at the same concentration but not from sucrose. The AUC (Fig. 2 h) showed significant differences (p< 0.05) among sucrose solutions at different concentrations except for 2.3 and 9.2%. Trehalose solutions did not show differences between 9.2 and 16.1% and between 29.9 and 36.8%. All binary solutions at 36.8% total solids were different from pure sucrose and trehalose solutions.. In order to summarize T-I responses of all tested solutions, the obtained parameters for the three replicates of each solution were averaged and Principal Component Analysis was performed (Fig. 3) using the correlation matrix. The first Principal Component (PC1) was responsible for 83.1% of the total variation and was the only component with an eigenvalue greater than one (6.65), being the only factor necessary to explain variation among solutions. Six groups of samples were formed by non hierarchical k means cluster analysis. The 36.8% pure sucrose solution was not related to any other solution and the same was observed for the mixture of 36.8% total solid with a 1.7 s/t ratio. Sucrose solution at 29.9% was paired with the mixture of 36.8% total solids with a 0.6 s/t ratio. This shows that even though these two solutions had different amounts of solid contents, their maximum intensities were perceived as different but the sweetness profiles (i.e., Tdur, Tpla, T50max, TImax) were very similar. Another group was conformed by five solutions, sucrose 23.0%; trehalose 36.8%; 23.0% solids mixtures with 1.7 and 0.6 s/t ratio and the 36.8% binary solution with 0.2 s/t ratio. In this way, considering sweetness profile perception a 23.0% sucrose solution could be replaced by different binary mixtures or even by a pure trehalose solution of a higher concentration. The fifth cluster included 29.9% and 23.0% trehalose, 16.1% sucrose solutions and the binary 23.0% solids solutions with 0.2 and 0.06 s/t ratio. This is another example of a group of saccharides solutions which can be exchanged according to technological needs without altering sweetness. 13.
(15) profile sensory perception. The last group was composed of the four least concentrated solutions, 2.3% and 9.2% sucrose and 9.2% and 16.1% trehalose.. CONCLUSION. When comparing sucrose to trehalose at equal concentrations, trehalose presented lesser sweetness, bigger GRT and the same persistence. However, in terms of equi-sweet solutions trehalose presented a greater persistence than sucrose. This found characteristic could be of great use in products were sweetness persistence is desired, such as chewing gums and candy. The similarities observed in this work for both sugars in Time-Intensity parameters such as Tdur, Tpla, T50max and TImax revealed that trehalose and sucrose showed similar sweetness profiles. In this way, trehalose could be of much use in those products were major chemical stability is desired, obtaining a higher quality product without altering sensory perception; i.e. sweet foodstuffs in which Maillard reaction is not desired.. 14.
(16) ACKNOWLEDGEMENTS. The authors would like to thank the financial support from Agencia Nacional de Promoción Científica y Tecnológica (PICT 31951), to the sensory panel for their cooperation and to Cargill Inc. for donating the trehalose.. 15.
(17) REFERENCES AMERICAN DIETETIC ASSOCIATION. 2004. http://www.eatright.org/cps/rde/xchg/ada/hs.xsl/home_3794_ENU_HTML.htm ASTM. 1977. Manual on Sensory Testing and Methods, STP 434, pp, 16-19, American Society for Testing and Materials, Philadelphia, PA. BIRCH, G., COWELL, N.D. and EYTON, D. 1970. A quantitative investigation of Shallenberger's sweetness hypothesis. Journal of Food Technology. 5, 277-280. CARGILL FOODS. 2004. Specialty Food Ingredients, Cargill Inc., Wayzata, MN, USA. CROWE, J.H., CROWE, L. M., CARPENTER, J.F., RUDOLPH, A.S., AURELL WISTROM, C., SPARGO, B.J., ANCHORDOGUY, T.J. 1988. Interactions of Sugars with membranes. Biochim Biophys Acta. 769, 367-384. DIJKSTERHUIS, G.B., FLIPSEN, M. and PUNTER, P.H. 1994. Pricipal component analysis of time-intensity data: three methods compared. Food Quality and Preference. 5, 121-127. GALMARINI, M.V., CHIRIFE, J., ZAMORA, M.C. and PEREZ, A. 2008. Determination and correlation of water activity of unsaturated, supersaturated and saturated trehalose solutions. LWT – Food Science and Technology. 41, 628-631. GUIRAO, M. 1980. Los sentidos, bases de la percepción, p 68, Alhambra, España. GUIRAO, M. and ZAMORA, M.C. 1999. A computerized system for controlling and measuring gustatory reaction times. Journal of Sensory Studies. 15, 411-420 HAYES, J.E. 2008. Transdisciplinary Perspectives on Sweetness. Chemical Perception. DOI 10.1007/s12078-007-9003-z ISO TC 34/ SC 12 N 385. 1999. Sensory analysis – guide for the characterization of the evolution of the intensity of a sensory attribute during the time. Geneva, Switzerland. KEAST, R.S.J. and BRESLIN, P.A.S. 2003. An overview of binary taste-taste interactions. Food Quality and Preference. 14, 111-124. LEE, C. K. 1980. Developments in Food carbohydrate – 2, ed. pp 1-89. Lee, C,K, Applied Science Publishers Ltd, Londres, UK.. 16.
(18) LEE, C.K. and BIRCH, G. 1975. Structural functions of taste in the sugar series: binding characteristics of disaccharides. J. Sci. Fd. Agric. 26, 1513-1521.. PIERON, H. 1914. Recherches sur les lois de variation des temps de latence sensorielle en function des intensités excitatrices. Ann. Psychol.20, 17-96. PIERON, H. 1920. Nouvelles recherches sur l´analyse dy temps de latence sensorielle en fonction des intensités excitatrices. Ann. Psychol.22, 58-142. PIERON, H. 1952. The sensations. New Heaven , CT : Yale University Press. PIGGOTT, J.R., HUNTER, E. A., MARGOMENAU, L. 2000. Comparison of methods of analysis of time-intensity data: application to Scotch malt whisky. Food Chemistry. 71, 319-326. PORTMANN, M. O. and BIRCH, G. 1995. Sweet taste and solution properties of α, αtrehalose. Journal of the Science of Food and Agriculture. 69, 275 – 281. ZAMORA, M.C., BURATTI, F.M., OTERO-LOSADA, M.E. 1998. Temporal study of sucrose and fructose relative sweetness. Journal of Sensory Studies. 13, 213-228.. 17.
(19) TABLE 1. COMPARISON BETWEEN PERCEIVED AND EXPECTED SWEETNESS INTENSITY IN BINARY SUCROSE/TREHALOSE MIXTURES.. Sucrose/ trehalose ratio. Total sugar content. Perceived sweetness intensity. Excpected sweetness intensity. ∆. Perceived/expected sweetness intensity. (Imax value, Fig. 2a – bar graph) 1.7. 23.0. 133. 106 + 18Ì= 124. 1.1. 0.6. 23.0. 119. 71+36Ì= 107. 1.1. 0.2. 23.0. 104. 41+52Ì= 93. 1.1. 0.06. 23.0. 89. 17+62Ì= 79. 1.1. 1.7. 36.8. 237. 143+35Ì =178. 1.3. 0.6. 36.8. 202. 102+72Ì= 174. 1.2. 0.2. 36.38. 159. 59+98Ì= 157. 1.0. ∆. values were obtained by adding expected sweetness intensity of pure sucrose in the concentration given in the. mixture to expected sweetness intensity of pure trehalose in the concentration given in the mixture. For this purpose equations from regressions line (Fig. 2 a) were used. . sucrose. Ì. trehalose. 18.
(20) Figure captions. Figure 1. Gustatory Reaction Time (Msec) as a function of concentration for sucrose and trehalose. Different lower case letters represent significant differences (p<0.05) among solutions according to Student Neuman-Keuls.. Figure 2. Time-Intensity parameters as a function of concentration. Different lower case. letters on the bar graph represent significant differences (p<0.05) among solutions according to Student Neuman-Keuls.. Figure 3. Principal Component Analysis of sweetness Time-Intensity data. Projection of TimeIntensity parameters loadings (vectors) and sample factor scores on principal components 1 and 2. Clusters are delimitated. Numbers 1-6 refer to sucrose 36.8%, 29.9%, 23.0%, 16.1%, 9.2%, 2.3% respectively; 7-11 to trehalose 36.8%, 29.9%, 23.0%, 16.1%, 9.2%, respectively; 12-14 to 36.8% total solids solutions at 1.7; 0.6 and 0.2 s/t ratio respectively and 15-18 to 23.0% total solids solutions at 1.7; 0.6, 0.2 and 0.06 s/t ratio respectively.. 19.
(21) Time (msec). 2500. 2000. g f. 1500. f Trehalose y = 2587.9x (- 0.37) ; r2 = 0.99. e d. 1000. d. c b. b Sucrose y = 2358.6x (- 0.53) ; r2 = 0.99. 500. a. 0 0. 2. 4. 6. 8. 10. 12. 14. 16. 18. 20. 22. 24. 26. Concentration (% w/v). Figure 1.. 20.
(22) 250. sucrose. trehalose. mixture 1.7 s/t ratio. mixture 0.6 s/t ratio. mixture 0.2 s/t ratio. mixture 0.06 s/t ratio. a). p o n. m. 200. Imax. Imax. 300. l k. 150. i. i h. Sucrose y = 12.92x0. 79 R2 = 0.98. 100. g. f. 100. Trehalose y = 1.08x1. 32 R2 = 0.99. 50. e. d 50. 250 200 150. j. h. 300. 0 0. 10. 20. 30. 40. c b. Total solid content (%). a. 0 2.3. 9.2. 16.1. 23. 29.9. 36.8. Tdur. Total solid content (%). 160. b). i. 120. h. gh. 100. efg. fg. gh. def. 60. 80. Trehalo sa y = 2.06x + 24.89 R 2 = 0.99. 60 40. bc. 20. ab ab 40. Sucro se y = 3.12x + 17.7 R 2 = 0.97. 140. 100. def cd. cde bc. 160. 120. cdef. 80. Tdur. 140. 0. a. 0. 10. 20. 30. 40. Total solid content (%) 20 0 2.3. 9.2. 16.1. 23. 29.9. 36.8. Total solid content (%). 14. a a. 12 10 8. c). b. 16. a a. a. a. a. 16 14 12 10. a aa a a. a a. a a. a. Tpla. Tpla. 18. 8 6 4 2. 6. 0 0. 10. 20. 30. 40. 4 Total solid content (%). 2 0 2.3. 9.2. 16.1. 23.0. 29.9. 36.8. 60. d). j. i 50. h fg efg. 40 cd 30. bc. ef efg de cd. gh. efg. efg. 55 50. Sucrose y = 0.92x + 16.41 R 2 = 0.97. 45 40 35. ab. Trehalo se y = 0.76x + 12.98 R 2 = 0.97. 30. a. a. T50max. T50max. Total solid content (%). 25. a. 20. 20. 15 10 0. 10. 20. 30. 40. 10. Total solid content (%) 0 2.3. 9.2. 16.1. 23. 29.9. 36.8. Total solid content (%). 21.
(23) 25. Rinc. sucrose mixture 1.7 s/t ratio mixture 0.2 s/t ratio. 20. trehalose mixture 0.6 s/t ratio mixture 0.06 s/t ratio. e). f. f f. 15. Rinc. ef def cde. cde. cde. cde bcdcde. 10 abc. bcd. 20. 12. bcd. 8. bc. a. Trehalo se y = 0.25x + 0.73 R 2 = 0.94. 4. ab 5. Sucro se y = 0.42x + 2.60 R 2 = 0.99. 16. 0. a. 0.0. 10.0. 20.0. 30.0. 40.0. Total solid content (%). 0 2.3. 9.2. 16.1. 23.0. 29.9. 36.8. 20 c. 18. f). bc 16. bc. bc abc. 14. abc. abc. abc. 12 ab. abc. 10. abc. abc. ab. ab. a. Timax. TImax. Total solid content (%). Sucro se y = 8.69e0.02x R 2 = 0.87. 16 14 12 10. 8. Trehalo se y = 6.57e0.02x R 2 = 0.99. 8. 6. 6 4. 4. 2 0. 2. 10. 20. 30. 40. Total solid content (%). 0 2.3. 9.2. 16.1. 23.0. 29.9. 36.8. Rdec. Total solid content (%). 3. d cd. 3. cd. d. d. d. cd. cd. g). d d. cd cd. cd. bc. Rdec. 2 bc ab. 2. 2.5 2.0 1.5. ab. a. 1. Sucro se y = 0.02x + 1.87 R 2 = 0.40. 3.0. 1.0. Trehalo se y = 0.04x + 0.27 R 2 = 0.98. 0.5. 1. 0.0 0. 10. 20. 30. 40. Total solid content (%). 0 2.3. 9.2. 16.1. 23.0. 29.9. 36.8. Total solid content (%). h). AUC. 18000 l. 16000. k. 14000. j. 10000. i. 20000. Sucro se y = 523.31e0.10x R 2 = 0.97. 16000 12000. 8000. h 8000. g. 6000. fg. fgef de bc. cd. 4000. b 2000. AUC. 12000. a. a. Trehalo se y = 253.99e0.09x R 2 = 0.95. 4000. def. 0 0.0. 10.0. 20.0. 30.0. 40.0. a. a. Total solid content (%). 0 2.3. 9.2. 16.1. 23.0. 29.9. 36.8. Total solid content (%). Figure 2. 22.
(24) Figure 3. 23.
(25)
Figure
Documento similar
Content of total flavanones (mg/100 mL) of juices developed using stevia and sucrose as sweeteners, measured during storage for 90 days under three different conditions (4 °C and 25
Using data from the Well-being Module of the 2010, 2012, and 2013 American Time Use Survey (ATUS), we found that more time spent in commuting is related to higher levels of
We explore the impact of the symmetry on the time evolution of this type of fluid, and we find solutions which are greatly influenced by its presence: at a large aspect ratio and
The maintenance of normal sucrose levels in the nodules of Cd-treated plants may be due to the balance between the reduced demand for C skeletons for N 2 fixation leading to a
Chapter 7 - Selective fermentation of potential prebiotic lactose-derived oligosaccharides by probiotic bacteria Chapter 8 - In vitro faecal fermentation of novel
[r]
Ca 2+ signatures induced by binary mixtures and a multiantibiotic mixture were clearly different from those of the antibiotics applied singly and, using amplitude as a
As in the case of pistachio, DIC treatment reduces band intensity as pressure and time increase, and the most effective treatment is DIC8 in which both the number and intensity of
