Deamidation of pseudopeptidic molecular hydrogelators and its application to controlled release
105
0
0
Texto completo
(2) Escuela superior de Tecnología y Ciencias Experimentales Departamento de Química Inorgánica y Orgánica Grupo de Química Supramolecular. Deamidation of pseudopeptidic molecular hydrogelators and its application to controlled release. DIEGO NAVARRO BARREDA MASTER'S THESIS JULY 2017.
(3)
(4) El Dr. Juan Felipe Miravet Celades, Catedrático del Departamento de Química Inorgánica y Orgánica de la Universitat Jaume I de Castellón de la Plana, y el Dr. César Augusto Angulo Pachón, Investigador de la Universitat Jaume I,. CERTIFICAN. Que el trabajo fin de máster, con el título "DEAMIDATION OF PSEUDOPEPTIDIC MOLECULAR HYDROGELATORS AND ITS APPLICATION TO CONTROLLED RELEASE", ha sido realizado por Diego Navarro Barreda bajo su dirección, en el grupo de Química Supramolecular del Departamento de Química Inorgánica y Orgánica de la Universitat Jaume I de Castellón de la Plana.. Lo que certificamos a los efectos oportunos en Castellón de la Plana a 11 de Julio de 2017.. Fdo. Dr. Juan F. Miravet Celades. Fdo. Dr. César A. Angulo Pachón.
(5)
(6) The content of this Master's Thesis is in press. “Deamidation of pseudopeptidic molecular hydrogelators and its application to controlled release” in Journal of Colloid and Interface Science. https://doi.org/10.1016/j.jcis.2017.07.003 (See Annex I)..
(7)
(8) Acknowledgements Quisiera expresar mi más profundo agradecimiento a todos aquellos que me brindaron la posibilidad de completar este trabajo. En primer lugar, quisiera agradecer al Dr. Juan F. Miravet Celades y el Dr. César A. Angulo Pachón, la ayuda para coordinar con éxito este proyecto. Quisiera agradecer también su respaldo y orientación, junto con las grandes ideas aportadas. Por supuesto agradecer a las personas con las que he compartido las horas de trabajo en el laboratorio, las horas restantes correspondientes a la redacción del presente escrito, así como las invertidas en dosis de café. Agradecer al Doctor Francisco Galindo, quien me ha ayudado y animado durante las insufribles sesiones de espectrofotometría, solucionando dudas y contribuyendo con ideas. Al indiscutible doctorando Carles Felip León, cuya peculiar manera de amenizar las horas de trabajo, es un plus de motivación para afrontar los retos que se plantean. Y a la doctorando Ana Torres Martínez y la masterando Carla Arnau del Valle, por contribuir a terminar este trabajo de manera exitosa, participando en el Congreso VII Iberian Meeting on Colloids and Interfaces (RICI 7) en Madrid. También agradecer al resto del grupo de Química Supramolecular del Departamento de Química Inorgánica y Orgánica, graduandos y masterandos por el apoyo recibido. A todos os agradezco la compañía y os deseo lo mejor. A toda mi familia y amigos, que me han ayudado en todo momento y han conseguido abstraerme de los problemas asociados al trabajo. Finalmente, me gustaría agradecer de forma muy profunda y sentida "...al nen" la paciencia, cariño y apoyo recibido durante toda la duración del Máster. Te dedico todo lo vivido y lo que nos queda por vivir. Gracias Lorena, gracias amor..
(9)
(10) “Solo haciendo lo que realmente te gusta consigues la máxima motivación. Solo trabajando en lo que es tu verdadera pasión logras la verdadera felicidad”. Josef Ajram.
(11)
(12) Abbreviations Cbz. Benzyloxycarbonyl. CLogP. Partition coefficient between octanol and water (fragmentbased prediction). COSY. 2D correlation spectroscopy. C6. Hexyl radical. C8. Octyl radical. DCC. N,N’-Dicyclohexylcarbodiimide. DCU. N,N′-Dicyclohexylurea. DMSO. Dimethyl sulfoxide. ESI. Electrospray ionization. ESMS. Electrospray mass spectrometry. Glt. Glutaric acid radical. GltValHex, IV. (S)-5-((1-(hexylamino)-3-methyl-1-oxobutan-2-yl)amino)5-oxopentanoic acid. GltValOct, II. (S)-5-((3-methyl-1-(octylamino)-1-oxobutan-2-yl)amino)-5oxopentanoic acid. Hex. Hexyl radical. HMBC. Heteronuclear multiple bond correlation. HPLC. High performance liquid chromatography. HRMS. High-resolution mass spectrometry. HSQC. Heteronuclear single quantum coherence. HValC6. (S)-2-amino-N-hexyl-3-methylbutanamide. HValC8. (S)-2-amino-3-methyl-N-octylbutanamide. LMW. Low molecular weight. LMWGs. Low molecular weight gelators.
(13) mgc. minimum gelator concentration. MO. Methyl orange. NMR. Nuclear magnetic resonance. Oct. Octyl radical. Q-TOF. Quadrupole time-of-flight. SAFIN. Self-assembled fibrillar network. SEM. Scanning electron microscopy. Suc. Succinic acid radical. SucValHex, I. (S)-4-((1-(hexylamino)-3-methyl-1-oxobutan-2- yl)amino)4-oxobutanoic acid. SucValOct, III. (S)-4-((3-methyl-1-(octylamino)-1-oxobutan-2-yl)amino)-4oxobutanoic acid. TEM. Transmission electron microscopy. THF. Tetrahydrofuran. TMS. Trimethylsilane. UV-Vis. Ultraviolet-visible spectroscopy. Val. Valine radical. ZValOH. Carbobenzyloxy-L-valine acid. ZValOSu. (S)-2,5-dioxopyrrolidin-1-yl((benzyloxy)carbonyl)-Lvalinate. ZValC6. (S)-benzyl (1-(hexylamino)-3-methyl-1-oxobutan-2yl)carbamate. ZValC8. benzyl (S)-(3-methyl-1-(octylamino)-1-oxobutan-2yl)carbamate.
(14) Synthesized and studied compounds.
(15)
(16) Index Chapter 1. Introduction. 1. 1.1. Molecular gels. 1. 1.2. Peptide-based molecular gelators. 3. 1.3. Characterization of molecular gels. 6. 1.3.1. Macroscopic mechanical properties. 6. 1.3.1.1 Minimum gelator concentration. 6. 1.3.1.2 Gel-to-solution transition temperature 7. 1.4. 1.3.1.3 Rheology. 8. 1.3.2. Microscopic structure. 9. 1.3.3. NMR Analysis. 9. Deamidation reaction. 10. Chapter 2. Objectives. 13. Chapter 3. Results and Discussion. 15. 3.1. Synthesis and Characterization. 15. 3.2. Gelation studies. 17. 3.2.1. Heating-cooling method. 18. 3.2.2. pH change method. 18. 3.2.3. Precipitation method. 19. 3.2.4. Determination of minimum gelation. 3.3. concentration. 20. 3.2.5. Partition coefficient studies. 20. 3.2.6. Determination of gel-to-solution transition temperature. 23. Transmission electron microscopy (TEM). 23.
(17) 3.4. 3.5. NMR studies. 25. 3.4.1. Solubility determination. 25. 3.4.2. Study of hydrolytic stability. 30. Controlled release studies. 38. 3.5.1. Optimization. 39. 3.5.1.1 Methyl orange. 39. 3.5.1.2 Crystal violet. 40. 3.5.1.3 Orange II. 41. 3.5.1.4 Rose bengal. 42. UV/Vis measurements. 43. 3.5.2 Chapter 4. Conclusions. 47. Chapter 5. Experimental Section. 49. 5.1. Synthesis and Characterization. 49. 5.1.1. General considerations. 49. 5.1.2. Synthetic scheme. 50. 5.1.3. Activation of amino acid L-valine. 50. 5.1.4. Coupling between activated esters and amines 51. 5.1.5. Removal of Cbz protecting group. 52. 5.1.6. Reaction with anhydrides. 53. 5.2. Transmission electron microscopy (TEM). 56. 5.3. NMR studies. 56. 5.3.1. 56. 5.4 Chapter 6 Annex I. Study of hydrolytic stability. UV/Vis measurements. Spectra Section. 56 57.
(18) Chapter 1. Introduction.
(19)
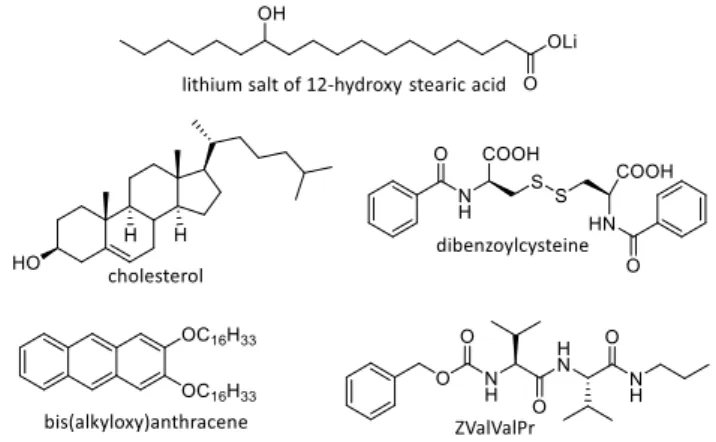
(20) Chapter 1: Introduction. Chapter 1: Introduction 1.1 Molecular gels Molecular gels have received increasing attention in the last decades. Although the first molecular gel was reported in 1841, little progress was made to understand such materials until fairly recently. At present, there is a great effort to understand and exploit molecular gels and an enormous interest in this field is arousing not only to understand about the fundamentals of the aggregated structure, but also to explore their potential for future applications.1 In the beginning, the discovery of most of these molecules was by serendipity (typically from a failed crystallization attempt). However, with the knowledge gained during the last decades, now gelators are being designed with specific characteristics both structural and functional in order to obtain materials with the properties suitable for a given application. Molecular gels, in opposition to polymer-based gels, are constituted by low molecular weight species with a molecular weight of less than 2000 Da (see Figure 1-1.). These small organic compounds are called low molecular weight gelators (LMWGs).2. Figure 1-1. Structure of various molecules known to act as LMWGs. 1. R. G. Weiss, J. Am. Chem. Soc., 2014, 136, 7519-7530. Escuder, B. (Ed.); Miravet J. F. (Ed.), (2014). "Functional Molecular Gel". Universitat Jaume I, Spain: The Royal Society of Chemistry. 2. 1.
(21) Diego Navarro Barreda. Commonly, gelation process involves self-association of the gelator molecules to form polymer-like fibrous aggregates that are entangled during the aggregation process forming a three-dimensional (3D) network. This network is known as selfassembled fibrillar network (SAFIN), although there are some molecular gels whose elements of the network are not fibrillar. Regardless, the network traps the solvent mainly by surface tension that prevents the flow of solvent under gravity and the mass appears like a solid, despite of being predominantly liquid in composition (typically 99% by weight of the gel is a liquid while the remaining 1% is the gelator).3 Such materials are termed organogels in cases where the fluid component is an organic compound or hydrogels when it is water. A schematic representation of the gelation process is showed in Scheme 1-1.. Scheme 1-1. Representation of the hierarchical self-assembly of molecular gels.4. Molecular gels can be defined as a type of physical gels whose networks are formed through a combination of non-covalent interactions like H-bonding, π-π stacking, donor-acceptor interactions, metal coordination, solvophobic forces (hydrophobic forces for gels in water) and Van der Waals interactions.5. 3. K. Hanabusa, M. Suzuki, Polym. J., 2004, 46, 776-782. E. Krieg, E. Shirman, H. Weissman, E. Shimoni, S. G. Wolf, I. Pinkas, B. Rybtchinski, J. Am. Chem. Soc., 2009, 131, 14365-14373. 5 N. M. Sangeetha, U. Maitra, Chem. Soc. Rev., 2005, 34, 821-836. 4. 2.
(22) Chapter 1: Introduction. Thus, molecular gels are complicated systems controlled by a delicate balance of intermolecular interactions both among gelator molecules and between gelator and solvent. Furthermore, molecular gels are dynamic supramolecular systems in which free molecular entities and aggregates are in equilibrium governed by the solubility of the gel phase. These weak non-covalent interactions are easy to break; consequently, such gels are reversible and can be readily transformed to a fluid on changing environmental conditions such as temperature, pH, ionic strength, light, redox agents, electronic and magnetic fields, etc.6 Due to this reversible nature, dynamic behaviour and chemical sensitivity, along with the high biodegradability, biocompatibility and their easy control of functionalization and composition, molecular gels are excellent candidates for fields such as regenerative medicine, tissue engineering, drug delivery and therapeutic agents, as well as optoelectronic applications and catalysis.7. 1.2 Peptide-based molecular gelators A wide structural variety of molecular gelators has been reported in the literature but, undoubtedly, amino acid, peptide and peptide-like motifs are very common.8 Peptide-based gelators are interesting candidates since they are easy to manufacture in large quantities, and they can be easily modified chemically and biologically. Another attraction of LMW peptide gelators is that they offer a simple model system for studying the complex problem of peptide self-assembly.9 It should be stressed that the peptide does not polymerise in the conventional sense and that hydrogen bonding, hydrophobic interactions and π-π stacking hold the entire material together. Indeed, the propensity of these building blocks to. 6. A. Dawn, T. Shiraki, S. Haraguchi, S. Tamaru, S. Shinkai , Chem. Asian J., 2011, 6, 266-282. (a) J. W. Steed, Chem. Commun., 2011, 47, 1379-1383. (b) K. J. Skilling, F. Citossi, T. D. Bradshaw, M. Ashford, B. Kellam and M. Marlow, Soft Matter, 2014, 10, 237-256. 8 (a) C. J. Bowerman and B. L. Nilsson, Biopolymers, 2012, 98, 169-184. (b) E. K. Johnson, D. J. Adams and P. J. Cameron, J. Mater. Chem., 2011, 21, 2024-2027. 9 M. Reches and E. Gazit, Curr. Nanosci., 2006, 2, 105-111. 7. 3.
(23) Diego Navarro Barreda. form intermolecular H-bonding and their chirality seem to represent key elements that provide with good self-assembly capabilities.10 In this sense, it is very important that the gelator acquires the correct selfassembling molecular conformation. In fact, oligomers that form helices are bad candidates as LMWGs, however, oligomers that tend to fold in a β-sheet structure are good candidates to form fibres, thus to behave as gelators (see Figure 1-2).11. Figure 1-2. Schematic β-sheet structure of peptide based LMWG.. As a reversible system, stimuli responsiveness of peptide molecular hydrogels represents a major advantage in biomedical applications related to controlled release, like drug delivery or cancer therapy. Indeed, passive diffusion out of the self-assembled network or progressive disassembly of the fibbers provides a means of controlled release from molecular gels. The field of controlled release by molecular gels has been extensively investigated in recent years and excellent reviews have been published.12 Our group pioneered the combination of supramolecular hydrogels, together with self-immolative spacers, for controlled release promoted by enzymes. These hydrogels contained a lysine moiety linked to model drugs (benzylamine and 10. A. R. Hirst, B. Escuder, J. F. Miravet and D. K. Smith, Angew. Chem. Int. Ed., 2008, 47, 80028018. 11 C. Tomasini and N. Castellucci, Chem. Soc. Rev., 2013, 42, 156-172. 12 (a) N. Singh, M. Kumar, J. F. Miravet, R. V. Ulijn and B. Escuder, Chem. Eur. J., 2017, 23, 981-993. (b) M. Dolores Segarra-Maset, V. J. Nebot, J. F. Miravet and B. Escuder, Chem. Soc. Rev., 2013, 42, 7086-7098. 4.
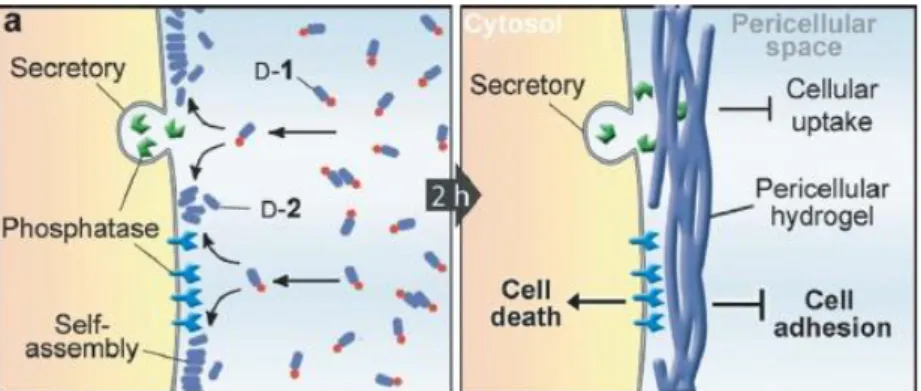
(24) Chapter 1: Introduction. phene-thylamine) through self-immolating spacer (p-aminobenzyloxycarbonyl). In presence of trypsin the amide linkage between the gelator moiety and the spacer was hydrolyzed leading to the release of the model drug.13 In addition, related to drug release triggered by enzyme, Ulijn et al. designed phenylacetyl-peptide amphiphiles that could encapsulate the anticancer drug doxorubicin into their spherical aggregates. This peptide undergoes hydrolysis in the presence of the matrix metalloproteinase enzyme MMP-9, resulting in supramolecular reorganization from spheres to 1-D nanofibers (see Figure 1-3).14 Upon this morphological change, the loaded doxorubicin could be retained in the fibres formed, which makes them valuable carriers for slow release of hydrophobic anticancer drugs.. Figure 1-3. Pictorial representation of spherical-to-fibrillar reorganization, leading to release of anticancer drug doxorubicin.. Another smart design of peptide assembly for cancer therapy was developed by Xu et al. 15 They report that when the precursor of the hydrogelator was dephosphorylated, the self-assembly of the hydrogelator was triggered selectively around the cancer cells that overexpress phosphatases, resulting in the formation of a pericellular hydrogel (see Figure 1-4). Cell-based assays confirmed that the pericellular hydrogel blocked cell mass exchange and induced apoptosis of cancer cells.. 13. J. A. Sáez, B. Escuder and J. F. Miravet, Tetrahedron, 2010, 66, 2614-2618. D. Kalafatovic, M. Nobis, N. Javid, P. W. J. M. Frederix, K. I. Anderson, B. R. Saunders, R. V. Ulijn, Biomater. Sci., 2015, 3, 246-249. 15 Y. Kuang, J. Shi, J. Li, D. Yuan, K. A. Alberti, Q. Xu, B. Xu, Angew. Chem., 2014, 53, 81048107. 14. 5.
(25) Diego Navarro Barreda. Figure 1-4. The action of phosphatase leading to hydrogel formation around tumor cells and the mechanism of apoptosis.. 1.3 Characterization of molecular gels Molecular gels, as described, are highly complex systems. Therefore, it is necessary to obtain detailed structural information of the molecules that generate the gel as well as to obtain a better understanding of the molecular organization in the gel. Only in this way, we will be able to understand the behaviour of a particular gel and rationally design new families of gels with tailored properties. Basically, the characterization of molecular gels must be focused on the determination of the macroscopic mechanical properties, the elucidation of the microscopic structure and morphology of the fibers, as well as the organization at molecular level, and the establishment of the thermodynamics and kinetics of the self-assembly process.. 1.3.1 Macroscopic mechanical properties 1.3.1.1. Minimum gelator concentration (mgc). Generally, the gelation capability of a molecule in a given solvent is defined by the minimum gelator concentration (mgc), that can be defined as the minor quantity required of a given molecule to form a gel (usually at 25 oC), i.e., the minimum concentration at which the gelator is able to immobilize certain volume of solvent. Therefore, the most effective gelator will be the one able to form gels at the lowest concentration. 6.
(26) Chapter 1: Introduction. There are several ways in which this parameter can be assessed, for example, Tube Inversion Methodology or Dropping Ball Method. The first one is the method that was used in this project. It consists of the investment of the vial containing the gel and the observation to see whether any flow occurs or not.2 It is the simplest method and there are no requirements for specialized equipment (see Figure 1-5).. Figure 1-5. Graphical representation of the tube inversion test.. This method provided a fast test to identify the formation of a gel; however, care must be taken in conducting and interpreting the results. In fact, this method is dependent on both sample mass and vial size, thus, it is crucial to use the same sample and vial type all the time.. 1.3.1.2. Gel-to-solution transition temperature (Tgel). The gel-to-solution transition temperature is another of the most commonly employed parameters in order to characterize a gel and can be defined as the temperature at which the gel loses its ability to prevent the flow of solvent, i.e., the gel is converted into a liquid-like solution. Typically as the molar concentration was increased, Tgel increased until a plateau region was reached, denoted by a concentration-independent Tgel.16 Like mgc, the Tube Inversion Methodology allows the determination of Tgel in an easy manner. Normally, the procedure is to prepare samples of different 16. A. R. Hirst, I. A. Coates, T. R. Boucheteau, J. F. Miravet, B. Escuder, V. Castelletto, I. W. Hamley and D. K. Smith, Journal of the American Chemical Society, 2008, 130, 9113-9121. 7.
(27) Diego Navarro Barreda. concentrations of a given compound (above the mgc, obviously) and determine this gel-to-solution transition temperature. Once done, we can obtain a phase diagram of gelation representing Tgel vs. concentration, differentiating a region where gel behaves as a solid and another region where gel behaves as a liquid solution (see Figure 1-6). 100 90 80. Tgel / oC. 70 60 50. 40 30 20 10 0 10. 15. 20. 25. 30. 35. 40. 45. Conc /mM. Figure 1-6. Schematic representation of Tgel.. 1.3.1.3. Rheology. The term viscoelasticity encompasses the behaviour of many fluids that can exhibit elasticity and flow when they are subjected to an applied stress. Most concentrated pastes and emulsions, as well as gels, often show viscoelasticity. A viscoelastic material has an internal structure that is capable of storing energy at low deformations, energy that is then released by returning to its original configuration. Of course, if the deformation is of sufficient magnitude, the internal structure collapses and the flow of the material occurs.17 That results in the following behaviour: at low deformations, the viscoelastic fluid behaves literally as an elastic solid. At high deformations, these compounds flow viscously, i.e. as a liquid.. 17. H. F. Mark, Encyclopedia of Polymer Science and Technology, 3 Edn., John Wiley & Sons, Inc., 2004. 8.
(28) Chapter 1: Introduction. The simplest way to study the viscoelasticity of molecular gels is through rheology, which is defined as the science of the deformation and flow behaviour. Rheological studies are concerned with the response of materials to an applied stress. So, due to this peculiar viscoelastic behaviour of molecular gels, the control of rheology is essential for the manufacture and handling of such materials, since their mechanical properties will be defined by this behaviour.. 1.3.2 Microscopic structure Microscopic techniques provide valuable information about the morphology of the networks that result in gelation. There are a wide range of these techniques, such as atomic force microscopy (AFM), X-ray powder diffraction (XRD), confocal laser scanning microscopy (CLSM), scanning electron microscopy (SEM), transmission electron microscopy (TEM), etc. Currently, the most widespread techniques for the morphological characterization of the gels are TEM and SEM. However, results must be carefully analyzed because these techniques require complete drying of the sample by high vacuum, which in some cases may result in artefacts, agglomerations, deformations, etc. To avoid these problems related with solvent evaporation, several techniques have emerged based on freeze-drying of the gels, like cryo-SEM or cryo-TEM.. 1.3.3 NMR Analysis NMR is a powerful spectroscopic technique that can be used to elucidate, on a molecular level, the orientation and the interaction sites of the molecules that lead to self-assembly. This technique is focused on the analysis of the variation of either chemical shifts, NMR relaxation times, or intensity of the NMR signals. Proton NMR signals corresponding to the low molecular weight gelator have been observed when a molecular gel has been studied by NMR. However, the intensity of such signals compared to an internal standard indicates that only a percentage of the gelator molecules are observable by NMR. In general, the free monomers and small oligomers have suitable relaxation times for study by NMR, and are observable. But, the molecules that are part of the gel network are not observable by NMR as a result of the large correlation time of the 9.
(29) Diego Navarro Barreda. assemblies, which results in a very short transversal relaxation time (T2), and very broad (unobservable) signals.18 That can be particularly useful for probing the self-assembly and gelation of given compounds. Those data can be used to obtain useful information such as the nature of the intermolecular interactions, the critical concentration values, the change in the motion of the molecules, or thermodynamic and kinetic parameters associated with gel formation, such as solubility constant (Ks) or the reaction rate constant (k), respectively.. 1.4 Deamidation reaction Chemically, the typical procedures for hydrolysing amides are based on the use of strong acids and bases at high concentrations, together with prolonged heating. However, proteins (formed by amide bonds) ingested in the diet must be broken into smaller peptides for absorption in the intestine or those that have fulfilled their goals, must be biodegraded to the synthesis of new proteins. These proteins are broken by the action of enzymes that are known as proteases or peptidases, e.g., the Chymotrypsin.19 Otherwise, it is reported that spontaneous degradation of proteins can take place in peptides and proteins containing asparaginyl and aspartyl residues. This process is an intramolecularly catalyzed nonenzymatic deamidation that takes place via succinimide intermediates, resulting in modified proteins (see Scheme 1-2). Another nonenzymatic chemical process is found in inteins. An intein is a segment of a protein that is able to excise itself and join the remaining portions (the exteins) with a peptide bond in a process termed protein splicing (see Scheme 1-3).20. 18. B. Escuder, M. Llusar and J.F Miravet, J. Org. Chem. 2006, 71, 7747. D. M. Blow, Acc. Chem. Res., 1976, 9, 145-152. 20 C. J. Noren, J. Wang, and F. B. Perler, Angew. Chem. Int. Ed., 2000, 39, 450-466. 19. 10.
(30) Chapter 1: Introduction. Scheme 1-2. Simplified mechanisms of protein deamidation.. Scheme 1-3. Mechanism proposed for protein splicing in inteins.. 11.
(31)
(32) Chapter 2. Objectives.
(33)
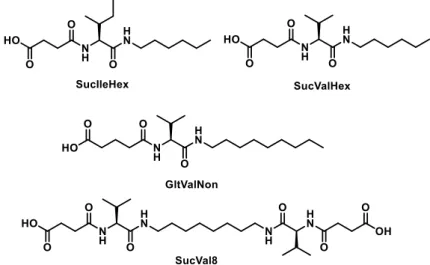
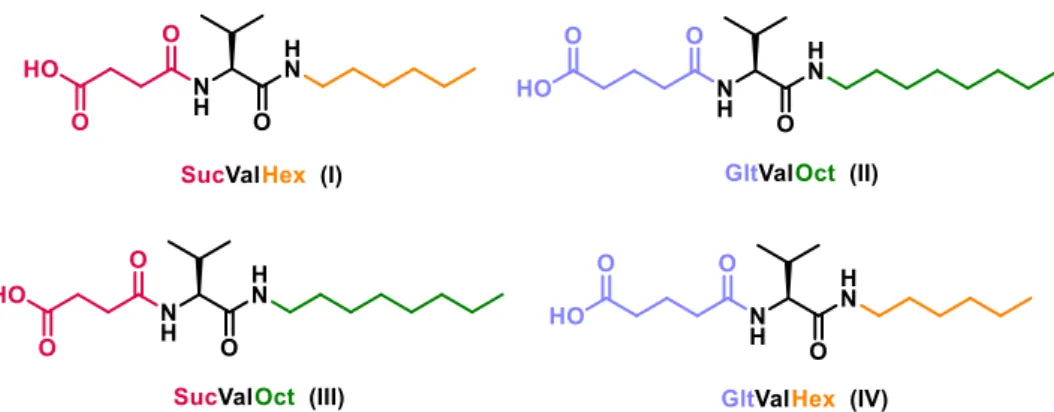
(34) Chapter 2: Objectives. Chapter 2: Objectives Previously, the research group synthesized a family of compounds derived from succinic acid and glutaric acid (see Figure 2-1).. Figure 2-1. Several compounds derived from succinic acid and glutaric acid previously synthesized.. Unexpectedly, it has been discovered that succinic acid derivatives undergo hydrolysis when they are subjected to mild heating conditions. However, it has been found that glutaric acid derivatives are not hydrolyzed at all. We have hypothesized that such reaction would permit controlled disassembly of molecular hydrogelators derived from succinic acid and the use of these hydrogels for controlled release of actives.. Taking into account the above, the objectives of this work we aim to: . Synthesize and characterize succinic acid and glutaric acid derived compounds (showed in Figure 2-2).. 13.
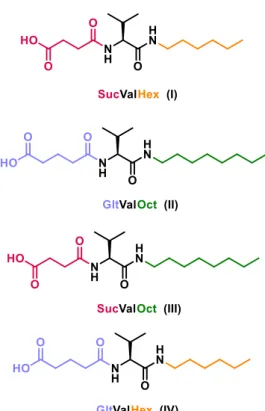
(35) Diego Navarro Barreda. Figure 2-2. Compound synthesized in the present project.. . Characterize the hydrogels, determining the minimum gelator concentration, gel-to-solution transition temperature (Tgel), solubility (Ks) and morphology.. . Develop and optimize a suitable method to apply the thermally promoted deamidation to controlled release of actives.. 14.
(36) Chapter 3. Results and Discussion.
(37)
(38) Chapter 3: Results and Discussion. Chapter 3: Results and Discussion 3.1 Synthesis and Characterization Molecules composed by an aliphatic tail (hexyl or octyl), L-valine and an acid group (succinic acid or glutaric acid) as structural units were initially synthesized aimed to explore their hydrogelation capabilities (see Scheme 3-1). Previously the research group synthesized a family of compounds derived from succinic acid and glutaric acid, varying the type de amino acid (alanine, isoleucine, phenylalanine, etc.) or the nature of the aliphatic chain (linear, cyclic, etc.). In fact, molecular gelators containing the succinic acid-derived moiety have been extensively investigated in our group and have been published as bolaamphiphilic compounds,21 a derivative of phenylalanine22 and some organogelators.23 The synthesis of compounds (SucValHex, SucValOct, GltValHex and GltValOct) is simple and efficient, following a commonly synthetic route used by the group. Scheme 3-1 shows the steps and reagents that were used to prepare these compounds. Structural characterization of the compounds includes 1H, 13C, and mass spectra. In addition, 1H and 13C signals were assigned with the aid of 2D methods (COSY, HSQC and HMBC). Full details on synthesis and characterization are included in Experimental Section (see Chapter 5, pp. 49-55) and Spectra Section (see Chapter 6, pp. 57-66).. 21. M. Fontanillo, C. A. Angulo-Pachón, B. Escuder and J. F. Miravet, J. Colloid Interface Sci., 2013, 412, 65-71. 22 C. A. Angulo-Pachon and J. F. Miravet, Chem. Commun., 2016, 52, 5398-5401. 23 C. A. Angulo-Pachón, C. Gascó-Catalán, J. J. Ojeda-Flores and J. F. Miravet, ChemPhysChem, 2016, 17, 1-6.. 15.
(39) Diego Navarro Barreda. Scheme 3-1. Reagents and conditions: a) DCC, N-hydroxysuccinimide, THF, 2 h, 94 - 97%; b) n-hexylamine or n-octylamine, THF, 16 h, 93 - 98%; c) Pd/C, H2, MeOH, 4 - 6 h, 90 - 98%; d) Succinic or glutaric anhydride, Na2CO3, THF, 16 h, 85 - 90%.. The first step consists of an activation of ZValOH to form activated ester ZValOSu as reported previously.23 The activated acid was coupled with n-hexylamine or noctylamine to form the compounds ZValC6 and ZValC8, respectively. Then, the removal of the Cbz group was performed by hydrogenolysis using Pd/C as catalyst, obtaining the amines HValC6 and HValC8. Finally, the amines and succinic anhydride were mixed under mild basic conditions,24 producing the final compounds I and III, or were mixed with glutaric anhydride, producing the final compounds II and IV.. 24. A. Detsi, M. Micha-Screttas, O. Igglessi-Markopoulou, J. Chem. Soc., Perkin Trans. 1, 1998, 2443-2450. 16.
(40) Chapter 3: Results and Discussion. Figure 3-1 shows the succinic acid and glutaric acid derivatives prepared for the studies carried out in the present project. All of them were successfully prepared by the proposed route and characterized using common techniques.. Figure 3-1. Compounds synthesized in the present project.. 3.2 Gelation studies In order to know which is the capability of each compound to form a gel one of the parameters that is necessary to know is the minor quantity required of each products to form a gel in the solvent (usually at 25 oC). This parameter is named minimum gelator concentration (mgc). Moreover, it was reported that, in this complex self-assembled systems, a "simple" low-molecular weight gelator could exhibit different packing arrangements upon very slight modification of the environmental parameters (as temperature, aging time, ultrasounds...). 25 Such structural differences can result in different morphologies of the microscopic objects and different physical, chemical, or rheological properties.. 25. S. Díaz-Oltra, C. Berdugo, J. F. Miravet, B. Escuder, New J. Chem. 2015, 39, 3785. 17.
(41) Diego Navarro Barreda. Conformational polymorphism is of course intrinsic to many self-assembled systems; hence, one should control experimental parameters in order to avoid unexpected and/or non-reproducible results.26 As described, the method used to determine the mgc was the Tube Inversion Methodology, because this method provided a fast test to identify the formation of a gel. But before determining the mgc, one must choose the method of gelation to be used. There are many methods; some of these are shown below.. 3.2.1 Heating-cooling method It is the classic method for the preparation of molecular gels. This method consists of heating the gelator in an appropriate solvent and cooling the resulting isotropic supersaturated solution to room temperature. When the hot solution is cooled, the molecules start to self-assemble forming the gel. Clearly, this method was not used in this project since the molecules of the gelator are hydrolyzed by heating (see Section 3.4.2, pp. 30-31).. 3.2.2 pH change method It is another method widely used for the preparation of gels. Taking advantage that the molecules have an acid group, the first step is to dissolve the product with a basic solution (pH 12 approx.), and the resulting solution is treated with the amount needed of acid to neutralize the base added previously. When the solution becomes acidic, the product is protonated again and the aggregation process is triggered, yielding a gel. There are two ways to add the acid. The first one by the direct addition of an acid solution (hydrochloric acid, buffer of acid pH, etc.). The second one is by the addition of an acid precursor, such as, glucono delta-lactone (GDL), also known as gluconolactone. At high pH, gluconolactone is partially hydrolysed to gluconic acid (see Figure 3-2). By the use of gluconolactone, very translucent and reproducible gels can be. 26. A. J. Cruz-Cabeza, J. Bernstein, Chem. Rev. 2014, 114, 2170. 18.
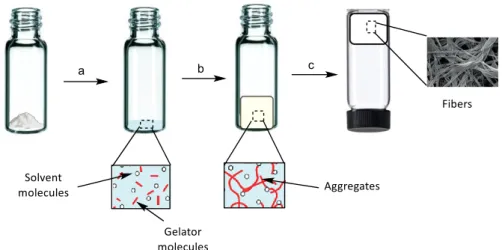
(42) Chapter 3: Results and Discussion. obtained27, which is an important feature when one wants to make spectroscopic measurements.. Figure 3-2. Hydrolysis of gluconolactone to gluconic acid.. However, in carrying out the liberation studies, several dye-related problems arose because the dyes are sensitive to pH changes (see Section 3.5.1, pp.38-43).. 3.2.3 Precipitation method Basically, this process is to dissolve the gelator in a small amount of a suitable solvent (step a) and subsequently add a solvent in which the gelator is partly soluble (step b). The result is an aggregation process, yielding a gel (step c) (see Figure 33).. Figure 3-3. Graphic representation of gelation by precipitation method.. 27. M. Tena-Solsona, B. Escuder and J.F. Miravet, Chem. Mater., 2015, 27, 3358−3365. 19.
(43) Diego Navarro Barreda. The method of precipitation was the method chosen to form the gels in the present study, since as will be seen later, this presents a series of advantages in front of the other two (pH change and heating-cooling method).. 3.2.4 Determination of minimum gelation concentration (mgc) To determine the mgc values reported in Figure 3-4, 10 mg of the studied compounds were weighted inside of a cylindrical glass vial (diameter = 1.5 cm), then 100 μL of DMSO was added and the system sonicated until complete dissolution of the compounds. At this point 900 µL of distilled water were added. The closed vial was allowed to stand at room temperature until formation of gel (between 10 - 20 minutes). The formation of a gel was checked by turning the vial upside down. This procedure was repeated for different decreasing amounts of gelator (1.0 and 0.5 mg steps) until gel formation was not observed.. Compound SucValHex (I) GltValOct (II) SucValOct (III) GltValHex (IV). mgc 18 mM 5 mM 6 mM Gel not formed. Figure 3-4. (Left) Pictures gels of compounds I, II and III in H2O:DMSO (9:1) at minimum gelation concentration. (Right) mgc values obtained for I-IV.. 3.2.5 Partition coefficient studies A partition-coefficient (P) is the ratio of concentrations of a compound in a biphasic mixture formed by two equilibrium immiscible solvents. Since partition-coefficient measured can range over many orders of magnitude (10-2 to 106), it is usually expressed as its decadic logarithm, log P.. 20.
(44) Chapter 3: Results and Discussion. Most commonly, one of the solvents is water while the second is hydrophobic such as 1-octanol. For this case, the partition coefficient on a substance X at a given temperature is defined by,. As one of the solvents is water and the other is a non-polar solvent, then the partition coefficient measures how hydrophilic ("water-loving") or hydrophobic ("water-fearing") a chemical substance is.28 Moreover, as we can see in the equation 1, the partition-coefficient generally refers to the concentration ratio of un-ionized species. Therefore, to measure the partition coefficient of ionizable solutes, the pH of the aqueous phase is adjusted such that the predominant form of the compound in solution is the un-ionized, or its measurement requires consideration of all species, un-ionized and ionized. Partition coefficients are useful in estimating the distribution of drugs within the body. Hydrophobic drugs with high octanol/water partition coefficients are mainly distributed to hydrophobic areas such as lipid bilayers of cells. Conversely, hydrophilic drugs (low octanol/water partition coefficients) are found primarily in aqueous regions such as blood serum.29 However, there are many situations where prediction of partition coefficients prior to experimental measurement is useful. Estimates of partition coefficients can be made using a variety of methods. One of the most common uses a group contribution method, and is termed ClogP.30 It has been shown that the log P of a compound can be determined by the sum of its non-overlapping molecular fragments (defined as one or more atoms covalently bound to each other within the molecule) using a statistical method. This method. 28. J. Sangster, J. Phys. Chem. Ref. Data, Vol.18, No.3, 1989. Shargel L, Susanna W, Yu AB, Applied Biopharmaceutics & Pharmacokinetics, 6th ed., New York: McGraw-Hill Medical, 2012. 30 Hansch C, Leo A, Substituent Constants for Correlation Analysis in Chemistry and Biology. New York: John Wiley & Sons Ltd., 1979. 29. 21.
(45) Diego Navarro Barreda. in general gives good results, but cannot be used to predict partition coefficients for molecules containing unusual functional groups for which the method has not yet been parameterized (most likely because of the lack of experimental data for molecules containing such functional groups). The partition coefficient, ClogP, of the studied compounds was theoretically calculated using the ChemBioDraw Ultra 14.0 and the values are showed in the following table: Table 3-1. CLog P values of studied compounds. Compound. Clog P. SucValHex (I). 2.4. GltValOct (II). 3.7. SucValOct (III). 3.4. GltValHex (IV). 2.6. As it can be deducted from the equation 1, if a compound has a greater log P value, it will be more hydrophobic and less soluble in water, and therefore, smaller compound concentration will be needed to form the gel. This assumption is in good agreement with the obtained results. Clearly, SucValOct has a higher efficiency of gelation of in comparison to SucValHex because of its more hydrophobic character (ClogP values are respectively 3.4 and 2.3). It is also confirmed that the GltValOct and SucValOct have practically the same value of ClogP, and that is reflected in a very similar mgc. However, although the ClogP is a useful value for predicting the gelation efficiency of a compound, it is not a determinant value. We must keep in mind that many other factors and variables are involved in the gelation process, not only this hydrophobic/hydrophilic character. This fact is reflected in GltValHex, because it does not form gel despite having a value similar to SucValHex.. 22.
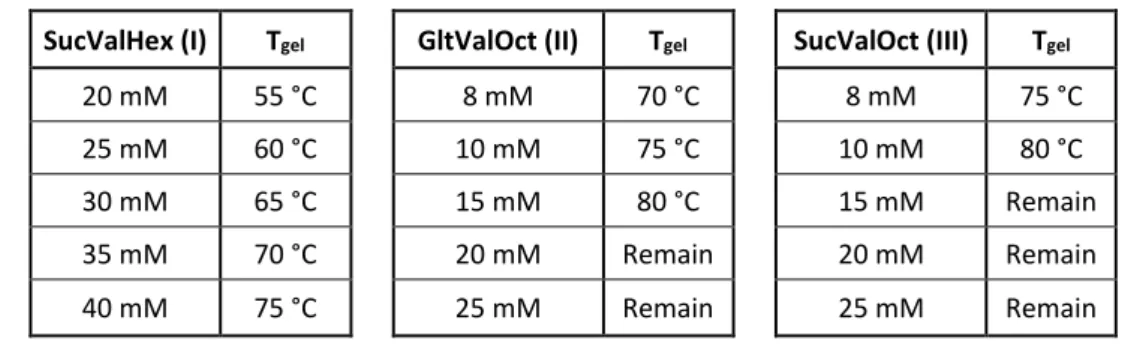
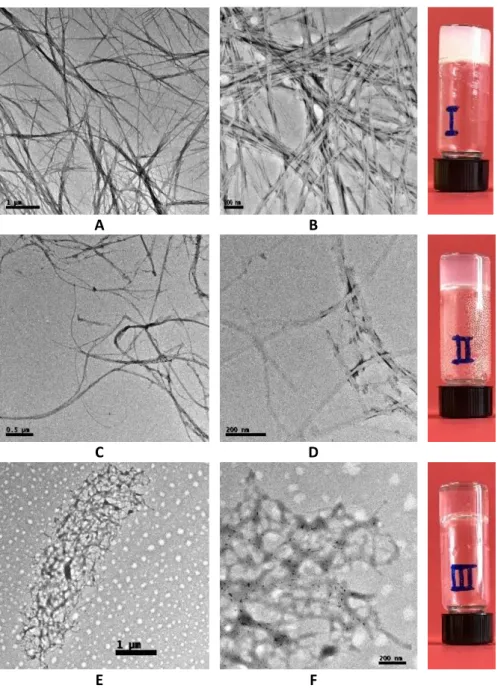
(46) Chapter 3: Results and Discussion. 3.2.6 Gel-to-solution transition temperature (Tgel) Another essential parameter to evaluate the resistance of a gel is the gel-tosolution transition temperature (Tgel). This is the temperature at which the gel is converted into a sol on slow heating. Gels at different concentrations (above mgc) were prepared using the precipitation method 9:1 H2O/DMSO. Once the gels are formed, the vials were introduced into a thermoregulated water bath at 30 oC waiting for 10 minutes before checking the stability of the gels by the Tube Inversion Test. This procedure was repeated increasing 5 degrees (until 80 oC) each time. The temperature at which the gels are broken is recorded. Table 3-2. Values obtained for Tgel of compounds I, II and III SucValHex (I). Tgel. GltValOct (II). Tgel. SucValOct (III). Tgel. 20 mM. 55 °C. 8 mM. 70 °C. 8 mM. 75 °C. 25 mM. 60 °C. 10 mM. 75 °C. 10 mM. 80 °C. 30 mM. 65 °C. 15 mM. 80 °C. 15 mM. Remain. 35 mM. 70 °C. 20 mM. Remain. 20 mM. Remain. 40 mM. 75 °C. 25 mM. Remain. 25 mM. Remain. Since GltValHex (IV) does not form gel, this compound was not studied here.. 3.3 Transmission electron microscopy (TEM) The microscopic structure of the hydrogels formed by compounds I-III was studied by transmission electron microscopy (see Figure 3-5).. 23.
(47) Diego Navarro Barreda. A. B. C. D. E. F. Figure 3-5. Transmission electron microscopy (TEM) images obtained from gels of compounds prepared by precipitation of DMSO dissolution in water (9:1 H 2O/DMSO). A - B SucValHex (18 mM); C - D GltValOct (5 mM) and E - F SucValOct (6 mM).. 24.
(48) Chapter 3: Results and Discussion. Transmission electron microscopy (TEM) images of the corresponding xerogels revealed an entanglement of self-assembled fibrillar objects observed commonly in molecular gels. Moreover, the general trend that relates the size and the length of the fibers with the opacity of the gel is also fulfilled. In effect, SucValHex, which presents the longest and widest fibers, forms the most opaque gel. Followed by GltValOct, whose fibers are narrower, forms gels more translucent. Finally, SucValOct, which has the smallest fibers, and as result it forms practically transparent gels. Full details on sample preparation as well as the equipment used are included in Experimental Section (see Chapter 5, pp. 56).. 3.4 NMR studies 3.4.1. Solubility determination. To evaluate the temperature responsive nature of the hydrogels VT-NMR studies of the solubility of the gel network were performed. For this purpose, the integration of the 1H-NMR signals of free gelator that coexists with the fibrillar network (NMR-silent) was evaluated at different temperatures. In fact, equilibrium exists in a gel between the molecules of the compound forming part of the fibres and those that stay in solution.31 The constant that governs this equilibrium is the solubility constant (Ks) (see Figure 3-6).. Figure 3-6. Equilibrium solution-gel.. 31. B. Escuder, M. Llusar and J. F. Miravet, The Journal of Organic Chemistry, 2006, 71, 77477752. 25.
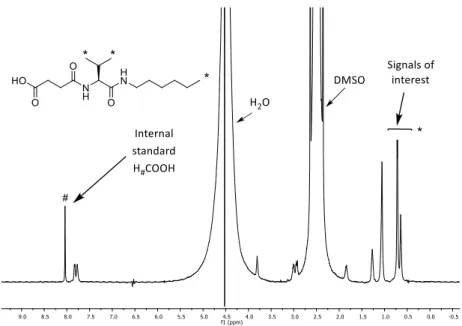
(49) Diego Navarro Barreda. The gels (20 mM SucValHex, 10 mM GltValOct and 10 mM SucValOct) were prepared inside of the NMR tube using the precipitation method above described (see Section 3.2.3, p. 19), using an internal standard for integration (formic acid, 0.5 % v/v, 99 %). Once the gel is formed the PRESAT spectra is recorded at different temperatures (30 oC to 85 oC, every 5 oC), letting the system stabilize at the selected temperature for 10 minutes. Finally, the gel is fully disassembled by addition of NaOH. As the temperature increases the solubility raises and the intensity of the signals of soluble molecules increases, too. Meanwhile, the intensity of the signal from the internal standard remains constant. Relative integration of the internal standard to gelator signals (the signals of interest are those that are well defined and are not overlapped by the solvent, in our case, the methyl groups of valine and methyl unit of the aliphatic chain) provided the concentration of soluble gelator at the different temperature values assayed. One of these spectra obtained in the solubility study is showed in Figure 3-7.. Figure 3-7. Spectrum of SucValHex 20mM at 30 oC obtained in the solubility study.. 26.
(50) Chapter 3: Results and Discussion. Since this constant (Ks) is equal to the concentration of the compound dissolved in the solvent (see equation 2), it is possible to know the solubility of the compounds at different temperatures.. The equation 3 permits to calculate de concentration of soluble species. There Igel is the integral of the one signal of the compound taking into account the ratio in number of protons between the internal standard and this signal; Igel totally dissolved is the integral of the same signal chosen in the compound when the gel has been broken with NaOH and [C]gel totally dissolved corresponds to the concentration when all the gelator is solubilized. As it can be seen in Figure 3-8 and 3-9, the solubility of both SucValHex (ca. 1 mM) and SucValOct (ca. 0.03 mM) is poorly temperature dependent, being almost constant in the range 30 - 60 oC. Above 60 oC a moderate solubility increase is detected, reaching values that are far below the mgc value at 25 oC. 4 3,5. Ks (mM). 3. 2,5 2 1,5 1 0,5. 0 25. 35. 45. 55. 65. 75. 85. T (oC). Figure 3-8. Variation of the solubility in water-DMSO (9:1) of the hydrogels formed by SucValHex.. 27.
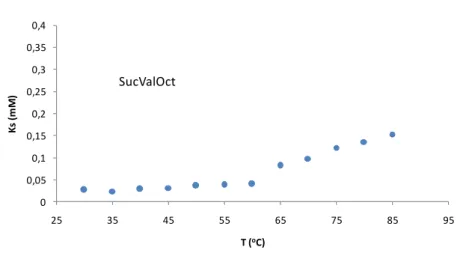
(51) Diego Navarro Barreda. 0,4. 0,35. Ks (mM). 0,3 0,25. 0,2 0,15 0,1. 0,05 0. 25. 35. 45. 55. 65. 75. 85. 95. T (oC). Figure 3-9. Variation of the solubility in water-DMSO (9:1) of the hydrogels formed by SucValOct.. Thermodynamically this behavior indicates a practically null enthalpic component in the aggregation-dissolution equilibrium of the gel network, being the system entropically controlled. In fact, once the solubility constants are obtained, considering Van’t Hoff equation, it is possible to determine enthalpy (H) and entropy (S) associated to the solubilisation of each compound (see equation 4). The results were in good agreement with the behaviour described.. Such behavior has been reported previously in hydrogels and reflects the dramatic relevance of hydrophobic forces in comparison to intermolecular H-bonding for aggregation processes taking place in water.32 Besides, studies of the solubility were performed only for glutaric acid derived gelators GltValOct (see Figure 3-10), because GltValHex does not form gel, as described before.. 32. V. J. Nebot, J. Armengol, J. Smets, S. F. Prieto, B. Escuder and J. F. Miravet, Chem. Eur. J., 2012, 18, 4063-4072. 28.
(52) Chapter 3: Results and Discussion. Ks (mM) Ks(mM). 11 0,9 0,9 0,8 0,8. 0,7 0,7 0,6 0,6 0,5 0,5 0,4 0,4 0,3 0,3 0,2 0,2 0,1 0,1 00 25 25. 35 35. 45 45. 55 55. 65 65. 75 75. 85 85. 95 95. T (oC). T (ºC). Figure 3-10. Variation of the solubility in water-DMSO (9:1) of the hydrogels formed by GltValOct.. As it can be seen in Figure 3-10, the solubility of GltValOct is poorly temperature dependent, like the succinic acid analogues. However, in these cases, the increase of solubility is almost uniform in entire temperature range without any change of slope so pronounced as in the previous cases. Hence, it can be concluded that GltValOct is more stable against temperature and it does not suffer alterations when the temperature increases. In Table 3-3, it is shown the solubility of each compound at 25 oC. Theoretically, when the compound presents a higher value of solubility it means that the formation of the gel is less favorable because the compound prefers, thermodynamically speaking, being dissolved instead of taking part of the gel network.. Table 3-3. Solubility (mM) and mgc (mM) of compounds I-III at 35 oC. Compound. Solubility. mgc. SucValHex (I). 0.75. 18. GltValOct (II). 0.08. 5. SucValOct (III). 0.03. 6. 29.
(53) Diego Navarro Barreda. In the Table 3-3, is observed that for GltValOct and SucValOct have a lower value of solubility, then these ones are better gelators than SucValHex and this is verified with the mgc of each one.. 3.4.2 Study of hydrolytic stability As described, molecular hydrogels formed by pseudopeptidic derivatives of L-valine and succinic acid suffer a thermal deamidation reaction, leading to partial disassembly. As shown in Figure 3-11 and Figure 3-12, after thermal treatment some signals of the new products such as the one corresponding to the chiral proton of the valine moiety or that from the free succinic acid are visible.. Figure 3-11. 1H-NMR spectra of SucValOct before (bottom) and after (top) heating at 80 oC in D2O for 18 hours.. 30.
(54) Chapter 3: Results and Discussion. Figure 3-12. 1H-NMR spectra of SucValHex before (bottom) and after (top) heating at 80oC in D2O for 18 hours.. Considering the robustness of amide bonds, its lability in the studied compounds is remarkable. It was considered that the succinic acid-derived moiety present in the gelators was responsible of intramolecular catalysis of a deamidation reaction. This intramolecular attack of the carboxylic acid to the amide carbonyl group would yield a tetrahedral intermediate that evolves to the excision of the molecule into the corresponding amine and succinic anhydride, which would be subsequently hydrolyzed into succinic acid (see proposed tentative mechanism at Scheme 3-2). 31.
(55) Diego Navarro Barreda. Scheme 3-2. Simplified mechanism proposed for the deamidation reaction.. To gain support for the proposed neighbouring effect the glutaric acid-derived analogue was studied. This molecule was found to be completely stable to hydrolysis in the same conditions for several hours (see Figure 3-13). Such dramatic difference when compared to derivatives of succinic acid supports the intramolecular catalysis of the deamidation reaction. It seems reasonable that the presence of an additional methylene unit affords less thermodynamically stable cyclic intermediate for entropic reasons.. Figure 3-13. 1H-NMR spectra of GltValOct before (bottom) and after (top) heating at 80oC in D2O for 18 hours.. 32.
(56) Chapter 3: Results and Discussion. A precedent in the literature related to this reactivity described an intramolecular nucleophilic catalysis in the hydrolysis of monophenyl esters of succinic and glutaric acid. It was found that the formation of intermediate anhydrides in the ester hydrolysis reaction was 230 times faster in the succinate ester when compared to glutarate ester.33 Moreover, it is assumed that the deamidation reaction occurs exclusively in the free molecules of gelator and not in the aggregates of the fibers; hence, it was proposed that the thermodynamic equilibrium of the deamidation reaction was regulated by the efficiency of hydrogelation. The stabilization towards hydrolysis in gel fibers has been reported in a few cases.34,35 Additionally, it was checked that after 18 hours the reaction progress was stabilized, reaching a thermodynamic equilibrium. In order to assess how the efficiency of hydrogelation regulates the thermodynamic equilibrium of the deamidation reaction, the simple model compound SucHex, and the glutaric acid-derived analogue, GltHex, which are soluble in water in the studied concentrations, was studied (see Figure 3-14). These compounds were synthesized by Celia M. Rueda as part of her final degree experimental work, so their synthesis and characterization will be presented elsewhere.36. Figure 3-14. Structures of model compounds.. 33. T. C. Bruice and U. K. Pandit, J. Am. Chem. Soc., 1960, 82, 5858-5865. K. J. C. Van Bommel, M. C. A. Stuart, B. L. Feringa and J. Van Esch, Org. Biomol. Chem., 2005, 3, 2917-2920. 35 C. G. Pappas, R. Shafi, I. R. Sasselli, H. Siccardi, T. Wang, V. Narang, R. Abzalimov, N. Wijerathne and R. V. Ulijn, Nat. Nanotech., 2016, 11, 960-967. 36 C. M. Rueda, "Studies of biomimetic deamidation in model compounds derived from succinic and glutaric acids”, Chemistry Degree Research Project, 2017, Universitat Jaume I, Castellón de la Plana, Spain. 34. 33.
(57) Diego Navarro Barreda. After 18 hours at 80 oC, SucHex is almost completely hydrolyzed affording hexylamine and succinic acid as revealed by 1H-NMR analysis (see Figure 3-15) and, as expected, GltHex (see Figure 3-16) showed no degradation at all after thermal treatment for several hours.. Figure 3-15. Partial 1H NMR spectra of SucHex before (bottom) and after (top) heating at 80 oC in D2O for 18 hours.. Figure 3-16. Partial 1H NMR spectra of GltHex before (bottom) and after (top) heating at 80 oC in D2O for 18 hours. 34.
(58) Chapter 3: Results and Discussion. The results show that in the case of SucValHex and SucValOct the reaction is far from completion in opposition to the case of SucHex. A thermodynamic equilibrium is reached which affords 53% and 17% overall conversion for SucValHex and SucValOct, respectively. Meanwhile, SucHex hydrolysis degree is 90%. Taking into account that the phenomenon of solubility and the hydrolysis reaction are present in this system, together with the existence of succinic anhydride in equilibrium with succinic acid in aqueous solution, it is proposed that three different equilibria coexist (see Scheme 3-4). . . The solubility equilibrium because molecular gels are dynamic supramolecular systems in which free molecular entities and aggregates are in equilibrium. The hydrolysis equilibrium because the free amine group is able to react with succinic anhydride, reversing the hydrolysis reaction. The equilibrium of succinic anhydride with succinic acid. The existence of succinic anhydride in equilibrium with succinic acid in aqueous solution has been demonstrated in the literature.37. The overall reaction would be:. Scheme 3-3. Overall reaction of the studied system.. Where:. 37. T. Higuchi, L. Eberson and J. D. McRae, J. Am. Chem. Soc., 1967, 89, 3001-3004. 35.
(59) Diego Navarro Barreda. Scheme 3-4. Equilibria present in the studied system.. 36.
(60) Chapter 3: Results and Discussion. As shown in Scheme 3-4, it is proposed that the low hydrolysis degree at equilibrium of SucValHex and SucValOct when compared to SucHex can be explained considering their different hydrogelation capabilities because the aggregation of the hydrogelators would compete thermodynamically with amide hydrolysis. The correlation between gelation and deamidation efficiency can be rationalized considering a system as that described in Scheme 3-4. Where, solubility constant regulates the thermodynamics of aggregation (Ks) and a hydrolysis constant (Kh) is associated to the deamidation reaction. For convenience, an apparent constant Kapp is defined which considers the overall conversion of the gelator (free and aggregated) to the hydrolysis products. Figure 3-17 shows the simulated dependence of the overall hydrolysis constant (Kapp) with the solubility of the gelator (log Ks) for a model system similar to those studied experimentally. This simulated dependence was calculated using HYSS2009 v. 4.0.31, a program for the simulation and speciation of chemical equilibria.38 For the simulation the constant Ks was varied keeping a Kh value of 0.7, which is a reasonable value for the studied system according the experimental results in Table 3-4 (discussed later).. 103 Kapp. 100. 50. 0 -4.75. -4.5. -4.25. -4. -3.75. -3.5. log Ks. Figure 3-17. Simulation of the relationship between hydrogel solubility (log Ks) and apparent deamidation constant (Kapp) using a Kh value of 0.7 (see Scheme 3-3 and 3-4 for the definition of Kapp and Kh).. 38. L. Alderighi, P. Gans, A. Ienco, D. Peters, A. Sabatini and A. Vacca, Coord. Chem. Rev., 1999, 184, 311-318. 37.
(61) Diego Navarro Barreda. An exponential dependence of the deamidation degree (Kapp) on the solubility of the species is observed. Therefore, it is concluded that lower solubility, namely, more efficient hydrogelation, results in stabilization of the hydrogelator and reduced hydrolysis. The experimental results are summarized in Table 3-4. There, the apparent deamidation equilibrium constant, Kapp, is compared to the solubility of the compounds.. Table 3-4. Comparison of solubility data and equilibrium constants for the deamidation process at 80 oC in D2O. Compound. Solubility (mM). [amide]0 (mM). [amide]eq (mM). Yield of amine (%). 103 x Kapp. SucHex. > 25. 25. 2.5. 90. 170. SucValHex. 2.3. 16. 7.5. 53. 9.6. SucValOct. 0.15. 15. 12.4. 17. 0.6. The results show that compound SucHex, which is fully soluble and shows no aggregation in the concentration range assayed, presents a Kapp value of 170, which is roughly one order of magnitude higher than that of SucValHex. Noteworthy, SucValHex presents a Kapp value notably higher that than of SucValOct (9.6 and 0.6 respectively). Such difference can be correlated with their hydrogelation capabilities (mgc values are 18 mM and 6 Mm respectively) and the notable differences in their solubility at 80 oC (2.3 and 0.15 mM respectively).. 3.5 Controlled release studies From an applied point of view, the lability of the molecular hydrogelators could find application for the controlled release of actives. It was envisaged that thermal deamidation could potentially be used for controlled progressive release of species entrapped in the hydrogels. This approach would represent an interesting alternative for thermally triggered release for molecular hydrogels whose assembly is weakly temperature sensitive 38.
(62) Chapter 3: Results and Discussion. such as those reported here (no significant change in solubility with temperature, as shown in Figure 3-8, 3-9 and 3-10).. 3.5.1 Optimization The first objective, to carry out the controlled release studies was to choose the species to be released. It was proposed that this specie would be a dye for three reasons: 1. The release of the dye could be easily monitored by UV-Vis spectroscopy. 2. Several studies using dyes have already been done previously in the research group; hence, the group have experience in these types of species.39 3. Most of these molecules are cheap and easily available. In fact, the use of dye is common for evaluating the release behaviour of a wide range of systems and for demonstrating the applicability of a given system for localised drug delivery applications.. 3.5.1.1. Methyl orange. Methyl orange (MO) is an anionic dye with a low molecular weight (Figure 3-18). This compound has been used commonly as model drug and good results were published.40 For that reason, we select it.. 39. Berdugo C., 2015. "Fundamental studies and applications of molecular gels formed by peptide derivatives", Ph. D. Thesis, Universitat Jaume I, Castellón de la Plana, Spain. 40 N. M. Kenna, P. Calvert, A. Morrin, G. G. Wallace and S. E. Moulton, J. Mater. Chem. B, 2015, 3, 2530. 39.
(63) Diego Navarro Barreda. Figure 3-18. Structure of methyl orange.. However, methyl orange is a pH indicator like most dyes. Specifically, its transition range is 3.1 - 4.4. Hence, as our final samples have a pH close to this transition range, this dye is not appropriate for the release studies. Another aspect, but not less important, is that methyl orange is a toxic compound so its handling is another drawback.. 3.5.1.2. Crystal violet. At this point, we decided to look for a dye that would not be affected by the changes in pH intrinsic to the method (from 3 to 12), i.e., a dye whose transition range was far from these pH values. It was proposed that the solution to this problem could be the crystal violet (see Figure 3-19), because its transition range was -1.0 - 2.0.. Figure 3-19. Structure of crystal Violet.. Unexpectedly, a new problem arose. At very basic pH, the dye is attacked by the hydroxyl ion, losing the conjugation and becoming colorless (see Figure 3-20).. 40.
(64) Chapter 3: Results and Discussion. Figure 3-20. Reaction of crystal violet at basic pH.. Although the samples were subsequently acidified, the reaction was not reversed, so the solution did no recover the coloration. Therefore, we had to discard this dye, too. As the previous dye, Crystal Violet is another toxic compound so its handling is a drawback when choosing this compound to perform the release tests.. 3.5.1.3. Orange II. Orange II, also known as acid orange 7 (see Figure 3-21), is a non-hazardous substance. In effect, this dye is widely used in the formulation of hair coloring products. Orange II is allowed for use in cosmetic products except those intended to be applied near the eyes.. Figure 3-21. Structure of orange II.. 41.
(65) Diego Navarro Barreda. Several tests were performed: at basic pH (around 12) and at acid pH (around 3), and it was observed that the dye solution was unaffected. In this way we thought that we had found the optimal dye, since it did not suffer alterations in the working pH range. However, it was observed that the dye had a higher affinity for water than for the fibers, probably due to the presence of the sulfonate group (see Figure 3-21). Therefore, it was proposed that the release of the dye was controlled by the affinity of the dye for the water, i.e. the release was not due to hydrolysis breakdown. Thus, incoherent results were obtained, since it was diffusion-controlled release rather than due to hydrolytic breakdown.. 3.5.1.4. Rose bengal. Rose bengal is another type of dye (see Figure 3-22). Its sodium salt is commonly used in eye drops to stain damaged conjunctival and corneal cells and to identify damage to the eye. Moreover, rose bengal is a well-known photosensitizer and sonosensitizer used in photodynamic and sonodynamic therapy, respectively, for the treatment of certain cancers.41 So, Rose Bengal is classified as a non-dangerous specie.. Figure 3-22. Structure of rose bengal disodium salt.. 41. (a) Y.-S. Kim, V. Rubio, J. Qi, R. Xia, Z.-Z. Shi, L. Peterson, C.-H. Tung, B. E. O'Neill, Journal of Controlled Release, 2011, 156, 315–322. (b) Nami Sugita, Ken-ichi Kawabata, Kazuaki Sasaki, Isao Sakata, and Shin-ichiro Umemura, Bioconjugate Chem., 2007, 18, 866−873. 42.
(66) Chapter 3: Results and Discussion. Unlike orange II, it has been reported that rose bengal does have affinity for fibers.42 Therefore, if the hydrolysis reaction occurs, the equilibrium would shift toward the disassembling of the fibers (see Scheme 3-4). As a consequence, the dye could no longer be retained. The result would be expressed by an increase in absorbance (see following).. 3.5.2 UV/Vis measurements To carry out the release experiments, 2.5 mL of gels of the GltValOct (6 Mm, i.e., 20% above mgc) and SucValOct (7.2 Mm, i.e., 20% above mgc) were prepared by the DMSO/H2O (1:9) precipitation method inside a vial of 8 mL using a stock solution 0.2 mM of rose bengal in water. Then, gels were washed addition of 2.5 mL of distillated and centrifuged at 6000 r.p.m during 30 minutes, the supernatant was discarded. This procedure was repeated by addition of more water (2.5 mL by step), until the supernatant observed was colorless (5 steps), (see Figure 3-23). Finally, 2.5 mL of distilled water were placed on the top of the washed gels; the vials were sealed and allocated inside of a thermostatic bath. The experiments were carried out at 60 oC, a temperature that preliminary assays revealed to be appropriate for observing significant results during a period of a few hours. Aliquots of 1.4 mL were measurement at different times. The aliquots were placed back into the vials after each measurement. Full details in spectrophotometric measurement as well as the equipment used are included in Experimental Section (see Chapter 5, Pag.56). As can be seen, the release assays were not performed with SucValHex. The reason was that it was solubilized (slowly) during washing and prolonged heating to 60 oC, and dye release from gelator hydrolysis or solubilization could not be distinguished. In addition, since GltValHex did not gel, it was not consistent to carry out the release tests with SucValHex, because we would not have the glutaric acid analogue in order to compare the results.. 42. B. P. Chan, O. C. M. Chan K.-F. So, Acta Biomaterialia, 2008, 4, 1627–1636. 43.
(67) Diego Navarro Barreda. GltValOct (II). SucValOct (III). GltValOct (II). SucValOct (III). Figure 3-23. Left: Gels of compounds II and III with rose bengal 0.2 Mm after washes. Right: Pictures of the vials after water addition and heating at 60 oC.. The results of measurements at different times are shown in the following figures: 0.55. 0.4. SucValOct SucValOct. SucGltOct 0.3. 0.4. time. Abs. Abs. 0.2. 0.2 0.1. -0.01 450. 500. 550 Wavelength [nm]. 600. 625. -0.01 450. Figure 3-24. UV-Vis spectra recorded for the liberation of rose bengal from hydrogel of SucValOct at 60 oC.. 44. 500. Wa.
(68) 0.4. SucGltOct GltValOct 0.3. time. Abs. 0.2. time 0.1. 600. -0.01 450. 625. 500. 550 Wavelength [nm]. 600. 625. Figure 3-25. UV-Vis spectra recorded for the liberation of rose bengal from hydrogel of GltValOct at 60 oC.. Once the spectra were obtained at different times, a joint representation of absorbance vs. time for SucValOct and GltValOct was performed in order to observe a different release behavior in both compounds (see Figure 3-26).. 0.6. 0.4 Absorbance. 550 ngth [nm]. Chapter 3: Results and Discussion. 0.2. 0. 0. 100. 200. 300. time / min. Figure 3-26. UV-Vis evaluation of the liberation of rose bengal (0.2 mM) entrapped in hydrogels formed by SucValOct (crosses) and GltValOct (circles). Dotted and dashed lines are used as a guide for the eye.. 45.
(69) Diego Navarro Barreda. The results show an initial release burst, associated to the dye retained in the macroporous structure (the first 30 minutes). As expected, this behaviour is the same for both. However, after two hours, the behaviour was different: For SucValOct, a steady release of tightly adsorbed rose bengal was observed because of deamidation-promoted gel disassembly. Noteworthy, this effect is not observed for the analogue hydrogelator GltValOct, which, as mentioned above, is insensitive to deamidation and only liberates in an initial burst the dye weakly attached to the hydrogel.. 46.
(70) Chapter 4. Conclusions.
(71)
(72) Chapter 4: Conclusions. Chapter 4: Conclusions First of all, different compounds derived from succinic acid and glutaric acid were successfully prepared and characterized.. It was observed that the reported succinic acid-derived hydrogelators experimented a deamidation reaction as a result of intramolecular catalysis. It is proposed that such reactivity is related to that observed in protein deamidation taking place at peptide bonds which involve asparaginyl or aspartyl residues and to self-excision observed in inteins.. The deamidation reaction was found to be reversible and the equilibrium constant heavily dependent on the hydrogelation efficiency of the studied molecules. The results revealed how the intrinsic reactivity of a pseudopeptidic molecule could be finely tuned by controlling its hydrogel formation capabilities.. The studied system provides insight into the use of hydrogelation processes to develop smartly regulated dynamic systems with biochemical reminiscence in the context of controlled release applications. On the applied side, thermally promoted deamidation was shown to permit controlled release of actives entrapped in the hydrogel such as rose bengal.. 47.
(73)
(74) Chapter 5. Experimental Section.
(75)
(76) Chapter 5: Experimental Section. Chapter 5: Experimental Section 5.1 Synthesis and Characterization 5.1.1 General considerations 1. H-NMR and 13C-NMR spectra were recorded on Agilent VNMR System spectrometer (500 MHz for 1H-NMR, 125 MHz 13C-NMR) or Bruker Avance III HD spectrometers (400 MHz and 300 MHz for 1H-NMR, 101 MHz and 75 MHz for 13CNMR). Signals of the deuterated solvent (DMSO-d6 in all the cases unless otherwise indicated) were taken as the reference.1H-NMR chemical shifts (δH) and 13C-NMR chemical shifts (δC) are quoted in parts per million (ppm) downfield from trimethylsilane (TMS) and coupling constants (J) are quoted in Hertz (Hz). Abbreviations for NMR data are s (singlet), d (doublet), t (triplet), q (quartet), quin (quintet), m (multiplet) and arom (aromatic). 1H and 13C signals were assigned with the aid of 2D methods (COSY, HSQC and HMBC). Reactions which required an inert atmosphere were carried out under N2. Commercially available reagents and HPLC grade solvents were used as received. Mass spectra were run by the electro-spray mode (ESMS). Masses spectra were recorded at Mass Spectrometry triple Quadrupole Q-TOF Premier (Waters) with simultaneous Electrospray and APCI Probe.. 49.
(77) Diego Navarro Barreda. 5.1.2 Synthetic scheme. Scheme 5-1. Reagents and conditions: a) DCC, N-hydroxysuccinimide, THF, 2 h, 94 - 97%; b) n-hexylamine or n-octylamine, THF, 16 h, 93 - 98 %; c) Pd/C, H2, MeOH, 4-6 h, 90 – 98 %; d) succinic or glutaric anhydride, Na2CO3, THF, 16 h, 85 - 90 %.. 5.1.3 Activation of amino acid L-valine (Step a) Carbobenzyloxy-L-valine acid (ZValOH) (40 mmol) and N-hydroxysuccinimide (40 mmol, 1.0 eq.) were dissolved in THF (150 mL). Once a clear solution had been obtained, N,N'-dicyclohexylcarbodiimide (DCC) (10.9 mmol, 1.01 eq.) in THF (75 mL) was added dropwise under N2 atmosphere at 0 °C with a dropping funnel. The resulting solution was further stirred for 1.5h at 0 °C. Elapsed time, the volume of the solution was reduced by rotary evaporator and the mixture was allowed to stand into refrigerator for 16h, which caused precipitation of N,N′dicyclohexylurea. After this time, the N,N'-dicyclohexylurea (DCU) formed was filtered off under vacuum and the filtrate was concentrated to dryness under. 50.
(78) Chapter 5: Experimental Section. reduced pressure. The crude product was purified by crystallization in 2-propanol to furnish a white product crystals, corresponding to activated ester.. - (S)-2,5-dioxopyrrolidin-1-yl ((benzyloxy)carbonyl)-L-valinate, (ZValOSu). A white solid was obtained (yield 97%); the NMR spectra were in good agreement with those described in the literature.43. 5.1.4 Coupling between activated esters and amines (step b) Carbobenzyloxy-L-valine activated ester (18.4 mmol, 1.0 eq.) was dissolved in THF (100 mL). A solution of commercially available n-hexylamine (20.3 mmol, 1.01 eq.) in THF (50 mL) was added dropwise under N2 atmosphere at 25°C with dropping funnel to the previous solution. The mixture was further stirred for 6 h at 55 oC. After this time, the mixture was cooled to room temperature and solvent was removed under reduced pressure and the white solid obtained was washed first with HCl 0.1 M (30 mL) twice, sonicating during 5 minutes and filtered under vacuum. Then was washed with KOH 0.1 M (30 mL). Finally, the product was washed with H2O until neutral pH and dried under reduced pressure at 50 oC overnight.. - (S)-benzyl (1-(hexylamino)-3-methyl-1-oxobutan-2-yl)carbamate (ZValC6):. J. Becerril, M. Bolte, M. I. Burguete F. Galindo, E. García-España, S. V. Luis and J. F. Miravet. J. Am. Chem. Soc. 2003, 125, 6677 – 6686. 43. 51.
(79) Diego Navarro Barreda. Compound ZValC6 was obtained (yield 93%) as a white solid. The NMR spectra were consistent with those described in the literature.44. - benzyl (S)-(3-methyl-1-(octylamino)-1-oxobutan-2-yl)carbamate, (ZValC8). Compound ZValC8, was obtained following the same procedure as above except that n-octylamine was used. A white solid was obtained (yield 95 %). 1. H NMR (400 MHz, DMSO-d6): δ 7.87 (t, J = 5.4 Hz, 1H), 7.42 – 7.28 (m, 5H, Harom), 7.20 (d, J = 8.8 Hz, 1H), 5.02 (s, 2H), 3.77 (dd, J = 8.8, 7.5 Hz, 1H), 3.15 – 3.03 (m, 1H), 3.02 – 2.91 (m, 1H), 2.00 – 1.82 (m, 1H), 1.46 – 1.32 (m, 2H), 1.32 – 1.15 (m, 10H), 0.89 – 0.79 (m, 9H). 13. C NMR (101 MHz, DMSO-d6): δ 170.8, 156.0 (C=O), 137.1 (C), 128.3, 127.7, 127.6 (CH), 65.3 (CH2), 60.3(CH), 38.3, 31.2, 30.2, 29.0, 28.6, 26.3, 22.1(CH2), 19.2, 18.2, 13.9 (CH3). HRMS (ESI): m/z calcd. for: C21H34N2O3 [M+Na+] = 385.2467 ; found = 385.2463.. 5.1.5 Removal of Cbz protecting group (step c) The corresponding N-benzyloxycarbonyl protected derivate and catalytic amount of Pd over activated carbon (10 % w/w) were placed in a two-necked round bottom flask and suspended in MeOH (4 mL/mmol) with stirring at room temperature. The system was purged to remove the air with N2 and connected to H2 atmosphere. The grey suspension was stirred until it turned completely black (4 - 6 h). The black mixture was filtered over Celite® and the solvent was evaporated under reduced pressure. The resulting oil was dried in vacuum pump to yield the respective amine. It was used in crude form for the next reaction.. 44. C. A. Angulo-Pachón and J. F. Miravet., Chem. Commun., 2016, 52, 5398 – 5401. 52.
(80) Chapter 5: Experimental Section. - (S)-2-amino-N-hexyl-3-methylbutanamide, (HValC6). Compound HValC6 was obtained (yield 98%) as a colourless oil. The NMR spectra were consistent with those described in the literature.44. - (S)-2-amino-3-methyl-N-octylbutanamide, (HValC8). Compound HValC8 was obtained (yield 95%) as a yellow waxy solid. 1. H NMR (400 MHz, DMSO-d6): δ 7.76 (t, J = 5.4 Hz, 1H), 3.14 – 2.96 (m, 2H), 2.88 (d, J = 5.3 Hz, 1H), 1.91 – 1.74 (m, 1H), 1.45 – 1.33 (m, 2H), 1.31 – 1.16 (m, 10H), 0.89 – 0.81 (m, J = 6.9, 3.3 Hz, 6H), 0.77 (d, J = 6.8 Hz, 3H). 13. C NMR (101 MHz, DMSO-d6): δ 174.3(C=O), 60.1(CH), 38.2, 31.6, 31.2, 29.2, 28.7, 28.6, 26.4, 22.1 (CH2), 19.5, 17.1, 13.9 (CH3). HRMS (ESI): m/z calcd. for: C13H28N2O [M+H+] = 229.2280 ; found = 229.2274.. 5.1.6 Reaction with anhydrides (step d) A solution of corresponding amine (1.0 eq.) in THF (30mL/mmol) was treated with K2CO3 (1.9 eq.) and was introduced in an ultrasonic bath for 10 min. The mixture was stirred for 15 min at 0°C under N2 atmosphere, and then a solution of succinic anhydride (2.0 eq.) in THF (6mL/mmol) was added dropwise. After the addition, K2CO3 (1.9 eq.) was added to the mixture at room temperature in order to achieve pH 9-10. The mixture was stirred vigorously for 16h at room temperature. After this time, the solution was concentrated under reduced pressure and the crude residue was dissolved in water (50 mL), then HCl concentrate was added at 0°C until the. 53.
(81) Diego Navarro Barreda. formation of a white precipitate at pH 3-4. The frothy white solution obtained was filtered off under vacuum, and the residue was washed with water until neutral pH. The compound was dried under reduced pressure at 50 ºC overnight.. - (S)-4-((1-(hexylamino)-3-methyl-1-oxobutan-2-yl)amino)-4-oxobutanoic (SucValHex, I). acid. Compound I was obtained (yield 94%) as a white solid. The NMR spectra were consistent with those described in the literature.44. - (S)-5-((3-methyl-1-(octylamino)-1-oxobutan-2-yl) amino)-5-oxopentanoic acid (GltValOct, II). Compound II was obtained (yield 85%) as a white solid. 1. H NMR (300 MHz, DMSO-d6): δ 7.96 (t, J = 5.4 Hz, 1H), 7.87 (d, J = 9.0 Hz, 1H), 4.07 (dd, J = 8.8, 7.4 Hz, 1H), 3.15 – 2.88 (m, 2H), 2.23 – 2.08 (m, 4H), 1.91 (dq, J = 13.6, 6.8 Hz, 1H), 1.69 (quin, J = 7.4 Hz, 2H), 1.45 – 1.33 (m, 2H), 1.33 – 1.15 (m, 10H), 0.84 (t overlapping a methyl doublet, J = 6.2 Hz, 3H), 0.81 (d overlapping a methyl triplet, J = 6.7 Hz, 6H) (carboxyl OH not detected). 13. C NMR (75 MHz, DMSO-d6): δ 174.6, 171.7, 170.9 (C=O), 57.9 (CH), 38.3, 34.4, 33.6, 31.2 (CH2), 30.4 (CH), 29.0, 28.7 (x 2), 26.3, 22.1, 21.1 (CH2), 19.2, 18.3, 13.9 (CH3). HRMS (ESI): m/z: calcd. for C18H34N2O4 [M + H+] = 343.2597; found = 343.2596.. 54.
(82) Chapter 5: Experimental Section. - (S)-4-((3-methyl-1-(octylamino)-1-oxobutan-2-yl) amino)-4-oxobutanoic acid, (SucValOct, III). Compound III was obtained (yield 91%) as a white solid. 1. H NMR (500 MHz, DMSO-d6): δ 12.00 (s, 1H), 7.84 – 7.78 (m, 2H), 4.07 (dd, J = 8.9, 6.9 Hz, 1H), 3.12 – 3.04 (m, 1H), 3.01 – 2.93 (m, 1H'), 2.45 – 2.38 (m, 4H), 1.98 – 1.87 (m, 1H), 1.43 – 1.33 (m, 2H), 1.30 – 1.17 (m, 10H), 0.85 (t, J = 7.0 Hz, 3H), 0.83 (d, J = 2.4 Hz, 3H), 0.81 (d, J = 2.4 Hz, 3H). 13. C NMR (101 MHz, DMSO-d6): δ 173.9, 171.0, 170.73 (C=O), 57.8(CH), 38.3, 31.2, 30.4, 29.9 (CH2), 29.3 (CH), 29.0, 28.6, 26.3, 22.1 (CH2), 19.2, 18.1, 13.9 (CH3). HRMS (ESI): m/z calcd. for: C17H32N2O4 [M+Na+] = 351.2260 ; found = 351.2258.. - (S)-5-((1-(hexylamino)-3-methyl-1-oxobutan-2-yl)amino)-5-oxopentanoic acid, (GltValHex, IV). Compound IV was obtained (yield 91%) as a white solid. 1. H NMR (400 MHz, DMSO-d6): δ 12.08 (s, 1H), 7.96 (t, J = 5.5 Hz, 1H), 7.89 (d, J = 9.0 Hz, 1H), 4.06 (dd, J = 9.0, 7.2 Hz, 1H), 3.14 – 2.90 (m, 2H), 2.20 (m, 4H), 1.91 (m, 1H), 1.69 (quin, J = 7.5 Hz, 2H), 1.47 – 1.31 (m, 2H), 1.31 – 1.16 (m, 6H), 0.86 (t, overlapping a methyl double, J = 6.6 Hz, 3H), 0.81 (d overlapping a methyl triplet, J = 6.8 Hz, 6H). 13. C NMR (101 MHz, DMSO-d6): δ 174.55, 171.72, 170.87 (C=O), 57.87 (CH), 40.15, 39.94, 39.73, 39.52, 39.31, 39.10, 38.89, 38.31, 34.42, 33.63 (CH2), 30.89(CH), 30.31, 28.91, 25.95, 21.99, 21.09(CH2), 19.20, 18.23, 13.83 (CH3). HRMS (ESI): m/z calcd. for: C16H30N2O4 [M+H+] = 315.2284 ; found = 315.2281. 55.
Figure
+7
Documento similar
Therefore, if fibromyalgia involved a selective deficit in controlled attention, and given that temporal orienting relies on controlled attentional preparation, we should
The effect of chromium picolinate and biotin supplementation on glycemic control in poorly controlled patients with type 2 diabetes mellitus: a placebo-controlled,
The aim of this study was to assess the composition and in vitro release of elements with potential wound healing effects from hydrogels prepared with two nanoclays and natural
The spectra obtained in KBr diluted samples (Figure 5. 14A) show the presence of the main characteristic bands of MCPA, confirming the presence of the herbicide in all the
In this first report we describe data from the cross-sectional phase of the study, which aimed at evaluating: (i) the proportion of patients with controlled, partly controlled
We provide an application to Spanish municipalities, and results show that both output mix and, more especially, environmental conditions, should be controlled
Herein we present a QM/MM theoretical study of the molecular mechanism for the phosphoryl transfer reaction from an inorganic polyphosphate to Dha catalyzed by
dependent parameters. In contrast, harmonic domain models can give us the solution in the harmonic domain directly. We start modeling single-phase electronic loads by means of
