A flexible framework for assessing the quality of crowdsourced data
7
0
0
Texto completo
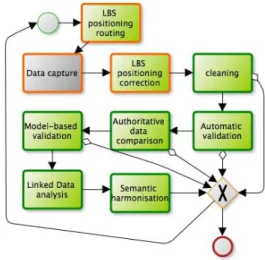
(2) AGILE 2014 – Castellón, June 3-6, 2014. Our Quality Assurance (QA) framework allows for the derivation of three types of metadata corresponding to the three models through Quality Control (QC) checks, tests or measures. We explore this model through a case study on citizen observations of flooding (see COBWEB flooding case study3).. 2. Quality of crowdsourced information. Data collected by the crowd often lacks metadata about its quality that can lead to it being disregarded by scientists (Alabri et al. 2010), however it can frequently complement or update authoritative surveys (Jackson et al. 2010). A prevalent issue within crowdsourcing is the ability to verify and validate data collected by participants, directly contributing to the assessment of the data quality of some existing authoritative dataset (Foody and Boyd 2012). At the same time, authoritative data can be used to control the validity of volunteered information (Comber et al. 2013). An alternative to assess the quality of volunteered information is to employ experts as validators (See et al. 2013). Several methods of gaining knowledge about the quality of citizen collected data have been proposed; they include using a majority decision or control group (Hirth et al. 2012), using a reputation system (Alabri et al. 2010), (Clow et al. 2011), and using user mobility patterns with their previous quality to assess credibility of the contributed data (Mashhadi and Capra, 2011). A different approach is to attempt conflation of the citizen collected data with an authoritative source, such as OpenStreetMap and Ordnance Survey GB (OSGB) Open Data (Pourabdollah et al. 2013). Metadata about data quality plays an important role when attempting to conflate limited authoritative and crowd sourced data in regions that do not have resources to produce complete authoritative data, such as Iraq (Fairbairn et al. 2013). Analysing the ISO 19157 metadata standard, data quality can be split into two main categories: internal quality, which refers to aspects such as completeness, attribute accuracy, positional accuracy and consistency, and external quality such as fitness for use (Wang et al. 1996, Brown et al. 2012, Li et al. 2012).. 2.1. Quality element Vagueness Ambiguity Judgement. Reliability Validity Trust. 3. Definition Inability to make a clear-cut choice (i.e., lack of classifying capability) Incompatibility of the choices or descriptions made (i.e., lack of understanding, of clarity) Accuracy of choice or decision in a relation to something known to be true (i.e., perception capability and interpretation) Consistency in choices / decisions (i.e., testing against itself) Coherence with other people’s choices (i.e., against other knowledge)) Confidence accumulated over other criterion concerning data captured previously (linked to reliability, validity and reputability). A generic quality assurance framework. A framework is required for quality assurance to understand and improve quality in crowdsourced data, with a view to increasing the quality of the entire database over time through directed data collection and error reduction. During this process, quality metadata values for the producer model, the consumer model and the stakeholder model are derived. In a more general context, the stages for validation constituting the QA may be thought of as a series of discrete processes that could be flexibly (and iteratively) called under the control of a business process execution design that is specific to a case study but derived from generic principles. We have designed a QA process based on authoring a workflow for each type of data collected. The system is enabled by the Workflow Quality Control Authoring Tool (WoQC-AT) for chaining quality processes.. Three quality models. The stakeholder model proposed in the introduction sits between internal and external quality as a source of uncertainty linked to the user and their device(s). If the QA/QC framework is aimed at producing metadata about spatial data quality in the form of the ISO 19157 (the producer quality model), this process requires other types of quality elements. Table 1 describes an overview of quality elements that are considered as part of the QA process, with a focus on active volunteers. Table 1: Quality elements for the stakeholder quality model. 3. http://cobwebproject.eu/. Figure 1: Typical workflow for quality assessment of crowd-sourced data before and after data capture (BPMN diagram) An OGC compliant Web Processing Service (WPS) enables the execution of each QC element. It also composes a workflow using a back-end QA/QC service for the crowdsourcing data assessment..
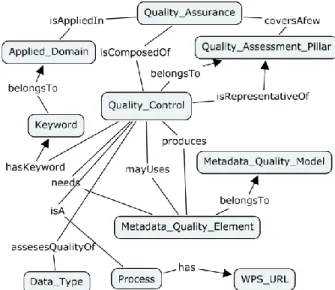
(3) AGILE 2014 – Castellón, June 3-6, 2014. The metadata for each process within the WPS is enriched by an ontology enabling retrieval of the appropriate processing checks, (WoQC-O). Figure 1 shows typical toplevel stages for a stakeholder user-defined instance where each step encapsulates a sub-workflow. The top-level workflow includes a position quality improvement step before the data capture but only the green boxes are registered in the WoQC-WPS as the mobile app can also perform QA in certain circumstances. Generally, the stages for validation and QA are discrete processes that can be flexibly (and iteratively) called under the control of a business process execution stage that may be either generic (by default), or use-case specific.. 4. Ontology of quality assements. The QA/QC framework is built upon seven pillars of validation and quality assessment. These pillars cover aspects that can be a cause for concern with respect to quality when acquiring crowd data collected from mobile handheld devices in the environment. This generic set of checks is chosen to illustrate the most suitable options available. Each of the sections encompasses a range of known techniques, some of which have previously been employed in crowd-sourcing projects and described in the literature. The purpose of the WoQC-O ontology (Figure 2) is to organise these techniques to perform iterative uncertainty reduction and accuracy improvement to facilitate authoring of the QA by instantiation of a workflow on a server.. Figure 3: Generic atomic workflow QC process within the WoQC-WPS (BPMN diagram). 4.1. LBS positioning. Using LBS techniques such as geofencing (Martin et al. 2011) and remote logging and query via line of sight (Meek et al. 2013a), (Meek et al. 2013b), a mobile app is used to direct the user towards parts of a study area that are of interest to project organizers. Depending on the study, this can prevent data being captured when the positional accuracy is too low, it can also help to increase the density of observations where required, and can partially address the sampling problem in crowdsourcing. From a quality perspective, this pillar is likely to minimise errors in recording field data as the user has few choices for data input. Additionally, asking a user to simply confirm or deny the existence of a potential observation requires little cognitive load on the part of the user. Figure 2: Top levels of the WoQC-O ontology (conceptual map diagram) The following sub-sections detail the pillars in turn; each one combines a few checks or quality assessments that are processes registered in the WPS and seen as basic workflow. Figure 3 describes a generic QC single process with data inputs from authoritative sources (orange), crowdsourced inputs (green) and other inputs (grey) with their existing metadata.. 4.2. Cleaning. Garbage removal and data cleaning uses low-cost checking mechanisms to remove erroneous entries, however there is a danger that valid data are discarded in this step. One level of garbage removal concerns false alarm data, or malicious entries. If crowdsourced data received has a capture position clearly outside of a study area, it can be removed immediately..
(4) AGILE 2014 – Castellón, June 3-6, 2014. Besides rejection, data cleaning can also make the information collected more useful and suited to future stages outlined below. One such example is Stop Word Removal. Stop words are words that appear in text but have little meaning such as “and, &, a, the” (Barbier et al. 2012). Removal of such words is likely to help with stages applied later in the process such as such as conflation and semantic harmonization.. 4.3. Automatic validation. In this stage, the data are assessed via automatic, computational techniques that apply a preliminary credibility check to the data collected. An example of employing these techniques is the OSMGB project where the aim was to check road names in OSM against the names released in the OS Open Data initiative as well as correcting the topology (Pourabdollah et al. 2013). The findings included the rate of error for OSM road labels is somewhat inversely proportional to the density of roads shown in the mapping. Validating topological relations between datasets, as a prerequisite for low level conflation has been a requirement in GIS technologies for sometime. For an attribute manually input by the user, an attribute range check may relate to some obvious misunderstanding of units, as could automatic correction of spelling.. 4.4. Authoritative data comparison. The purpose of this set of QC is to compare the collected data with authoritative data sources. This stage can be used to improve the confidence and validity of collected data, add attribution, and assign error bounds to the spatial, temporal and thematic attribute of a data item. Research has focused on the user validating or updating authoritative data, e.g. (Foody et al. 2013) who describe a process where users add or change information on land cover data and Du et al. (2012), who use distributed logic to integrate crowdsourced vector road data with authoritative data. The reverse view is to use authoritative data to validate the crowdsourced observations. Therefore the final validation process takes place after the quality assessment is done and a conflated dataset produced. Some of the quality elements for the crowdsourced data depend on other data sources, controlled by reference to a time stamp (e.g., other crowdsourced data from Model-based validation). Records in the database enabling multiple representations are therefore tagged with a time and quality of real-world representation.. 4.5. data feeds and corrections (Pawlowicz et al. 2011) requires a server connection, a well-designed mobile application, or an ad hoc network between devices. Data collectors in the field are acting as a team without being aware of the other team members, and are in a sense multiple sensors, used to improve accuracy of a measurement. The community of users, from the casual user to the domain expert can be used to derive a trust metric and personalise pushed tasks. Should the system know this information through a signup system, domain experts can be consulted to validate an observation if required.. 4.6. Linked data analysis. Here, the term; linked data is being used in a broad sense and not just referring to Resource Description Framework (RDF) triplestores/databases. This stage combines the wealth of freely available data (big data) and associated data mining techniques to establish confidence and quality bounds for data inputs. Publicly available feeds such as Twitter are employed as a reference to newly captured information. Semantic accuracy plays a role and the coherence of the semantic information as defined in the stakeholder quality model (vagueness, ambiguity and validity elements) are used and also fed back into the metadata. The different sections of QC can interact principally via the metadata, but also more complex workflows may involve a decision, validation and input of quality for a captured data element. This can be based on the conjunction of assessments from authoritative comparison and linked data analysis. For example, within a flooding event case study quantitative data captured may be assessed as poorly representative of the authoritative distribution, but Tweeted many times in the same time frame either in upstream or downstream of the location.. 4.7. Semantic harmonization. This stage in the workflow illustrates methods of semantic integration of the crowdsourced and authoritative data. The set of QCs are transformations of the input data, ensuring conformance to or enrichment of an ontology, dependent on the application and domain. A related method that can be used in preparation to harmonise to a specified ontology is through knowledge extraction and semantic similarities in VGI (Ballatore et al., 2013). In this two-stage process, the authors develop an OSM semantic network via a web-crawler and then produce a study where they look at the cognitive plausibility of different cocitation algorithms. This approach offers a system the ability to harmonise data entries with a crowdsourcing data repository (Idris et al. 2014).. Model-based validation. This set of QC is focused on comparison of the crowd data with data from models or previously validated crowdsourced data. Models are likely to be environmental, but can also refer to different ways of prompting the users to harness contextual input. For environmental models it assesses the discrepancy between crowd inputs and model predictions. Validation through directing the user geographically and through feedback of potential items of interest is assessed dynamically. The principle of improving quality by real-time. 5. Examples. The proposals presented above have been tested against a use case from the EU FP7 Project, COBWEB3. In this use case the citizen is asked to give some categorical and open textual information about the observation with instructions: flood height, speed and colour of stream as compared to three calibrated images of stream flows, free text and an image via the device’s camera..
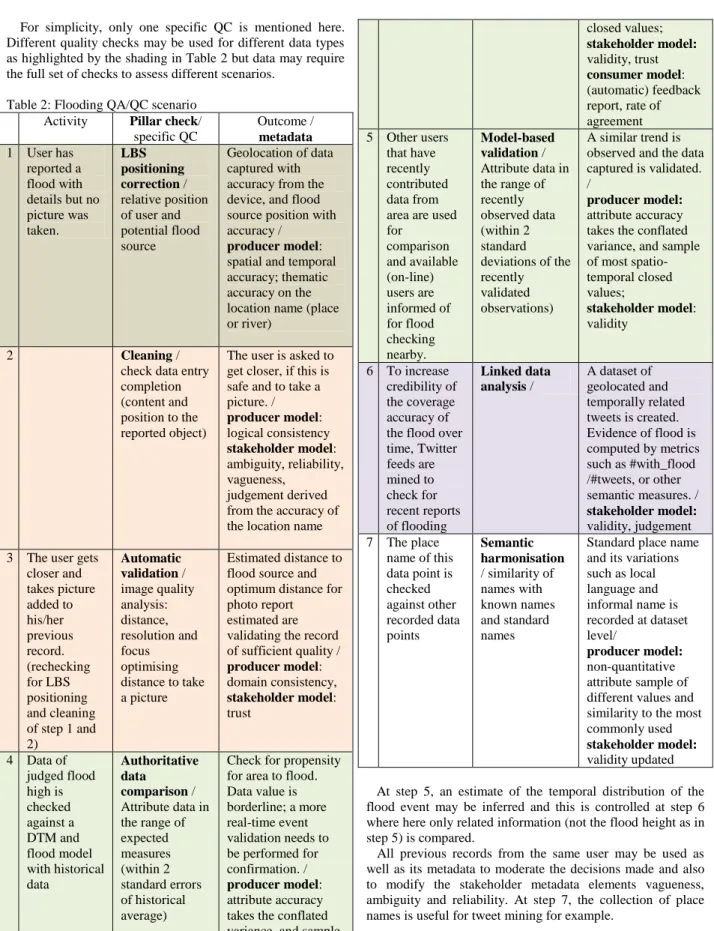
(5) AGILE 2014 – Castellón, June 3-6, 2014. For simplicity, only one specific QC is mentioned here. Different quality checks may be used for different data types as highlighted by the shading in Table 2 but data may require the full set of checks to assess different scenarios. Table 2: Flooding QA/QC scenario Activity Pillar check/ specific QC 1 User has LBS reported a positioning flood with correction / details but no relative position picture was of user and taken. potential flood source. 2. Outcome / metadata Geolocation of data captured with accuracy from the device, and flood source position with accuracy / producer model: spatial and temporal accuracy; thematic accuracy on the location name (place or river). Cleaning / check data entry completion (content and position to the reported object). The user is asked to get closer, if this is safe and to take a picture. / producer model: logical consistency stakeholder model: ambiguity, reliability, vagueness, judgement derived from the accuracy of the location name. Automatic validation / image quality analysis: distance, resolution and focus optimising distance to take a picture. Estimated distance to flood source and optimum distance for photo report estimated are validating the record of sufficient quality / producer model: domain consistency, stakeholder model: trust. Authoritative data comparison / Attribute data in the range of expected measures (within 2 standard errors of historical average). Check for propensity for area to flood. Data value is borderline; a more real-time event validation needs to be performed for confirmation. / producer model: attribute accuracy takes the conflated variance, and sample of most spatiotemporal. 5. 6. 7 3. 4. The user gets closer and takes picture added to his/her previous record. (rechecking for LBS positioning and cleaning of step 1 and 2) Data of judged flood high is checked against a DTM and flood model with historical data. Other users that have recently contributed data from area are used for comparison and available (on-line) users are informed of for flood checking nearby. To increase credibility of the coverage accuracy of the flood over time, Twitter feeds are mined to check for recent reports of flooding The place name of this data point is checked against other recorded data points. Model-based validation / Attribute data in the range of recently observed data (within 2 standard deviations of the recently validated observations). Linked data analysis /. Semantic harmonisation / similarity of names with known names and standard names. closed values; stakeholder model: validity, trust consumer model: (automatic) feedback report, rate of agreement A similar trend is observed and the data captured is validated. / producer model: attribute accuracy takes the conflated variance, and sample of most spatiotemporal closed values; stakeholder model: validity. A dataset of geolocated and temporally related tweets is created. Evidence of flood is computed by metrics such as #with_flood /#tweets, or other semantic measures. / stakeholder model: validity, judgement Standard place name and its variations such as local language and informal name is recorded at dataset level/ producer model: non-quantitative attribute sample of different values and similarity to the most commonly used stakeholder model: validity updated. At step 5, an estimate of the temporal distribution of the flood event may be inferred and this is controlled at step 6 where here only related information (not the flood height as in step 5) is compared. All previous records from the same user may be used as well as its metadata to moderate the decisions made and also to modify the stakeholder metadata elements vagueness, ambiguity and reliability. At step 7, the collection of place names is useful for tweet mining for example..
(6) AGILE 2014 – Castellón, June 3-6, 2014. 6. Discussion and conclusion. The focus of the paper has been to present a framework in which QA/QC for assessing the credibility of crowd sourced data and enriching it to optimise user requirements can be facilitated. The required set of quality metadata has been identified and seven pillars in which the quality controls can occur have been described. Using the framework by authoring a workflow combining and chaining checks and quality assessments seen as processes belonging to the seven pillars provides the QA/QC for a crowdsourcing case study. The pillars represent the top levels of an ontology of quality controls that can be used. The ontology allows seamless access to appropriate QC when composing the workflow. Interoperability mechanisms of using standards such as WPS, BPMN, and the SKOS language to represent the ontology used to enrich the metadata of the WPS can ensure sharing of specific quality controls as processes.. Acknowledgements This work has been part supported by the project “Citizen Observatory WEB” (COBWEB) funded by the European Union under the FP7 ENV.2012.6.5-1 funding scheme, EU Grant Agreement Number: 308513.. References Alabri A Hunter J (2010). Enhancing the quality and trust of citizen science data. In 2010 IEEE Sixth International Conference on e-Science, 81-88. Aoki PM Honicky RJ Mainwaring A Myers C Paulos E Subramanian S Woodruff A (2008) Common sense: Mobile environmental sensing platforms to support community action and citizen science. Ubicomp 2008. Ballatore A Bertolotto M Wilson DC (2013) Geographic knowledge extraction and semantic similarity in OpenStreetMap. Knowledge and information systems (37): 61–81. Barbier G Zafarani R Gao H Fung G Liu H (2012). Maximizing benefits from crowdsourced data. Computational and Mathematical Organization Theory, 18(3): 257–279. Brown M Sharples S Harding J Parker CJ Bearman N Maguire M Forrest D Haklay M Jackson M (2013) Usability of Geographic Information: current challenges and future directions. Appled Ergonomics 44: 855–865. Clow D Makriyannis E (2011). iSpot Analysed: Participatory learning and reputation. In Proceedings of the 1st International Conference on Learning Analytics and Knowledge p 34-43 ACM. Comber A See L Fritz S Van der Velde M Perger C Foody G (2013) Using control data to determine the reliability of volunteered geographic information about land cover.. International Journal of Applied Earth Observation and Geoinformation 23: 37-48. Díaz P Masó J Sevillano E Ninyerola M Zabala A Serral I Pons X (2012) Analysis of quality metadata in the GEOSS Clearinghouse. International journal of spatial data infrastructures research. 7: 352-377. Du H Anand S Alechina N Morley J Hart G Leibovici D Jackson MJ Ware M (2012). Geospatial information integration for authoritative and crowd sourced road vector data. Transactions in GIS, 16(4): 455-476. Fairbairn D Maythm A (2013) Using Geometric Properties to Evaluate Possible Integration of Authoritative and Volunteered Geographic Information. International Journal of Geo-Information 2(2): 349–370. Foody GM, Boyd D (2012) Using volunteered data in land cover map validation: Mapping tropical forests across West Africa. In proceedings of IGARSS, p 2368–2371. Foody GM See L Fritz S van der Velde M Perger C Schill, C Boyd DS (2013). Assessing the Accuracy of Volunteered Geographic Information arising from Multiple Contributors to an Internet Based Collaborative Project. Transactions in GIS 17(6): 847-860. Haklay M Weber P (2008). Openstreetmap: User-generated street maps. Pervasive Computing, IEEE, 7(4): 12-18. Hirth M Hoßfeld T Tran-Gia P (2012). Analyzing costs and accuracy of validation mechanisms for crowdsourcing platforms. Mathematical and Computer Modelling 57: 29182932. Horton JJ Chilton LB (2010). The labor economics of paid crowdsourcing. In Proceedings of the 11th ACM conference on Electronic commerce, p 209-218. ISO (2002) http://www.iso.org/iso/catalogue_detail.htm?csnumber=26018 ISO Jackson MJ Rametulla H Morley J (2010) The Synergistic use of authenticated and crowd-sourced data for emergency response. In proceedings of International Workshop on Validation of Geo-Information Products for Crisis Management (VALgEO): 91-99 Kittur A Chi E H Suh B (2008). Crowdsourcing user studies with Mechanical Turk. In Proceedings of the SIGCHI conference on human factors in computing systems. P 453456. Li D Zhang J Wu H (2012). Spatial data quality and beyond. International Journal of Geographical Information Science 26: 2277–2290. Martin D Alzua A Lamsfus C (2011). A contextual geofencing mobile tourism service. In proceedings of.
(7) AGILE 2014 – Castellón, June 3-6, 2014. Information and communication technologies in tourism: 191202. Springer Vienna. Mashhadi A J Capra L (2011). Quality control for real-time ubiquitous crowdsourcing. In Proceedings of the 2nd international workshop on Ubiquitous crowdsourcing, P 5-8. ACM. Meek S Goulding J Priestnall G (2013) The influence of digital surface model choice on visibility-based mobile geospatial applications. Transactions in GIS. 17(4): 526–543. Meek S Priestnall G Sharples M Goulding J (2013) Mobile capture of remote points of interest using line of sight. Computers and Geosciences 52: 334-344. Idris NH Nazri F Said M Iashak M Hashim M Ishmail Z Jackson MJ (2014) Semi-automated metadata detection for assessing the credibility of map mashups through metadata indicators. Forthcoming, 2014 FIG International Congress, Kuala Lumpur, Malaysia,16–21 June 2014 Pawlowicz S Leibovici DG Haines-Young R., Saull, R., Jackson, M., (2011). Dynamic surveying adjustments for crowdsourced data observations. In proceedings Enviroinfo 2011. 5-7 October 2011. Ispra, Italy.. Pourabdollah A Morley J Feldman S Jackson MJ (2013) Towards an Authoritative OpenStreetMap: Conflating OSM and OS OpenData National Maps’ Road Network. International Journal of Geo-Information 2(3) 704–728. Rousell A Jackson M Leibovici DG (2014) Towards automatically identifying the required uncertainty types to describe attributes of geospatial data. Submitted to Journal of Geographical Systems. See L Steffen F Leeuw J (2013) The Rise of Collaborative Mapping: Trends and Future Directions. International Journal of Geo-Information 2.4: 955–958.. Wang RY Strong DM Guarascio LM (1996). Beyond accuracy: What data quality means to data consumers. Journal of Management Information Systems, 12(4): 5-33. Yang X Blower JD Bastin L Lush V Zabala A Maso J Cornford D Diaz P Lumsden J (2012) An integrated view of data quality in Earth observation. Philosophical Transactions of the Royal Society A: Mathematical, Physical and Engineering Sciences 371.
(8)
Figure
Documento similar