The benefits of the 5 week Table Stars @school program as part of physical education in primary schools – A pilot intervention study
13
0
0
Texto completo
(2) International Journal of Racket Sports Science 1 (1). Faber et al. essential part of the NTTA’s policy as it is vital for the NTTA’s sustainability in future. More children can be reached by providing this program during the physical education classes in comparison with regular club trainings; at this moment, 250 school and 80 clubs use (parts) of Table Stars and more than 13,000 children are reached in the Netherlands every year (https://www.nttb.nl/nieuws/table-stars-wervendproduct). Moreover, Table Stars @school is suggested to better connect children to table tennis than a regular table tennis training, because it includes exercises that are especially made for children between 6-12 years to learn table tennis fundamentals. Children are considered to experience fun and a sufficient level of success at these exercises. Second, the NTTA wanted to provide a program that connects with the physical education curriculum and contributes to the development of young children. It is hypothesized that children benefit from this program regarding their perceptuo-motor skills by practicing the fundamental skills of table tennis (Balyi, 2001). The most prominent fundamentals of table tennis in Table Stars are considered (a combination of) static and dynamic balance skills (e.g. footwork), eye hand coordination (e.g. aiming, catching, juggling, hitting) and object control/manipulation (i.e. bat and ball control) (Faber et al., 2014; Table Tennis Canada, 2015). Although the regular physical education program in the Netherlands covers a part of these skills, not much attention is paid to the perceptuomotor skills underlying most racket and batting sports that need a higher degree of coordination and (ball) control (Schmidt and Lee, 2011). In general, children practice the more gross perceptuo-motor skills like running, climbing, clambering and throwing and catching while using a relatively large ball (e.g. volleyball) during physical education classes in the Netherlands (http://tule.slo.nl). The more precise footwork (e.g. hopscotch, cross-steps and side-steps) and ball control skills while using an elongated arm and/or a smaller ball and the combination often receive less attention or are even neglected. Adding this to the physical education classes provides a wider range of skills that can be explored and practiced, which is. Introduction The Netherlands Table Tennis Association (NTTA) launched the so-called Table Stars @school program in 2010 (https://www.nttb.nl/speel-tafeltennis/jeugd/ table-stars/ts-op-school; NTTB, 2018). This program is designed for children between 6-12 years as a first introduction to the sport of table tennis in primary schools. Table Stars @school can be used in physical education classes. It offers complete lessons which can be given by physical education teachers and/or table tennis trainers. The program has been developed in such a way that teachers/trainers can put together one or more lessons for each age group from a list of different exercises connecting to table tennis. Table Stars @school has been implemented in practice by the NTTA and it has been certified as an official intervention by the Dutch Ministry of Health, Welfare and Sport (https://menukaart.sportenbewee ginterventies.nl). Table Stars @school is a part of the full program ‘Table Stars’, which includes, besides the offer for schools, three other parts and possible moments of entrance: ‘Table Stars @the club’, ‘Table Stars Challenge’ and ‘Table Stars the Battle’. Table Stars @the club is the sequel to Table Stars @school. In this part, children discover the table tennis club after the first introduction with the sport at school and continue to learn the first basic skills. The third part and entry point is Table Stars Challenge. The Table Stars Challenge offers table tennis clubs the opportunity to make children a good start with table tennis as a competitive sport. At this point, children are already members of the association and practice at their club. Children learn the rules and how to compete with other children. ‘Table Stars the Battle’ is an annual championship especially for primary school children. This championship is played in teams. The aim of the NTTA by initiating Table Stars @school, a program outside and in addition the regular table tennis club trainings, was two-fold. First, the NTTA wanted to introduce as many children as possible to table tennis and let them explore and discover with Table Stars @school whether table tennis might be the sport that fits them. The recruitment of young members with Table Stars is an. 4.
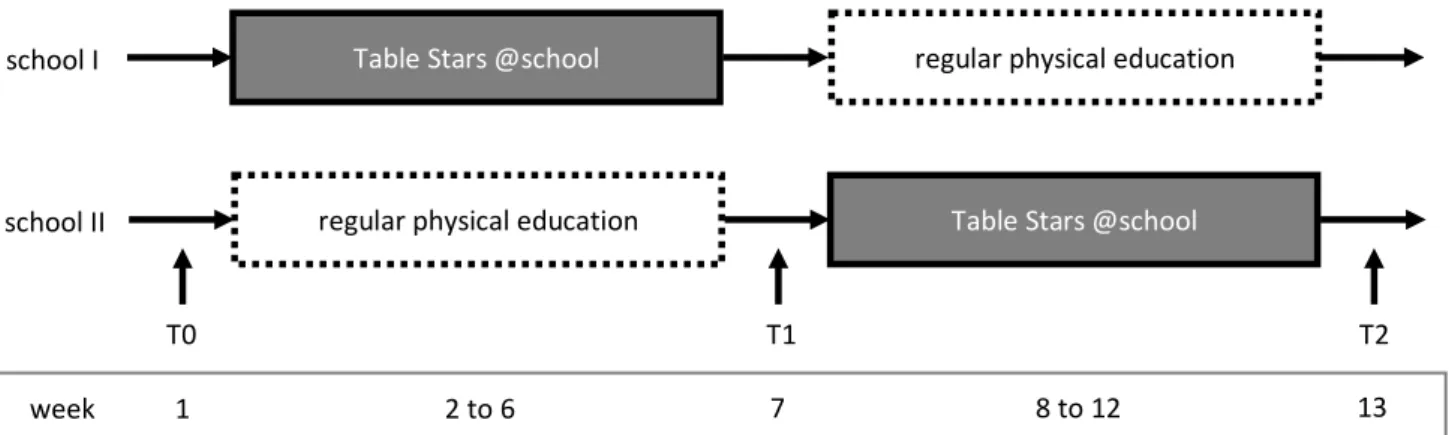
(3) International Journal of Racket Sports Science 1 (1). Faber et al.. considered to stimulate a broader skills development in children. In addition to this, table tennis is acknowledged as a meticulous and cognitively-engaging sport (Best, 2010; Wang et al., 2016). Table Stars includes age-adequate, but relatively complex motor tasks that are closely connected to table tennis. The more complex skills or coordinative exercises are found to be more effective to improve concentration and attention tasks than simpler exercises (Budde et al., 2008). Moreover, nearly all forms of cognitive functioning involve attention (Best, 2010). Particularly selective attention, in which attention is directed to a specific relevant object (and not to the disruptive irrelevant ones), seems crucial in table tennis. Due to this specific characteristic of the sport, most exercises in table tennis practice are considered to require a relatively high level of attention. Also the exercises within Table Stars @school challenge the children’s ability to focus on a certain task; only with a sufficient level of attention it is possible to fulfil the task successfully. Consequently, it is suggested that children might benefit from Table Stars @school also regarding their attention skills. Although Table Stars @school has been implemented in practice by the NTTA and it has been certified as an official intervention, the contributing effect of Table Stars @school on children’s development has not yet been studied. Since perceptuo-motor performance and cognitive functions are important in the overall development of children (Bushnell and Boudreau, 1993; Moffitt et al., 2011), this first pilot intervention study will cover this gap on the basis of the following research questions: 1. What is the effect of Table Stars @school in comparison to regular physical education on the perceptuo-motor skills and selective attention in primary school children (6-12 years)?. 2. How many and which children benefit more from the Table Stars @school program compared to regular physical education?. Materials and methods Study design An intervention study was carried out in two regular public primary schools in the Netherlands within the period of October 2017 to February 2018. Both schools provide physical education classes of 45 min twice a week during regular school weeks. Figure 1 presents the design of the study. A baseline measurement (T0) has been conducted at both schools at the start of the study. Consecutively, the intervention Table Stars @ school was provided at school I, which lasted 5 weeks. The children of school II participated in their regular physical education classes in the same period. After this first period, the children of both schools were measured again (T1). After that, school II was provided with the Table Stars @school intervention for 5 weeks. The children of school I followed the regular physical education program in this period. A third measurement (T2) was conducted in both schools again after the intervention period of school II. This study and its informed consent procedure were approved by the ethical committee ‘Commissie Mensgebonden Onderzoek’ region Arnhem-Nijmegen (Nijmegen, The Netherlands; registration code 20173682) in full compliance with the Declaration of Helsinki. Written parental informed consent and children’s consent were obtained prior to the first testing appointments at the primary school. All data were recorded in an anonymous data set. The authors declare no conflict of interest.. 5.
(4) International Journal of Racket Sports Science 1 (1). Faber et al.. school I. Table Stars @school. regular physical education. school II. regular physical education. Table Stars @school. T0 week. 1. T1 7. 2 to 6. T2 8 to 12. 13. Figure 1. Study design http://tule.slo.nl/Bewegingsonderwijs/FKDBewegingsonderwijs.html). In each week, regular physical education lessons were provided twice.. Participants Children between 6 to 12 years from class 3 to 8 were recruited at two regular public primary schools. Both schools educate without a certain religious or otherwise philosophical direction as the basis, include predominantly typically developing children and do not address specifically special target groups (e.g. children with behavior or learning disorders).. Measurements The perceptuo-motor skills assessment of the children consisted of four test items: static balance (SB), walking backwards (WB), speed while dribbling (SD) and eye-hand coordination (EHC). SB and WB are selected to measure static and dynamic balance, respectively, while SD and EHC aim to measure the eye hand coordination and ball control (object manipulation). All perceptuo-motor items were selected from existing test batteries i.e. the Movement Assessment Battery for Children-2 (SB), the Körperkoordinationstest für Kinder-3 +EHC (WB and EHC) and the Dutch Motor Skills Assessment (SD) (Kiphard and Schilling, 2007; Faber et al., 2015; Henderson et al., 2007; Platvoet et al., 2018). Selective attention was measured with the map mission (MM) task, a test item of the Test of Everyday Attention for Children (Manly et al., 2001). The standardization of all test items is captured in protocols, which includes a detailed description of materials, set-up, assignment, demonstration, training phase, testing phase and registering test scores.. Interventions Table Stars @school The intervention was carried out by two qualified NTTA trainers in both schools. They were familiar with Table Stars @school. The program lasted 5 weeks. In each week, one of the two physical education classes has been replaced by a Table Stars @school lesson. During the lessons, attention was paid to the following: aiming, footwork, balancing, effect, ball control and playing (returning the ball). Adjustments were made to the task per age group if necessary. For more information, see the detailed description in the 'Table Stars - the finest motor skills method' (NTTB, 2018). Regular physical education The regular physical education intervention was carried out by the classes’ regular teachers from school. The lessons were based on the aims of the Dutch national expertise centrum of learning development. They used a mix of the learning themes: balancing, climbing, swinging, tumbling, running, aiming, juggling, goal games, tapping and romping. For more information:. Static balance (SB) The children were instructed to stand on one leg on a balance board. The maximum was set on 45 seconds. This modification to the original test item, which uses a maximum of 30 seconds, is made to maintain adequate responsiveness of the test items when used in the children of the relatively older ages (11-12. 6.
(5) International Journal of Racket Sports Science 1 (1). Faber et al.. years). There were two attempts. Only the best time (s) was noted as final outcome (Henderson et al., 2007). The test-retest reliability of the original test item is considered good; intraclass correlation coefficient SB 0.99 (p < 0,05) (Wuang et al., 2012). As the nature of the test maintained, it is suggested that reliability is sufficient. Moreover, the original test item is able to discriminate between performance levels (Henderson et al., 2007).. Platvoet et al. (2018) was used for the children of the third and fourth classes (6-8 years); they were allowed to use both hands for catching. The test-retest reliability of the test items is considered good; intraclass correlation coefficient EHC 0.87 (p < 0,05) (Faber et al., 2015). Moreover, the test item is able to discriminate between performance levels (Faber et al., 2014; Faber et al., 2015; Faber et al., 2018; Platvoet et al., 2018).. Walking backwards (WB). Map mission (MM). The children were instructed to walk backwards three times along of three balance beams (3 trials x 3 beams) with the same length (3 m) but differences in width (6 cm, 4.5 cm and 3 cm). The number of successful steps was scored as final raw outcome with a maximum of eight steps per trial, which comprises a maximum of 72 steps (8 steps x 3 trials x 3 beams) (Kiphard and Schilling, 2007). The test-retest reliability of the test items is considered good; intraclass correlation coefficient WB 0.80 (p < 0,05) (Kiphard and Schilling, 2007). Moreover, the test item is able to discriminate between performance levels (Platvoet et al., 2018; Vandorpe et al., 2011).. The children were given a printed A3 laminated city map with 80 targets (small restaurant symbols, 4 x 3 mm) randomly distributed across this map. Distracting symbols of a similar size (e.g. supermarket trolleys, cups, and cars) were also present. The children were instructed to find and circle as many target symbols as possible with a pen within one minute. The final score was the number of targets correctly marked (Manly et al., 2001). The test-retest reliability of the test items is considered good; intraclass correlation coefficient MM 0.88 (p < 0,05) (Manly et al., 2001). Moreover, the test item is able to discriminate between performance levels (Manly et al., 2001).. Speed while dribbling (SD). Data collection. ‘Speed while dribbling’ used a zigzag circuit in which the players needed to move sideways as fast as possible while dribbling with a basketball using one hand. Players had one attempt in which time was measured in seconds (Faber et al., 2016). The test-retest reliability of the test items is considered good; SD 0.83 (p < 0,05) (Faber et al., 2015). Moreover, the test item is able to discriminate between performance levels (Faber et al., 2014; Faber et al., 2015; Faber et al., 2018).. Data were collected between October 2017 to February 2018. All children were tested under similar conditions. The perceptuo-motor tests were assessed in random order during two physical education classes. The test for selective attention was assessed during other regular classes. Total testing time for each child was approximately 10 minutes for the perceptuomotor tests and 5 minutes for the selective attention task per testing moment. Test leaders were physical education students or table tennis trainers and instructed and trained to the same extent by an expert. All test leaders were blinded for the results of previous testing moments. In addition to the tests, the sex, the date of birth and the class of the children were recorded. From the birthday and class number, it was derived whether children rebounded or speeded up one class. Moreover, children were asked at the baseline measurement (T0) whether they participated in a ball sports (yes/no).. Eye hand coordination (EHC) During the eye-hand coordination test the children needed to throw a tennis ball on a flat wall at 1-meter distance with one hand and to catch the ball correctly with the other hand as many times as possible in 30 seconds. The best number of correct catches of two attempts was recorded as raw outcome score. The modification on the original protocol as proposed by. 7.
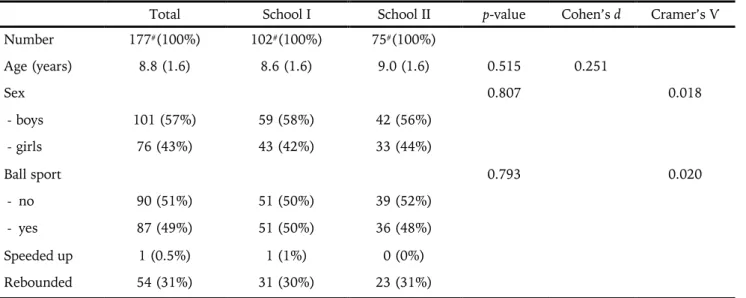
(6) International Journal of Racket Sports Science 1 (1). Faber et al. both interventions. A responder on balance showed a better development of performances on both SB and WB after either regular physical education or Table Stars @school. A responder on eye-hand coordination/ball control showed a better development on both SD and EHC after either regular physical education or Table Stars @school. A responder on selective attention scored more than 9 points (i.e. smallest detectable change of MM) better after either regular physical education or Table Stars @school. Non-responders did not meet these criteria. Difference between the non-responders, the regular physical education responders and the Table Stars @school responders were evaluated with a Chi-square tests for sex and ball sport participation and an ANOVA for age and the test outcomes at baseline (T0). Cohen’s rules of thumb are used on the magnitudes of the effect sizes (Cohen, 1988). Alpha was set at 0.05 for significance for all analyses.. Statistical analysis IBM SPSS Statistics 25 (IBM Corp., Armonk, New York, United States of America) was used for the statistical analyses. Sample characteristics were presented for the total group and the two schools separately. An independent t-test was used to test for difference in age between the two schools. Chi-square tests were conducted to examine differences in group characteristics between the two school regarding sex and sport participation (ball sport yes/no). Children with injuries/illness that were not able to attend one or more tests were excluded from further analyses in which these results were needed. Then first, the baseline outcomes were analyzed to test for significant differences between schools by means of an independent t-test. Second, the effect of the interventions on group level were analyzed in three different ways to make a clean evaluation: 1.) a comparison for both schools separately using a paired t-test 2.) a comparison including both schools using a paired t-test and 3.) a comparison taking only into account the first period (T0-T1) using an independent t-test. The main reasons for this multiple approach was the absence of a clear wash-out effect as a consequence of the nature of the interventions and design (Wellek and Blettner, 2012); this study cannot be perceived as a clean crossover design. Finally, it was analyzed how many and which children benefit most from Table Stars @school and the regular physical education lessons. For this purpose, we identified the so-called 'responders' and 'non-responders' for balance, eye-hand coordination/ball control and selective attention for. Results Sample characteristics All children from class 3 to 8 (n=179) and their parents/care-takers were approached to participate in this study. For two children, one of each school, no informed consent was signed. The sample characteristics are presented in Table 1. No significant differences were found between the schools regarding age and the distribution of sex and sports participation (ball sport yes/no) (p > 0.05).. 8.
(7) International Journal of Racket Sports Science 1 (1). Faber et al.. Table 1. Sample characteristics Number. Total. School I. School II. 177 (100%). 102 (100%). 75 (100%). 8.8 (1.6). 8.6 (1.6). 9.0 (1.6). #. Age (years). #. p-value. Cohen’s d. 0.515. 0.251. Cramer’s Ѵ. #. Sex - boys. 101 (57%). 59 (58%). 42 (56%). - girls. 76 (43%). 43 (42%). 33 (44%). Ball sport - no. 90 (51%). 51 (50%). 39 (52%). - yes. 87 (49%). 51 (50%). 36 (48%). Speeded up. 1 (0.5%). 1 (1%). 0 (0%). Rebounded. 54 (31%). 31 (30%). 23 (31%). 0.807. 0.018. 0.793. 0.020. Data are frequencies (valid percent), except for age which is presented in mean (SD). #missing n=2 (1 per school, no informed consent was signed). a significant difference with a small effect size between two school at the baseline measurement for WB; the children from school II outperformed the children of school I at WB (p = 0.040; Cohen’s d = 0.318).. Baseline comparison Table 2 present the comparison of the two schools on the baseline measurement concerning the test outcomes. The mean scores are presented per test item. The independent t-tests show that there existed Table 2. Baseline comparison School I. School II. n. mean (SD). n. mean (SD). p-value. Cohen’s d. SB (s). 102. 18.2 (15.3). 72. 19.3 (14.5). 0.611. 0.073. WB (steps). 100. 33.7 (15.8). 72. 41.2 (14.9). 0.002*. 0.488. SD (s). 100. 26.7 (10.3). 73. 27.9 (8.9). 0.404. 0.124. EHC (catches). 100. 11.3 (8.0). 71. 10.5 (6.1). 0.461. 0.112. MM (targets). 101. 34.5 (11). 74. 37.0 (12.4). 0.155. 0.213. SB = static balance, WB = Walking backwards, SD = speed while dribbling, EHC = eye hand coordination, MM = map mission. Independent t-test are used to test for differences between groups. *p < 0.05.. schools, separately. Part c. includes both schools in a paired comparison, where the order of the interventions in both schools is different (Fig. 1). Part d. compares school I (i.e. Table Stars @school) and school II (i.e. regular physical education) only for the. Intervention effect – group analyses The comparison between Table Stars @school and regular physical education are presented in Table 3. Part a. and b. show the effect in paired analyses for both. 9.
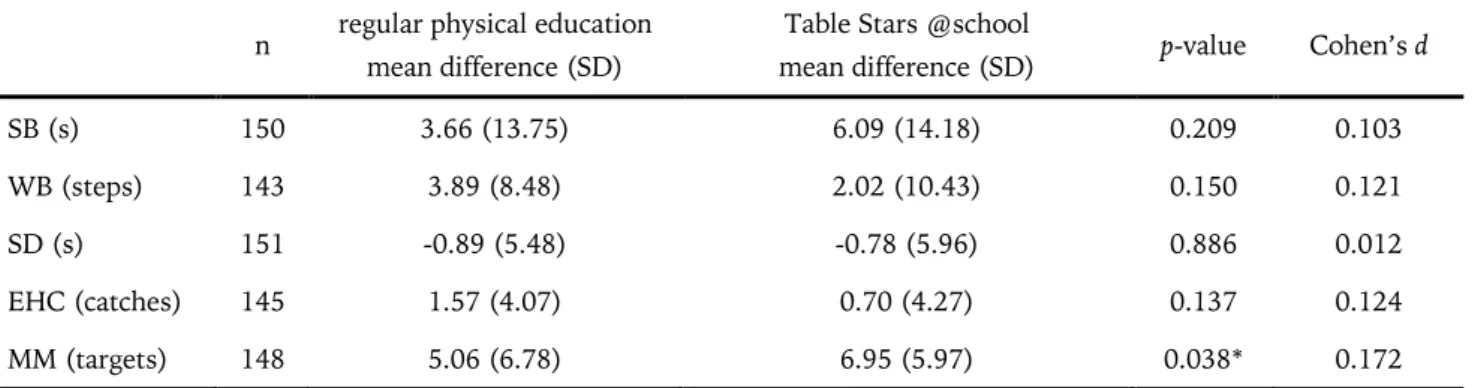
(8) International Journal of Racket Sports Science 1 (1). Faber et al.. difference between T0-T1. The separate analysis for school I shows a significant improvement with small and medium effect sizes in favor of the Table Stars @school intervention regarding static balance (p = 0.004; Cohen’s d = 0.300) and selective attention (p < 0.001; Cohen’s d = 0.701), respectively. In contrast, the separate analysis for school II shows a significant improvement with small and medium effect sizes in favor of the regular physical education intervention regarding selective attention (p < 0.001; Cohen’s d = 0.450) and walking backwards (p < 0.001; Cohen’s d = 0.501), respectively. In the intervention comparison. including both schools in a paired analysis (Table 3, part c.), only one significant effect remains in favor of the Table Stars @school intervention (p = 0.038). It must be acknowledged that this is a significant effect with only a small effect size (Cohen’s d = 0.172). When taking into account the first period (T0-T1) of the study, only on the eye hand coordination test there is a significant difference with a small effect size between the intervention in favor of the regular physical education (p = 0.005; Cohen’s d = 0.447).. Table 3. Intervention comparison. a.. Intervention comparison for school I n. regular physical education. Table Stars @school. mean difference T2-T1 (SD). mean difference T1-T0 (SD). p-value. Cohen’s d. SB (s). 95. 1.29 (13.62). 7.93 (13.6). 0.004*. 0.300. WB (steps). 85. 3.12 (8.04). 5.01 (9.7). 0.224. 0.127. SD (s). 94. -0.21 (5.34). -0.08 (6.46). 0.904. 0.012. EHC (catches). 86. 1.29 (4.13). 0.01 (4.02). 0.091. 0.185. MM (targets). 82. 2.57 (6.08). 9.38 (5.71). <0.001*. 0.701. p-value. Cohen’s d. b. Intervention comparison for school II N. regular physical education. Table Stars @school. mean difference T1-T0 (SD). mean difference T2-T1 (SD). SB (s). 55. 7.76 (13.46). 2.91 (14.70). 0.148. 0.198. WB (steps). 58. 5.03 (9.04). -2.36 (9.96). <0.001*. 0.501. SD (s). 57. -2.01 (5.57). -1.92 (4.87). 0.938. 0.010. EHC (catches). 59. 1.97 (3.99). 1.71 (4.46). 0.781. 0.036. MM (targets). 66. 8.15 (6.36). 3.94 (4.82). <0.001*. 0.450. p-value. Cohen’s d. c.. Intervention comparison for both schools n. regular physical education. Table Stars @school. mean difference (SD). mean difference (SD). SB (s). 150. 3.66 (13.75). 6.09 (14.18). 0.209. 0.103. WB (steps). 143. 3.89 (8.48). 2.02 (10.43). 0.150. 0.121. SD (s). 151. -0.89 (5.48). -0.78 (5.96). 0.886. 0.012. EHC (catches). 145. 1.57 (4.07). 0.70 (4.27). 0.137. 0.124. MM (targets). 148. 5.06 (6.78). 6.95 (5.97). 0.038*. 0.172. 10.
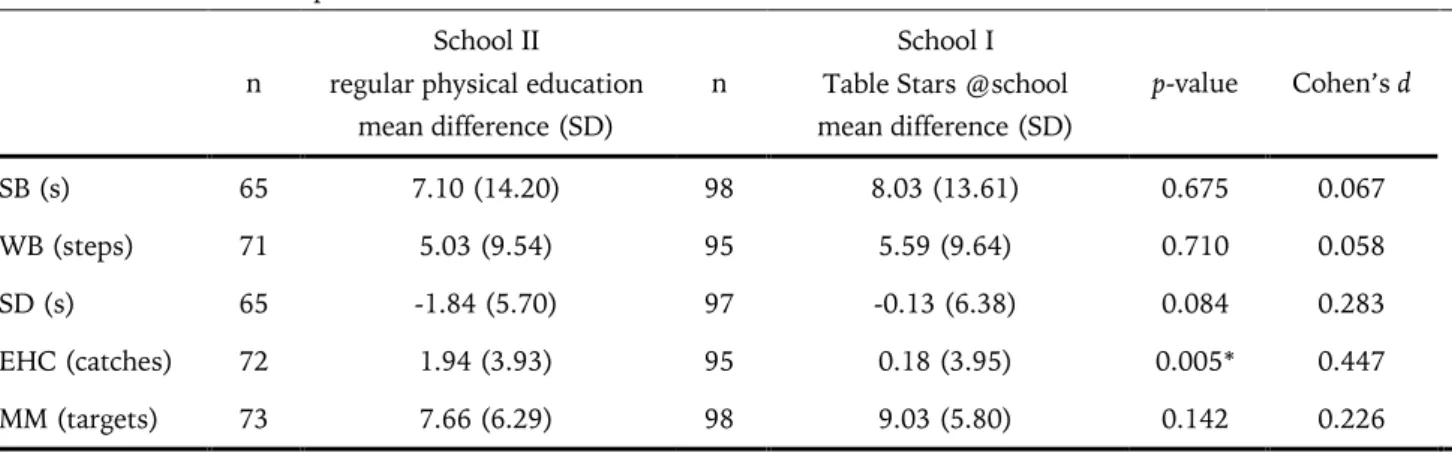
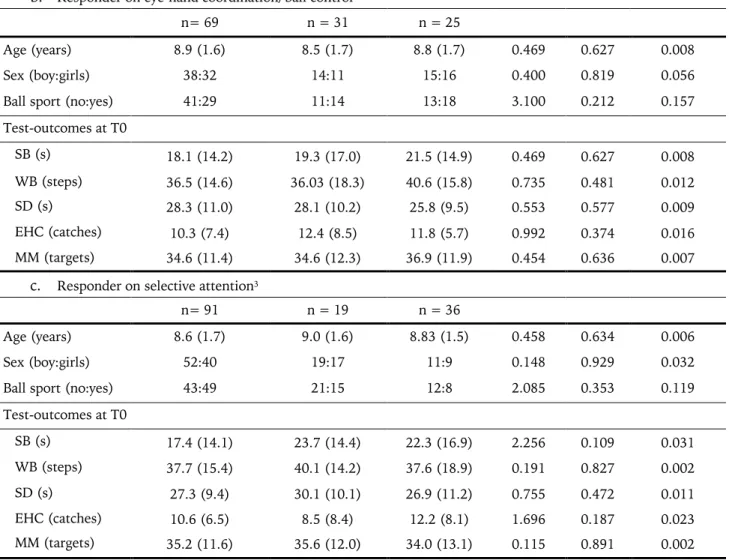
(9) International Journal of Racket Sports Science 1 (1). Faber et al.. d. Intervention comparison T0-T1 School II n. School I n. regular physical education. Table Stars @school. mean difference (SD). p-value. Cohen’s d. mean difference (SD). SB (s). 65. 7.10 (14.20). 98. 8.03 (13.61). 0.675. 0.067. WB (steps). 71. 5.03 (9.54). 95. 5.59 (9.64). 0.710. 0.058. SD (s). 65. -1.84 (5.70). 97. -0.13 (6.38). 0.084. 0.283. EHC (catches). 72. 1.94 (3.93). 95. 0.18 (3.95). 0.005*. 0.447. MM (targets). 73. 7.66 (6.29). 98. 9.03 (5.80). 0.142. 0.226. SB = static balance, WB = Walking backwards, SD = speed while dribbling, EHC = eye hand coordination, MM = map mission. For a, b, and c paired t-test were used to test for differences. For d, an independent t-test was used to test for differences. *p < 0.05.. of the children were identified as responders of the Table Stars @school program versus only 13% of the regular physical education program. No significant differences were found between the non-responders and responders regarding their age, sex, ball sport participation and the baseline test outcomes, except for one. Table Stars @school responders scored significantly lower with small effect sizes on the balance tests (SB: p = 0.020, partial η2 = 0.501; WB: p = 0.011, partial η2 = 0.501).. Response analyses Table 4 presents the number of children that could be identified as non-responder or responder for balance, eye-hand coordination/ball control and selective attention. Regarding the perceptuo-motor skills it seemed that approximately 25% of the children responded on the regular physical education lessons versus 20% on the Table Stars @school lessons. In contrast, for the selective attention approximately 25% Table 4. Response analysis Regular physical education Mean (SD). Table Stars @school Mean (SD). n= 66. n = 33. n = 25. 8.7 (1.6). 9.0 (1.8). Sex (boy:girls). 36:30. Ball sport (no:yes). Non-responders Mean (SD). F-value/ χ2. p-value. partial η2/ Cramer’s Ѵ. 8.7 (1.7). 0.395. 0.675. 0.006. 14:11. 18:16. 0.056. 0.973. 0.021. 33:33. 11:14. 19:15. 0.823. 0.663. 0.081. SB (s). 21.1 (15.8). 19.9 (14.5). 11.6 (10.2). 4.023. 0.020*. 0.062. WB (steps). 39.2 (15.6). 37.6 (15.9). 28.4 (12.5). 4.658. 0.011*. 0.071. SD (s). 28.4 (10.9). 26.4 (9.1). 27.6 (11.6). 0.395. 0.674. 0.006. EHC (catches). 11.0 (7.8). 10.8 (6.5). 11.5 (7.9). 0.069. 0.933. 0.001. MM (targets). 34.3 (12.4). 34.2 (12.4). 35.6 (10.2). 0.744. 0.477. 0.012. a.. Responder on balance1. Age (years). Test-outcomes at T0. 11.
(10) International Journal of Racket Sports Science 1 (1). Faber et al.. b. Responder on eye-hand coordination/ball control2 n= 69. n = 31. n = 25. 8.9 (1.6). 8.5 (1.7). 8.8 (1.7). 0.469. 0.627. 0.008. Sex (boy:girls). 38:32. 14:11. 15:16. 0.400. 0.819. 0.056. Ball sport (no:yes). 41:29. 11:14. 13:18. 3.100. 0.212. 0.157. SB (s). 18.1 (14.2). 19.3 (17.0). 21.5 (14.9). 0.469. 0.627. 0.008. WB (steps). 36.5 (14.6). 36.03 (18.3). 40.6 (15.8). 0.735. 0.481. 0.012. SD (s). 28.3 (11.0). 28.1 (10.2). 25.8 (9.5). 0.553. 0.577. 0.009. EHC (catches). 10.3 (7.4). 12.4 (8.5). 11.8 (5.7). 0.992. 0.374. 0.016. MM (targets). 34.6 (11.4). 34.6 (12.3). 36.9 (11.9). 0.454. 0.636. 0.007. n= 91. n = 19. n = 36. 8.6 (1.7). 9.0 (1.6). 8.83 (1.5). 0.458. 0.634. 0.006. Sex (boy:girls). 52:40. 19:17. 11:9. 0.148. 0.929. 0.032. Ball sport (no:yes). 43:49. 21:15. 12:8. 2.085. 0.353. 0.119. SB (s). 17.4 (14.1). 23.7 (14.4). 22.3 (16.9). 2.256. 0.109. 0.031. WB (steps). 37.7 (15.4). 40.1 (14.2). 37.6 (18.9). 0.191. 0.827. 0.002. SD (s). 27.3 (9.4). 30.1 (10.1). 26.9 (11.2). 0.755. 0.472. 0.011. EHC (catches). 10.6 (6.5). 8.5 (8.4). 12.2 (8.1). 1.696. 0.187. 0.023. MM (targets). 35.2 (11.6). 35.6 (12.0). 34.0 (13.1). 0.115. 0.891. 0.002. Age (years). Test-outcomes at T0. c.. Responder on selective attention3. Age (years). Test-outcomes at T0. SB = static balance, WB = Walking backwards, SD = speed while dribbling, EHC = eye hand coordination, MM = map mission. Differences between responders and non-responders were tested by means of an ANOVA (age, SB, SB, SD, EHC and MM) or Chi-square test (sex and ball sport). 1A responder on balance showed a better development of performances on both SB and WB after either regular physical education or Table Stars @school. 2A responder on eye-hand coordination/ball control showed a better development on both SD and EHC after either regular physical education or Table Stars @school. 3A responder on selective attention scored more than 9 points (i.e. smallest detectable change of MM) better after either regular physical education or Table Stars @school. *p < 0.05.. Table Stars @school intervention when compared to the regular physical education. As no differences could be found between the responders of the Table Stars @school program and the regular physical education in the age, sex, ball sports participation and the test results at baseline, this might be due to other reasons. Perhaps difference in motivation within children for both interventions can explain this (Lewthwaite and Wulf, 2017). As such, Table Stars @school might be of added value to the regular physical education as its. Discussion The results of this first pilot intervention study indicate that the 5-week Table Stars @school program contributes at a similar level to the development of children in primary schools as regular physical education. For that reason, there seems to be no opposing arguments for its use. Moreover, it appeared that 20-25% of the children improved more during the. 12.
(11) International Journal of Racket Sports Science 1 (1). Faber et al.. exercises may attract and stimulate other children to improve their skills. Nevertheless, it is important to critically evaluate the set-up and results of this study. A first important issue is the total practice time during the Table Stars. addition to this, it is recommended to consider the criteria for the identification of the responders and non-responders in future research. Although, it was attempted to be as transparent and valid as possible, other solutions might fit as well. Yet, careful selection of the criteria and analyses are required to not over- or underestimate the effect of a certain intervention (Wellek and Blettner, 2012). Finally, it must be acknowledged that the group size was different in both schools. As it was not practicable to conduct a randomized control trial with a stratification per school, both interventions were provided per school in a different order (Fig. 1). This caused a difference in the subsamples for one specific intervention order, which might have affected the results of the intervention analyses; there were more children in school I which caused relatively more weight for that school in the analysis including both schools. Therefore this study’s results should be interpreted with caution. Additionally, it must be mentioned that complete-case approach was followed in this analysis of this study. Although, there is no suspicion of a systematic drop-out, the missing values raised up to approximately 30% of the total sample which might have biased the study results to some extent (Eekhout et al., 2012). It is recommended in future studies to avoid missing values or use imputation techniques to better deal with missing data.. @school. As the proposed intervention is only 5-weeks with a frequency of one lesson a week, it is quite difficult to reach a significant and practically different skills level. It is likely that more time on the task is needed to reveal a contribution of the specific Table Stars @school exercises to the enhancement of perceptuo-motor skills and selective attention. The results now show that the 5-week program of Table Stars @school yields similar results as the regular physical education class. However, it was hypothesized that it would contribute to a higher extent to the development than the regular offer. Is it likely that intensifying the program and use at least both physical education classes for 5-weeks for the Table Stars @school program is crucial to obtain improvement (Platvoet et al., 2016). This would not only enlarge the amount of practice, but will also be a fairer comparison to regular physical education. Additionally, one might want to consider integrating exercises of Table Stars @school program in the physical education program to really make a difference. This would enrich the current program and get rid of the ‘drop in the ocean effect’, thus letting children improve a wider range of skills on a long-term base that is of added value for a broader development. It is not only about promoting a sport, but contributing to the children’s development through (the fundamentals of) sports. Another issue is the influence of children’s other activities (e.g. sports history and (deliberate) play). Although we checked for the children’s current participation in ball sports, we did not take into account their full sports history including the quality and quantity of previous and current training (Hopwood et al., 2016). Moreover, it is difficult to estimate a child’s participation in other activities like (deliberate) play in- and outside. However, this information could provide a better insight when profiling the responders and non-responders. In. Conclusions To summarize, the Table Stars @school program was evaluated in comparison to regular physical education lessons concerning the development of perceptuo-motor skills and selective attention. Generally speaking it seems that the Table Stars @school intervention yields similar effects as regular physical education, however, it might attract other children to develop their skills. For that reason, it seems legitimate to implement Table Stars @school in the original form in physical education classes. Yet, it is recommended for future to intensify the 5-week program or integrate it into the physical education classes to increase the effects and contribute to a broader development. This is expected to contribute to. 13.
(12) International Journal of Racket Sports Science 1 (1). Faber et al.. the children’s development regarding their perceptuomotor and attention skills to a higher extent.. table tennis? A validity and reproducibility study. PloS one, 9(1), e85657. Faber, I. R., Nijhuis-Van Der Sanden, M. W., Elferink-Gemser, M. T., & Oosterveld, F. G. (2015). The Dutch motor skills assessment as tool for talent development in table tennis: a reproducibility and validity study. J Sport Sci, 33(11), 1149-1158. Faber, I. R., Elferink-Gemser, M. T., Faber, N. R., Oosterveld, F. G., & Nijhuis-Van der Sanden, M. W. (2016). Can perceptuo-motor skills assessment outcomes in young table tennis players (7–11 years) predict future competition participation and performance? An observational prospective study. PloS one, 11(2), e0149037. Faber, I. R., Pion, J., Munivrana, G., Faber, N. R., & Nijhuis-Van der Sanden, M. W. (2018). Does a perceptuomotor skills assessment have added value to detect talent for table tennis in primary school children? J Sport Sci, 36(23), 2716-2723. Hopwood, M., Macmahon, C., Farrow, D., & Baker, J. (2016). Is practice the only determinant of sporting expertise? Revisiting Starkes (2000). Int J Sport Psychol, 47(1), 631-651. Henderson S. E., Sugden D. A., Barnett A. L. (2007). Movement assessment battery for children-2 second edition [Movement ABC-2]. London: The Psychological Corporation. Kiphard, E. J., & Schilling, F. (2007). Körperkoordinationstest für kinder: KTK. Beltz-Test. Lewthwaite, R., & Wulf, G. (2017). Optimizing motivation and attention for motor performance and learning. Curr Opin Psychol, 16, 38-42. Manly, T., Anderson, V., Nimmo-Smith, I., Turner, A., Watson, P., & Robertson, I. H. (2001). The differential assessment of children's attention: The Test of Everyday Attention for Children (TEA-Ch), normative sample and ADHD performance. J Child Psychol Psych, 42(8), 1065-1081. Moffitt, T., Arseneault, L., Belsky, D., Dickson, N., Hancox, R. J., Harrington, H., Houts, R., Poulton, R., Roberts, B. W., Ross, S., Sears, M. S., & Murray Thomson, W. (2011). A gradient of childhood selfcontrol predicts health, wealth, and public safety. Proceedings of the National Academy of Science of the United States of America, 108, 2693-2698.. Acknowledgments We acknowledge the children, their parents/caretakers and the schools for participation in this study. We also thank all physical education students and trainers for their cooperation in datacollection. Special thanks go to Marije van Verseveld for her contribution to this study concerning the organization and data collection and to the Netherlands Table Tennis Association for their ongoing support and making it possible to conduct this study. All experiments of this study comply with the current laws of the country in which they were performed.. References Balyi, I. (2001). Sport system building and long-term athlete development in British Columbia. Coaches Report, 8(1), 22-28. Best, J. R. (2010). Effects of physical activity on children’s executive function: Contributions of experimental research on aerobic exercise. Dev Rev, 30(4), 331-351. Budde, H., Voelcker-Rehage, C., PietraßykKendziorra, S., Ribeiro, P., & Tidow, G. (2008). Acute coordinative exercise improves attentional performance in adolescents. Neurosci Let, 441(2), 219223. Bushnell, E. W., & Boudreau, J. P. (1993). Motor development and the mind: The potential role of motor abilities as a determinant of aspects of perceptual development. Child Dev, 64, 1005-1021. Cohen, J. (1988). Statistical power analysis for the behavioral sciences (2nd ed.). New York: Lawrence Erlbaum Associates. Eekhout, I., de Boer, M. R., Twisk, J. W., de Vet, H. C., & Heymans, M. W. (2012). Brief Report: Missing Data: A Systematic Review of How They Are Reported and Handled. Epidemiology, 729-732. Faber, I. R., Oosterveld, F. G., & Nijhuis-Van der Sanden, M. W. (2014). Does an eye-hand coordination test have added value as part of talent identification in. 14.
(13) International Journal of Racket Sports Science 1 (1). Faber et al.. NTTB (2018). Table Stars – De fijnste motoriek methode [Table Stars – The finest motor skills method.]. Zoetermeer (NL): Nederlandse Tafeltennis Bond. Platvoet, S. W., Elferink-Gemser, M. T., Kannekens, R., de Niet, M., & Visscher, C. (2016). Four weeks of goal-directed learning in primary physical education classes. Percept Motor Skills, 122(3), 871-885. Platvoet, S., Faber, I., De Niet, M., Pion, J., Kannekens, R., Elferink-Gemser, M., & Visscher, C. (2018). Development of a tool to assess fundamental movement skills in applied settings. Frontiers in Education, 3, 75. Schmidt, R. A., & Lee, T. D. (2011). Motor control and learning: A behavioral emphasis (5th ed.). Champaign, IL: Human Kinetics. Table Tennis Canada (2015). Long Term Athlete Development Model – Table Tennis 4 Life. Ottawa: Table Tennis Canada. Vandorpe, B., Vandendriessche, J., Lefèvre, J., Pion, J., Vaeyens, R., Matthys, S. A., Philippaerts, R., & Lenoir, M. (2011). The KörperkoordinationsTest für Kinder: reference values and suitability for 6–12-yearold children in Flanders. Scan J Med Sci Sport, 21(3), 378-388. Wang, B., Guo, W., & Zhou, C. (2016). Selective enhancement of attentional networks in college table tennis athletes: a preliminary investigation. PeerJ, 4, e2762. Wellek, S., & Blettner, M. (2012). On the proper use of the crossover design in clinical trials: part 18 of a series on evaluation of scientific publications. Deutsches Ärzteblatt International, 109(15), 276. Wuang, Y. P., Su, J. H., & Su, C. Y. (2012). Reliability and responsiveness of the Movement Assessment Battery for Children–Second Edition Test in children with developmental coordination disorder. Dev Med Child Neurol, 54(2), 160-165.. 15.
(14)
Figure
+2
Documento similar