A study in vowels: Comparing phonetic difficulties between languages
13
0
0
Texto completo
(2) José Javier Juan Checa. A study in vowels. 376. I. Abstract Decade after decade language learning still proves difficult for EFL learners all around the world. Countries are consistently having the same phonetic problems they had. This article wants to present two methods commonly used when comparing languages (contrastive analysis and statistics) and add two more, relatively fresh methods (spectrographic analysis and Johari windows), in order to find a new angle to look at old problems. By taking into account more points of view, the resulting data could be a starting point for future researchers facilitating EFL learning for future generations. Keywords: EFL, English vowels, spectrography, statistics, Johari window, contrastive analysis hypothesis.. II. Introduction When looking through the past history of language learning and its phonetic difficulties, one will find that in the last 100 years not much has changed. Edward Gauntlett, one of the first Linguists studying English pronunciation, while applying modern methods like contrastive analysis, described already in 1914 the same phonetic difficulties Japanese EFL learners still face today (Ashby, and Saito 2013). This is not an isolated idiosyncrasy, since similar conclusions can be found for most countries that actually bothered to inquire about such matters from almost a century ago. Quite obviously the wheels of research have been spinning in that time, but it seems that they are stuck in the mud, because the best way to summarize the poor progress made in all that time is an even older quote by Goethe: «And here I am, for all my lore, the wretched fool I was before». This article will follow the philosophy behind my PhD research: trying to deliver an original and interdisciplinary approach at the same time. After all, cognitive linguistics is defined as an interdisciplinary branch of linguistics. And originality is something that is asked of every single PhD student anyway.. III. Objectives This article will thus honor those two key tenets (originality and interdisciplinary) by using both proven linguistic research methods as well as methods used in fields different than linguistics. First, I will describe Contrastive Analysis Hypothesis and Statistics, both very common research methods throughout the years when it comes to comparing languages. Second, I will explain two methods,. | Índex.
(3) Fòrum de Recerca. Núm. 23/2018, p. 375-387 ISSN: 1139-5486. DOI: http://dx.doi.org/10.6035/ForumRecerca.2018.23.25. spectrographic analysis (hailing from physics) and Johari windows (a heuristic technique originating from the psychological field) that when used alongside traditional methods should deliver maybe a look at old problems from a fresh perspective that could benefit future linguists.. IV. Methodology I am going to quickly present two methods that have been commonly used in research comparing languages and then provide some further explanation about two methods that, I suggest, should be added to the comparison of languages. First, the contrastive analysis hypothesis (henceforth CAH) can be defined as the systematic study of two (or more) languages in order to identify both their structural similarities and differences. CAH has been for decades one of the best methods when it comes to language acquisition. It is an effective procedure when you want to compare the speaker’s native language (L1) against another language (L2) and how the L1 itself could predictably affect the learning of L2. Hence CAH concentrates at the differences and similarities between at least two languages. This contrastive approach emerged after the end of the Second World War when the US gave importance to foreign language learning. Furthermore, an increasing amount of research based on bilingualism of immigrants was being published. Professor Robert Lado defined in 1957 the so-called strong version of CAH, which states that all errors made in L2 were due to interference by L1 and subsequently all errors could be predicted. No empirical evidence has sustained this claim (Banathy et al. 1966) and it neglected essential criteria such as age. It also focused too much on the inference aspect of the L1 language and offered little use to language teachers (Newmark, and Reibel 1968). After this strong version, researchers defined an alternative, the so called weak version; this one commences with the errors already made by the learner which then gets explained as much as possible by designating the differences and similarities between both languages (Stockwell 1967). This is viewed as a complementary research to error analysis and intrinsically shares a few of the typical mistakes (e.g. error analysis is not enough when you want to identify learning complications). Finally, a third (and last) iteration of CAH, a moderate version, came around and became an essential research method for second language acquisition: «the categorization of abstract and concrete patterns according to their perceived similarities and differences is the basis for learning; therefore, wherever patterns are minimally distinct in form or meaning in one or more systems, confusion may. | Índex. 377.
(4) José Javier Juan Checa. A study in vowels. result» (Oller, and Ziahosseiny 1970). It clearly contradicts Lado’s original variant, since the hypothesis here goes the other way round: the more different the L2 is from your own L1, the easier it will be to learn the targeted new language.. Figure 1: An Example of CAH. Furthermore, language awareness is a very profitable language learning method for advanced and/or adult learners and it is part of teacher training programmes at many universities (König, and Gast 2009). The second method is statistics, which is commonly defined as a mathematical branch, which deals with data collection, organization, analysis, interpretation and presentation. It is ergo also known to be a quantitative approach to research when linguistics and languages usually use qualitative methods. These use data exclusively for identifiying language feature usage and then afterwards describing them, while giving real-life examples of specific phenomena (Cantos Gómez 2013). Supplementing these qualitative analyses of language with the quantitative research method of statistics, can contribute fruitfully to linguistic analysis and research. In the latter, linguistics features are classified and counted to create even more complex statistical models, that explain in more details the observed facts (Cantos Gómez 2013). Table 1: Example of Consonant vs. Vowel Distribution Chart. Despite some linguists dismissing quantitative methods, due to lack of training, or even disliking them due to belonging to the realms | Índex. 378.
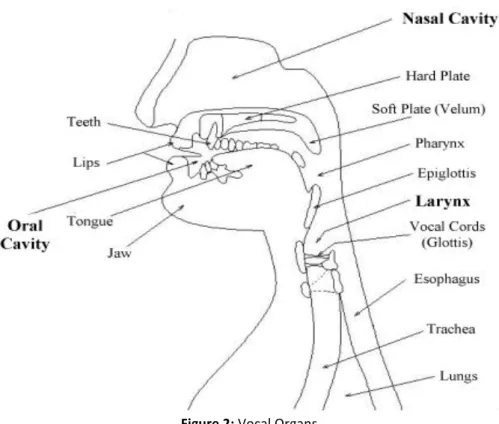
(5) Fòrum de Recerca. Núm. 23/2018, p. 375-387 ISSN: 1139-5486. DOI: http://dx.doi.org/10.6035/ForumRecerca.2018.23.25. of mathematical sciences, the most popular statistical techniques are also the most accesible ones. In regards to linguistic purposes (Cantos Gómez 2013), they have been used: 1. to observe and describe certain aspects of language phenomena 2. to apply quantitative techniques or model to problems related to describing natural language or language teaching 3. to solve methodological problems of linguistic measurement or sampling The first new method I propose is spectrography, which is a relatively new approach to linguistics and since it originated in a different field it needs to be explained from the beginning, with the definition of sound. Sound can be defined as pressure oscillation occurring very rapidly one after another. These fluctuations move through a medium (e.g. gas, water or air) that is elastic enough to allow molecules to crowd together and move apart. In human physiology some of the sounds are called speech. The fluctuations here are caused by the actions (e.g. vibrations) of the vocal organs against the outgoing amount of lung air.. Figure 2: Vocal Organs. The vibrations made in the vocal tract can be visually represented by speech waveforms. These are graphs that visually represent how pressure variation changes with time.. | Índex. 379.
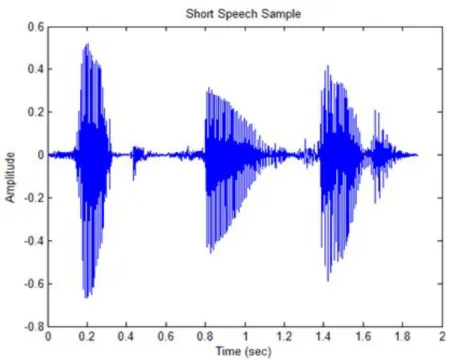
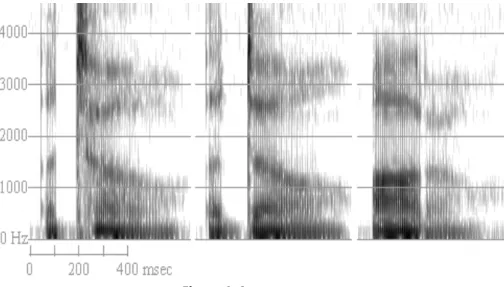
(6) José Javier Juan Checa. A study in vowels. 380. Figure 3: Speech Waveform. The y-axis measures the pressure variation (measured as amplitude) while the x-axis reflects the time needed for the changes of pressure. The amplitude can be defined as a measure of the average pressure variation from normal atmospheric pressure. Some graphs can show a straight line in the centre of the waveform (0 amplitude), which represents normal atmospheric pressure. If the wave is above 0 it means that the pressure is greater than the atmospheric pressure while being below 0 means that pressure is lower than the atmospheric one. Waveforms have one problem though: it is near impossible to read them as words. Through the use of Fourier analysis we can find out what frequencies are present at any given moment in the speech signal. The result of this analysis can be graphically represented as a spectrum: the amplitude of the sinewave components that are present in the signal within a given time window. Several spectra though still don’t let us identify the sounds in words. But if we compute the spectrum for one short section of speech and keep computing the spectrum for the adjoining short section of speech until the end of the waveform we’ll be able to display all the computed spectra in a 3D graph. This graph is called a spectrogram, a visual representation of the frequency and intensity of speech sounds against time.. | Índex.
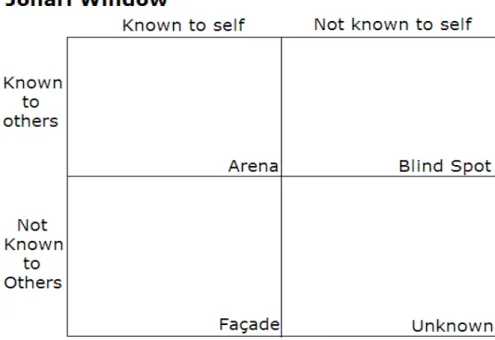
(7) Fòrum de Recerca. Núm. 23/2018, p. 375-387 ISSN: 1139-5486. DOI: http://dx.doi.org/10.6035/ForumRecerca.2018.23.25. 381. Figure 4: Spectrogram. Spectrograms like picture aboved can be read due to the idiosyncratic phonetic features of phonemes and thus spectrographic analysis can be used to improve language learning (Ladefoged, and Johnson 2011). The second new method I am adding is the Johari window, which is a heuristic method developed, back in 1955, by psychologists Joseph Luft and Harrington Ingham. Heuristics are techniques that solve problems, learn or discover new information through practical methods though in some cases, due to cognitive biases, can lead to systematic errors. With proper care though, heuristics result in easily accesible information in order to solve problems or even abstract issues (Michaelewicz, and Fogel 2000). A Johari window, as originally used in psychological contexts, aims to improve interpersonal relationships and communications (Luft, and Ingham 1955). It is represented by a window divided into 4 quadrants – the top left window is called arena/open, the top right window is referred to as blind (spot). On the bottom left we have the façade/hidden window and the final window on the bottom right is the unknown quadrant (Verklan 2007).. | Índex.
(8) José Javier Juan Checa. A study in vowels. 382. Figure 5: Johari Window. The arena quadrant represents characteristics that everyone, including the subject in question, knows. The façade quadrant consists of characteristics the subject knows about himself but keeps from others. The blind spot reveals characteristics that are unknown to the subject, but known to everyone else. Finally, the unknown contains characteristics that no one knows about the subject. This model for interpersonal awareness has come a long way since the 50s and has since been applied to a vast array of learning situations and educational tools (Halpern 2009). My proposal is to adapt it for linguistic means. The original consists of two variables, number of persons and knowledge, thus my adapted model consists of two variables too. In this case, the variables will represent different language features.. V. Results We are now ready to research data that will be analyzed with «four different pair of eyes», since each method comes from a different scientific field (tenet number one: interdisciplinary). These four different methods are my four pillars that serve as foundation for my PhD research. They are also my proposal to put a new spin on linguistic research on phonetic difficulties that so far has not improved the pronunciation of EFL learners all around the world (tenet number two: originality). The 4 methods that ideally converge together to improve future research are: 1. Contrastive Analysis Hypothesis (Linguistics) 2. Statistics (Mathematics) | Índex.
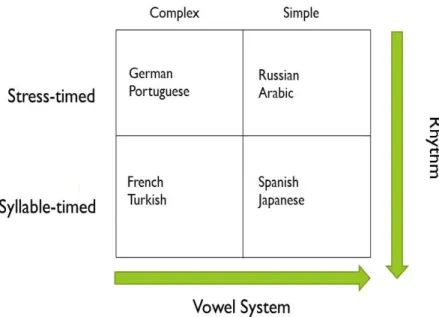
(9) Fòrum de Recerca. Núm. 23/2018, p. 375-387 ISSN: 1139-5486. DOI: http://dx.doi.org/10.6035/ForumRecerca.2018.23.25. 3. Spectrographic Analysis (Physics) 4. Johari window (Psychology) As usual, CAH and statistics, continue their rapport by giving statistical explanations to linguistic differences or similarities. So far so good. But now let us look at what the other two methods can contribute and let us start with the Johari window. The original definition of what it does, has been, alongside with the Johari window itself, modified by me in order to adapt to my needs. As of now, this adapted Johari window is a technique that helps linguists better understand the relationship between speech characteristics. For my PhD research on phonetical difficulties with English vowels, I focused on rhythm and vowel systems in order to produce original results. Using these two features as variables in comparing different languages against English helps us add a different point of view to the standard CAH method used in linguistics. English, as we know, is a stress-timed language with 5 vowels with 13 vowel phonemes in the RP variant. The first feature, rhythm (also called isochrony), has been defined as language rhytmically dividing time into equal portions. Up until recently, linguists assumed there were three ways in which language can divide time: 1. Stress-timed, where the duration of every syllable is equal 2. Syllable-timed, where the interval between two stressed syllables is equal 3. Mora-timed, where the duration of every mora is equal However, current research argues that the difference between syllable-timed and mora-timed is neglectable, and subsequently, there are only two rhythms (Nespor, Shukla, and Mehler 2010) . For my Johari window it is ultimately irrelevant since I am not using mora-timed language for my research, but in order to use the Johari window effectively I distinguished thus only between stress-timed and syllable-timed languages. My second feature, vowel system, is a very uncommon way to differentiate languages, but since my research focuses exclusively on phonetic difficulties with vowels, it is only right to separate languages into two camps. On the one hand, we have languages that have 5 vowels and precisely 5 vowel phonemes. I defined these languages as having simple vowel systems. On the other hand, we have languages that also have 5 vowels, but more than 5 vowel phonemes, which means that every vowel has several different vowel phonemes. These languages have complex vowel systems. With my distinctions clearly explaind the resulting adapted Johari window would look like this:. | Índex. 383.
(10) José Javier Juan Checa. A study in vowels. 384. Figure 6: Adapted Johari Window. In the top left window, we have languages like German or Portuguese that share both the rhythm (stress-timed) and the complex vowel system with English. The top right window includes languages like Russian or Arabic, that share the rhythm (stress-timed) but not vowel system with English(both languages have a simple vowel system). Continuing with the bottom left window, we have languages like French or Turkish, that share the complex vowel system, but not the rhythm (both are syllable-timed) with English. Finally, the bottom right window, includes languages like Spanish or Japanese, that share neither rhythm, nor vowel system with English. With the Johari Window fully defined, we come to the final part. Usually, when you record EFL learners from different languages, you analyze their speech afterwards with a native speaker of the language you are interested in. At best, you are able to find a helpful English professor with a background in linguistics that is willing to spare hours and hours to analyze several dozens of recorded data. Let us just ignore the fact, that sometimes the native speaker you need to analyze the data, has no linguistic knowledge, or even an official teacher diploma. Let us instead be bothered by the fact, that even native speakers, sometimes, can have problems correctly reviewing English pronunciation. This could lead in some cases to skewed results, where the researcher was stricter than the native speaker, when it came to analyzing speech recordings. This is where my final contribution comes in, the spectrographic analysis. Every phoneme occurs at certain frequencies, which means | Índex.
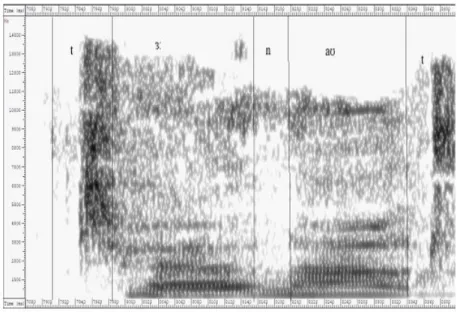
(11) Fòrum de Recerca. Núm. 23/2018, p. 375-387 ISSN: 1139-5486. DOI: http://dx.doi.org/10.6035/ForumRecerca.2018.23.25. that modern software analyzes objectively if the spoken phoneme occurs at the right frequency. I will demonstrate this with a spectrogram of the word «turnout».. Figure 7: Spectrogram of «turnout». Vowels are easily recognizable on a spectrogram because of formants. They are peaks of amplitude around a given frequency in the speech wave due to a resonance of the vocal tract. There are usually many formants for a periodic sound and each formant depends on the position of the tongue and lips. Graphically they are represented by clear bands of energy and their location and the distance between each of the formants tells us roughly the identity of the vowel. Since these formants occur at relatively lower frequencies (F1 occur from 250-900Hz, while F2 occur from 2700800Hz) we’ll zoom in on the spectrogram (Ball, and Rahilly 1999).. Figure 8: Zoomed in Spectrogram of «turnout». | Índex. 385.
(12) José Javier Juan Checa. A study in vowels. They occur on lower frequencies due to the fact that the first formant (henceforth F1) relates to the tongue height while the tongue location relates to the second formant (F2). You can clearly see the darker sections. These are the formants for /ɜː/. Finally, the amount of energy used for a prolonged period of time shows that it is the long vowel /ɜː/. Every vowel phoneme has clearly defined formants, and thanks to modern software we can actually analyse if the phoneme is spoken correctly, thus adding an additional second opinion, besides the native speaker’s analysis. Having two sets of results is extremely useful, not because of the similar results, but especially when the software and the native’s ear classify a phoneme differently.. VI. Conclusions All these different methods from different fields, united to gain additional information on language learning, serve one small purpose: to serve as a starting point. My idea has always been to create data; data that could help others. Data that could inspire others, to take the baton and keep investigating in this direction. Or realizing it is actually the opposite direction. It does not matter, whether we gain knowledge one way or another. All this research was never about lofty dreams of solving the conundrum of language learning, the Gordian Knot of phonetic difficulties. It was always about interdisciplinarity and originality. And (hopefully) delivering some good work. This may be some food for thought for upcoming researchers looking at the same problems linguists have for over a century, but hopefully seeing something different which may provide an actual solution to an old problem. Let us recall the words of the Hungarian Nobel prize winner for biology, Albert Szent Gyorgyi: «be modest in everything, except your aims».. VII. References Ball, Martin, and Joan Rahily. 1999. Phonetics: The Science of Speech. London: Routledge. Banathy, Bela, Edith Trager, and Carl Waddle, eds. 1966. «The Use of Contrastive Data in Foreign Language Course Development.»In Trends in Language Teaching, edited by Albert Valdman. New York: McGraw-Hill. Cantos Gómez, Pascual. 2013. Statistical Methods in Language and Linguistic Research. Sheffield: Equinox.. | Índex. 386.
(13) Fòrum de Recerca. Núm. 23/2018, p. 375-387 ISSN: 1139-5486. DOI: http://dx.doi.org/10.6035/ForumRecerca.2018.23.25. Halpern, Helen. 2009. «Supervision and the Johari Window: A Framework for Asking Questions.» Education for Primary Care 20 (1): 10-14. König, Ekkehard, and Volker Gast. 2009. Understanding EnglishGerman Contrasts. Berlin: Erich Schmidt Verlag. Ladefoged, Peter, and Keith Johnson. 2011. A Course in Phonetics. Belmont: Wadsworth. Luft, Joseph, and Harry Ingham. 1961. «The Johari Window, a Graphic Model of Interpersonal Awareness.» Human Relations Training News 5 (9): 6-7. Michalewicz, Zbigniew, and David Fogel. 2000. How to Solve It: Modern Heuristics. Berlin: Springer Verlag. Nespor, Marina, Mohinish Shukla, and Jacques Mehler, eds. 2011. «48 Stress-timed vs. Syllable-timed Languages.» In The Blackwell Companion to Phonology, edited by Marc van Oostendorp, Colin J. Marc, Elizabeth V. Hume, and Keren Rice, 48. Hoboken: Wiley. Newmark, Leonard, and David Reibel. 1968. «Necessity and Sufficiency in Language Learning.» International Review of Applied Linguistics in Language Teaching 9 (1-4): 145-164. Oller, John, and Said Ziahosseiny. 1970. «The Contrastive Analysis Hypothesis and Spelling Errors.» Language Learning 20 (2): 183189. Saito, Hiroko, and Michael Ashby. 2013. «Edward Gauntlett’s Phonetics (1905).» Paper presented at the Proceedings of the Phonetics Teaching and Learning Conference 2013. Stockwell, Robert, and Donald Bowen. 1967. «The Sounds of English and Spanish.» Chicago: The University of Chicago Press. Verklan, Terese. 2007. «Johari Window: A Model for Communicating to Each Other.» The Journal of Perinatal & Neonatal Nursing 21 (2): 173-174.. | Índex. 387.
(14)
Figure
+3
Documento similar
