Infrared spectroscopy of eruptive variable protostars from VVV
C. Contreras Pe˜na,
1,2,4‹P. W. Lucas,
2‹R. Kurtev,
3,4D. Minniti,
1,5A. Caratti o Garatti,
6F. Marocco,
2M. A. Thompson,
2D. Froebrich,
7M. S. N. Kumar,
2,8W. Stimson,
2C. Navarro Molina,
4,3J. Borissova,
3,4T. Gledhill
2and R. Terzi
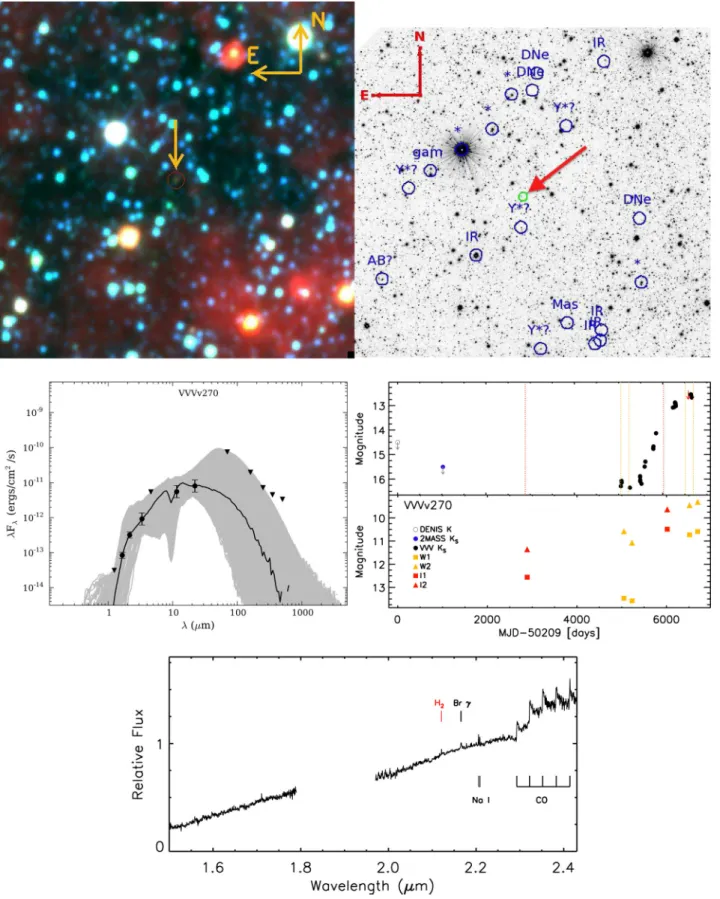
21Departamento de Ciencias Fisicas, Universidad Andres Bello, Republica 220, Santiago, Chile 2Centre for Astrophysics Research, University of Hertfordshire, Hatfield AL10 9AB, UK
3Instituto de F´ısica y Astronom´ıa, Universidad de Valpara´ıso, ave. Gran Breta˜na, 1111, Casilla 5030, Valpara´ıso, Chile 4Millennium Institute of Astrophysics, Av. Vicuna Mackenna 4860, 782-0436, Macul, Santiago, Chile
5Vatican Observatory, V-00120 Vatican City State, Italy
6Dublin Institute for Advanced Studies, School of Cosmic Physics, Astronomy and Astrophysics Section, 31 Fitzwilliam Place, Dublin 2, Ireland 7Centre for Astrophysics and Planetary Science, University of Kent, Canterbury CT2 7NH, UK
8Instituto de Astrofisica e Ciencias do Espaco, Universidade do Porto, CAUP, Rua das Estrelas, P-4150-762 Porto, Portugal
Accepted 2016 October 28. Received 2016 October 28; in original form 2016 February 16
A B S T R A C T
In a companion work (Paper I), we detected a large population of highly variable Young Stellar Objects (YSOs) in the Vista Variables in the Via Lactea (VVV) survey, typically with class I or flat spectrum spectral energy distributions and diverse light-curve types. Here we present infrared spectra (0.9–2.5μm) of 37 of these variables, many of them observed in a bright state. The spectra confirm that 15/18 sources with eruptive light curves have signatures of a high accretion rate, either showing EXor-like emission features (v =2 CO, Brγ) and/or FUor-like features (v=2 CO and H2O strongly in absorption). Similar features were seen in some long-term periodic YSOs and faders but not in dippers or short-term variables. The sample includes some dusty Mira variables (typically distinguished by smooth Mira-like light curves), two cataclysmic variables and a carbon star. In total, we have added 19 new objects to the broad class of eruptive variable YSOs with episodic accretion. Eruptive variable YSOs in our sample that were observed at bright states show higher accretion luminosities than the rest of the sample. Most of the eruptive variables differ from the established FUor and EXor subclasses, showing intermediate outburst durations and a mixture of their spectroscopic characteristics. This is in line with a small number of other recent discoveries. Since these previously atypical objects are now the majority amongst embedded members of the class, we propose a new classification for them as MNors. This term (pronounced emnor) follows V1647 Ori, the illuminating star of McNeil’s Nebula.
Key words: stars: AGB and post-AGB – stars: low-mass – stars: pre-main-sequence – stars: protostars – stars: variables: T Tauri, Herbig Ae/Be – infrared: stars.
1 I N T R O D U C T I O N
The incidence and theory of episodic accretion in young stellar objects (YSOs) and the associated eruptive variability is one of the biggest remaining gaps in our understanding of star forma-tion. While the number of photometrically and spectroscopically verified eruptive variable YSOs remains small, the topic has at-tracted increasing attention from observers and theorists in recent years, alongside a more general effort to improve our understand-ing of lower level accretion variations and photometric variability
E-mail:[email protected](CCP);[email protected](PWL)
HR diagrams would strongly depend on the YSO’s accretion his-tory. Moreover, the lasting effects of episodic accretion would have to be taken into account not only in stellar evolution theory (Baraffe, Chabrier & Gallardo2009; Baraffe, Vorobyov & Chabrier2012) but also in the theory of planet formation and planet migration.
This paper forms the second part of our investigation of eruptive variability in the VISTA Variables in the Via Lactea (VVV) survey (Minniti et al. 2010; Saito et al.2012), the first panoramic time domain survey of the Milky Way at IR wavelengths. In the first part (Contreras Pe˜na et al. 2016, hereafter Paper I), we described the discovery of 816 high-amplitude IR variables (Ks>1 mag) in the mid-plane section of the VVV disc region, a well-studied region in the fourth Galactic quadrant (longitude 295◦<l<350◦, latitude
−1◦.1<b<1◦.1. Most of these variables were located in star forma-tion regions (SFRs) and have very red spectral energy distribuforma-tions (SEDs), consistent with YSO classification. We estimated that about half of the 816 are YSOs and we made a preliminary classification of each into one of the following categories: eruptive, fader, dipper, short-term variable (STV), long-term periodic variable (LPV-YSO), eclipsing binary and Mira-like variable (LPV-Mira). The Mira-like variables were distinguished by their relatively smooth, approxi-mately sinusoidal light curves, as distinct from LPV YSOs with significant lower level scatter on short time-scales, superimposed on a higher amplitude long-term periodic variation. The eruptive variables typically displayed outburst durations of 1–4 yr, but in some cases, the eruptions were much shorter or lasted for>4 yr. We posited that variables with eruptive LC were mainly YSOs undergoing episodic accretion and we further suggested that this mechanism (or variations on it) causes the variability of some of the faders and LPVs. The dippers (sources with relatively brief but deep drops in the LC) would more naturally be explained by variable extinction, although we note that the near-IR colour variability in many sources in this class does not follow the reddening path. The STVs typically had lower amplitudes and had a bluer distribution of SEDs than the rest, so the variability in most cases is more likely due to rotational modulation by bright or dark spots on the stellar photosphere or periodic extinction (e.g. by a warped inner disc), rather than episodic accretion.
Spectroscopic follow-up remains essential to test our initial con-clusions, in part, because the sparsely sampled VVV LC and SEDs alone are insufficient to classify individual sources reliably. More-over, we have only two epochs of colour variability data in theJHKs filters (supplemented by four epochWISE+NEOWISE mid-IR data in some cases), so while the evidence suggested that variable ex-tinction is not the main cause of variability in the eruptive systems, spectroscopic confirmation is required.
Most eruptive variable YSOs have historically been classified as either FUors (after FU Orionis) or EXors (after EX Lupi). FUors have long-duration outbursts (typically decades but at least 10 yr), whereas EXors typically have outburst durations of weeks to months, with a maximum of 1.5 yr (Herbig 2008). The classical view is that FUors are at an earlier evolutionary stage and belong to the transitional phase between class I and class II objects, whilst EXors are associated with instabilities in the discs of class II objects. However, both classes of young eruptive variables were originally defined from optical detections in nearby SFRs (Herbig1977,1989), which tends to exclude younger YSOs which have higher accretion rates but are too deeply embedded in circum-stellar matter to be observed at visible wavelengths.
FUors display strong CO absorption in the first overtone bands at 2.3–2.4μm and they often show broad H2O absorption bands from 1–2.5μm also. These absorption bands are thought to arise in the
circum-stellar accretion disc (perhaps 1 au from the star; Connelley & Greene2014). The disc is heated in the mid-plane by viscous accretion and absorption occurs in the cooler surface layers. FUors typically lack emission lines in their IR spectra. By contrast, EXors show strong HIrecombination lines in emission. During outburst, the first overtone CO bands are in emission also but they are seen in absorption during quiescent periods. The HIlines are attributed to infalling matter close to the star and they often display∼100 km s−1 linewidths. The CO emission is thought to arise in the inner part of the accretion disc which has a temperature inversion due to external heating by the star. NaIand CaIemission lines are also sometimes seen in EXors during outburst, their behaviour correlating closely with CO (Lorenzetti et al.2009). CO, NaIand CaIabsorption lines in classical EXors arise in the stellar photosphere. This of course requires that the stellar photosphere is not too heavily veiled by the disc or hidden by high extinction, as often occurs for normal class I YSOs, (e.g. Greene & Lada1996). The accretion events associ-ated with the outbursts of eruptive variables are thought to drive strong outflows (Reipurth & Aspin1997; Magakian et al.2013). FUors have been associated with Herbig–Haro objects (Reipurth & Aspin1997) and drive molecular outflows (Evans et al.1994). FU Orionis itself, although having massive winds, does not drive a molecular outflow (Evans et al.1994), which could be explained by the lack of organization of magnetic fields required for jet launching and collimation in the binary scenario of Reipurth & Aspin (2004) or by previous outflows having cleared away the remnant envelope, leading to a lack of swept-up material which would otherwise con-stitute a molecular outflow (Evans et al.1994). However, classical EXors do not show the evidence of molecular shocks or jets in the near-IR (H2or [FeII] emission) at the sensitivity level of the spectra of Lorenzetti et al. (2009).1
The VVV candidates were initially selected from their variability over only∼2 yr (2010–2012), a time-scale that favours detection of EXors over FUors. However, with VVV, we are sensitive to optically obscured YSOs with a substantial envelope, i.e. systems at an earlier evolutionary stage than most EXors. The VVV candidates are in fact almost all optically invisible at the depth of panoramic surveys such as VPHAS+(Drew et al.2014). This is partly because most of them have intrinsically redder SEDs than most of the classical EXors and FUors and in part because of interstellar extinction towards the relatively distant SFRs (a few kiloparsecs) in which these objects are located (see Section 2). Owing to their earlier evolutionary status, it is likely to be difficult to detect absorption features which arise in the stellar photosphere. In addition, the greater distance of the VVV YSOs biases them towards higher luminosity and mass. This may affect the relative prominence of spectroscopic features relating to the accretion luminosity of the disc and those related to the stellar photosphere (whether seen directly or in reprocessed radiation; see Calvet et al.1991).
Prior to our work with VVV, very few deeply embedded eruptive variables were known. The known examples were OO Ser, V2775 Ori, HOPS 383, V723 Car and GM Cha (Hodapp et al.1996; Persi et al.2007; Caratti o Garatti et al.2011; Safron et al.2015; Tapia, Roth & Persi2015), now supplemented by our two recent discov-eries from the UKIDSS Galactic Plane Survey: GPSV3 in Serpens OB2 and the isolated object GPSV15 (Contreras Pe˜na et al.2014), as well as the recent discovery of CX330 (Britt et al.2016). CX330
1We note that PV Cep does show H
2emission and it is part of the EXor
is an isolated very red source in the direction of the Galactic bulge with extreme (even unique) photometric and spectroscopic properties. As with GPSV15, an eruptive YSO interpretation ap-pears to fit the data best, though we should consider the possibility that these unusual isolated variables are more evolved sources or previously unknown types. To this list, we might also add V1647 Ori (Aspin, Greene & Reipurth2009) and a few other objects that are somewhat less obscured (Av ∼10). These embedded objects, along with a few other less embedded systems, show a mixture of the properties of FUors and EXors. This has given rise to the scenario where, if we think of the outburst phenomena as a contin-uum, these new discoveries may instead represent a ‘connection’ between FUors and EXors, with FUors representing one extreme (long duration) and EXors being the short-duration end of the same phenomenon. In this sense, the different types of outbursts are pro-duced by variations of one or more of the parameters involved in the instabilities which give rise to the outburst (Gibb et al.2006; Fedele et al.2007; Aspin et al.2009).
In this paper, we present the results of IR spectroscopic follow-up of a subset of the 816 high-amplitude variables. The principal aims of this work are first to validate our claim in Paper I to have discovered a large population of eruptive variables, with increas-ing incidence towards earlier stages of evolution, and secondly, to explore the characteristics of these embedded systems.
The paper is divided as follows: in Section 2, we describe the se-lection of the sample and present its photometric properties, includ-ing 70μm data fromHerschelHi-Gal. We also review the near-IR colour variability using two epochs of VVV data, presented previ-ously in Paper I for the full photometric sample. Section 3 describes the near-IR spectroscopic observations and data reduction. In Sec-tion 4, we analyse the general spectroscopic characteristics of the sample, focusing on objects which are found to be likely YSOs. We then analyse these properties according to their LC classification from Paper I and establish which objects likely belong to the erup-tive variable class. In Section 5, we derive accretion luminosities and discuss the classification of our sample in the context of the es-tablished subclasses of eruptive variable YSOs (FUors, EXors) and find that most members of our sample cannot be described by the classical scheme. Finally, in Section 6, we present a summary of our analysis. Individual analyses of objects in our sample are presented in Appendices A–C. LC and spectra of the whole spectroscopic sample are presented in Appendix F.
2 T H E S P E C T R O S C O P I C S A M P L E
We obtained near-IR spectra for 37 members of the 816 high-amplitude variables from Paper I, all taken with the Magellan Baade telescope. All of the 37 stars have red near-IR colours and SEDs and all are projected within 5 arcmin of an SFR, according to our search of the SIMBAD data base and the mid-IRWISEmulticolour images (see Paper I). Some preference was given to sources for which a distance estimate to the associated SFR is available in the literature. We note that the VVV disc region contains no large SFRs within ∼2 kpc, so most of the targets are expected to be more distant.
We preferentially selected sources withKs<14.5 mag at the most recent available epoch in the VVV time series to the observations, in order to obtain good data in a relatively brief observation. Some preference was given to sources with signs of a recent eruption in the LC, though the most recent VVV data available were typically taken several months before the observations. For the first observing run in 2013, we had only one night at the telescope, so we observed
only the sources which either hadKs > 2 mag or a projected location near the massive G305 star-forming complex. In the 2014 run, we included more sources withKs=1 to 2 mag, in order to better represent the full photometric sample.
The spectroscopic sample covers a fair cross-section of the full sample of variables projected against SFRs, though it includes a high proportion of systems with eruptive LC and relatively few sources in each of the other categories. Of the 37 targets, the LC classifi-cations were: 18 eruptive variables, 5 long-term periodic YSOs, 6 Mira-like variables, 2 faders, 3 dippers and 3 STVs. The (mean) magnitude range is approximately 11.5<Ks<14.5, compared to 11.5<Ks<16.25 for the full photometric sample (see Paper I). The sole exception is VVVv815 (see Appendix A), a somewhat fainter source observed as a target of opportunity.
The amplitudes of the 18 candidate eruptive variables in the spectroscopic sample are slightly higher than is typical of the 106 eruptive variables in the photometric sample but the difference is modest: the medianKs=1.88 mag for the former group versus 1.61 mag for the latter group. For the full spectroscopic sample, there is a stronger bias towards higher amplitude systems: the me-dianKs=1.85 mag, versus 1.44 mag for all the high-amplitude variables in SFRs (excluding EBs which are not included in the spectroscopic sample).
For every object, we have 2010–2014Ksphotometry from VVV, with the addition of a single 2015 data point arising from the second epoch of contemporaneousJHKsphotometry, LC classification, as well as the information collected in Paper I using SIMBAD (Wenger et al.2000), Vizier (Ochsenbein, Bauer & Marcout2000) and public near- and mid-IR surveys from the NASA/IPAC Infrared Science Archive. The latter includes information from 2MASS (Skrutskie et al.2006), DENIS (Epchtein et al.1994),Spitzer/GLIMPSE sur-veys (see e.g. Benjamin et al.2003),WISEAll-sky release (Wright et al. 2010), Akari (Murakami et al.2007) and MSX6C (Price et al.2001). In this work, we also use the information from Her-schelHi-Gal (Molinari et al.2010) and the recently available data of NEOWISE (Mainzer et al.2011) and DEEP GLIMPSE (Whitney et al.2011). The 2010–2015KsLC of the 37 objects in our sample are presented in Appendix F. All VVV LC were derived from v1.3 of the VISTA pipeline developed by the Cambridge Astronomical Survey Unit, with the addition of our own saturation correction where necessary (see Paper I).
Information from the literature allows us to estimate a likely distance to our objects, based on distances to areas of star formation found within 300 arcsec in the SIMBAD data base. In general these are near-kinematic distances estimated from radial velocities of emission lines observed towards HIIregions or Infrared Dark Clouds (IRDCs), such as CS (2–1) (Bronfman, Nyman & May1996; Jackson et al.2008),13CO(1–0) (e.g. Russeil & Castets2004) or OH maser emission (e.g. Caswell1998). In some other cases, distances are assumed from the location of the VVV object near-known areas of star formation, such as the G305 star-forming complex.
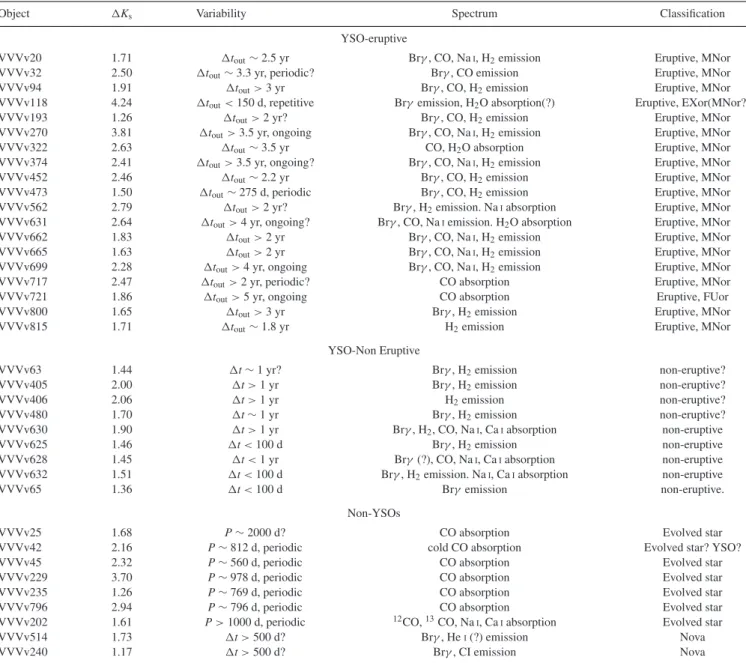
Table 1. Characteristics of the spectroscopic sample of VVV high-amplitude variables. In the last column, ‘non-er’ refers to YSOs not classified as eruptive variables.
No Variable α δ J Jerr H Herr Ks Ks, err Ks α dSFR Shape Type
(J2000) (J2000) (mag) (mag) (mag) (mag) (mag) (mag) (mag) (kpc) (Paper I) (This work) 1 VVVv20 12:28:27.97 −62:57:13.97 17.38 0.04 14.10 0.01 11.70 0.01 1.71 0.6 – Eruptive MNor 2 VVVv25 12:35:14.37 −62:47:15.63 – – 16.01 0.02 12.34 0.01 1.68 0.22 2.2 Eruptive AGB 3 VVVv32 12:43:57.15 −62:54:45.09 16.07 0.01 14.07 0.01 12.45 0.01 2.49 0.32 2.7 LPV-YSO MNor 4 VVVv42 13:09:34.64 −62:49:32.52 18.45 0.10 14.26 0.01 11.94 0.01 2.16 0.98 3.7 LPV-Mira AGB?, YSO?
5 VVVv45 13:11:43.07 −62:48:54.77 – – – – 13.33 0.01 2.31 1.27 3.7 LPV-Mira AGB
6 VVVv63 13:46:20.48 −62:25:30.81 18.53 0.09 15.79 0.02 13.81 0.01 1.44 0.9 3.5 Eruptive YSO, non-er? 7 VVVv65 13:47:51.09 −62:42:37.46 18.75 0.10 15.85 0.02 13.59 0.01 1.36 −0.31 3.5 STV YSO, non-er 8 VVVv94 14:22:57.76 −61:05:47.03 – – 16.42 0.03 13.39 0.01 1.91 0.54 2.6 Eruptive MNor 9 VVVv118 14:51:20.97 −60:00:27.40 16.09 0.01 14.54 0.01 13.01 0.01 4.24 0.16 – Eruptive EXor(MNor?) 10 VVVv193 15:49:14.34 −54:34:23.66 – – 16.59 0.04 13.90 0.01 1.26 0.86 4.2 Eruptive MNor 11 VVVv202 15:54:26.41 −54:08:29.40 17.38 0.03 13.28 0.01 11.66 0.01 1.61 1.16 4.1 LPV-YSO AGB
12 VVVv229 16:04:24.48 −53:01:14.01 – – – – 13.01 0.01 3.7 2.41 2.3 LPV-Mira AGB
13 VVVv235 16:09:35.53 −51:54:14.08 – – 17.95 0.22 11.70 0.01 1.26 1.15 5.3 LPV-Mira AGB 14 VVVv240 16:13:03.44 −51:41:51.91 – – 16.35 0.05 12.10 0.01 1.17 0.74 3.5 LPV-Mira Nova 15 VVVv270 16:23:27.14 −49:44:43.96 – – 18.34 0.23 16.14 0.07 3.81 1.76 2.3 Eruptive MNor 16 VVVv322 16:46:24.57 −45:59:21.04 18.48 0.13 16.82 0.08 15.25 0.04 2.63 0.91 3.1 Eruptive MNor 17 VVVv374 16:58:33.99 −42:49:55.25 17.12 0.02 13.99 0.01 11.98 0.01 2.41 0.91 2.9 Eruptive MNor 18 VVVv405 17:09:38.62 −41:38:51.81 – – 17.50 0.13 13.50 0.01 2.00 1.77 2.3 Dipper YSO, non-er? 19 VVVv406 17:09:57.47 −41:35:48.87 17.51 0.04 14.61 0.01 12.57 0.01 2.06 1.1 2.3 Dipper YSO, non-er? 20 VVVv452 12:41:58.06 −62:13:42.90 18.10 0.06 15.68 0.01 13.78 0.01 2.46 0.4 – Eruptive MNor
21 VVVv473 13:10:57.49 −62:35:22.34 – – – – 14.53 0.01 1.50 1.82 3.7 LPV-YSO MNor
22 VVVv480 13:16:50.32 −62:23:41.61 15.81 0.01 15.08 0.01 14.58 0.01 1.70 -0.28 3.7 LPV-YSO YSO, non-er? 23 VVVv514 14:00:45.37 −61:33:39.95 17.40 0.04 14.80 0.01 13.26 0.01 1.73 -1.46 4.3 Fader Nova 24 VVVv562 14:53:33.59 −59:10:21.73 16.68 0.02 14.20 0.01 12.46 0.01 2.79 -0.01 2.9 Fader MNor 25 VVVv625 15:43:17.95 −54:06:47.29 – – 18.08 0.15 14.49 0.01 1.46 0.33 2.3 STV YSO, non-er 26 VVVv628 15:44:49.54 −54:07:52.08 17.42 0.03 15.30 0.01 13.76 0.01 1.45 -0.51 2.2 Dipper YSO, non-er 27 VVVv630 15:44:56.13 −54:07:03.18 – – 18.83 0.31 15.76 0.04 1.90 2.70 2.2 Eruptive YSO, non-er 28 VVVv631 15:45:18.36 −54:10:36.87 17.39 0.03 15.13 0.01 13.41 0.01 2.63 -0.14 2.3 Eruptive MNor 29 VVVv632 15:44:09.80 −53:56:27.78 14.35 0.01 12.95 0.01 11.87 0.01 1.51 0.29 2.5 STV YSO, non-er 30 VVVv662 16:10:26.82 −51:22:34.13 – – 18.55 0.24 15.30 0.03 1.83 0.81 3.1 Eruptive MNor 31 VVVv665 16:09:57.70 −50:48:09.42 – – 16.57 0.04 14.09 0.01 1.63 0.95 4.3 Eruptive MNor
32 VVVv699 16:23:44.34 −48:54:55.29 – – – – 16.19 0.09 2.28 2.78 4.2 Eruptive MNor
33 VVVv717 16:36:05.56 −46:40:40.61 – – – – 14.37 0.02 2.47 0.81 – LPV-YSO MNor
34 VVVv721 16:39:48.77 −45:48:47.96 18.49 0.16 15.96 0.05 13.98 0.01 1.86 0.87 4.2 Eruptive FUor 35 VVVv796 17:12:07.43 −38:41:26.86 – – 16.87 0.09 12.45 0.01 2.94 1.1 1.4 LPV-Mira AGB 36 VVVv800 17:12:46.04 −38:25:24.63 18.89 0.20 15.80 0.04 12.89 0.01 1.65 1.44 1.4 Eruptive MNor 37 VVVv815 14:26:04.95 −60:41:16.81 19.17 0.16 17.90 0.13 14.94 0.02 1.71 1.58 3.1 Eruptive MNor
objects from the results presented later in this work. Finding charts for these stars are shown in Appendix G.
Fig.1(top) illustrates the distributions inαandKsmagnitude of the spectroscopic sample (whereKsis taken from the first epoch of contemporaneousJHKsdata from 2010). The sample has a fairly wide range inα, though it is composed mainly of class I and flat spectrum systems. This is fairly representative of the photomet-ric YSO sample, especially the eruptive candidates (see Paper I), though the photometric sample does include a slightly higher pro-portion of class II YSOs and a few class III YSO candidates. Fig.1 also shows the VVV near-IR colour–colour diagram (based on con-temporaneous data from 2010) and an Ks−[12] versusH− Ks diagram. Sources that we finally conclude are not YSOs and are colour coded in red (dusty asymptotic giant branch, AGB, vari-ables) or blue (cataclysmic variables, more specifically classical novae). In the bottom panel of Fig.1, we also show fiducial lines for the sequences of carbon and oxygen-rich AGB stars (from van Loon et al.1998). It is interesting to see that VVV objects that are later classified as AGB stars tend to follow the fiducial line of oxygen-rich AGB stars. However, we note that not all oxygen-rich
stars in the sample of van Loon et al. (1998) are observed to follow this line.
Figure 1. (top)αversusKsfor the objects of the VVV spectroscopic
sam-ple. (middle) (H−Ks), (J−H) colour–colour diagram. (bottom)Ks−[12]
versus (H−Ks) for VVV objects. Magnitudes at 12µm are fromWISE
W3 filter. Error bars are only shown for objects with significant errors. In all plots, red squares mark objects that are likely asymptotic giant branch (AGB) stars, whilst blue triangles mark the two objects that are likely novae. The bottom panel shows the fiducial lines for the sequences of carbon-rich (dot–dashed line) and oxygen-rich AGB stars (dashed line, arising from van Loon et al.1998). We note that these lines are based on the IRAS 12µm passband (which is not identical toW3).
The comparison of Fig.2shows that our classification agrees with that of Young et al. (2015). In addition, we can see that the lack of a 70μm detection for some VVV sources does not preclude a YSO classification. For example, for sources with 70μm upper limits, the expected location on the [24]−[70] versusKs−[24] diagram based on the Young et al. (2015) data typically corresponds to 70μm fluxes that fall below the Hi-Gal completeness limit. Finally, we
can also observe that objects that are later considered to be more likely non-YSOs tend to fall in a different area than YSOs. This is especially true for VVVv42, VVVv229, VVVv235 and VVVv796. These four objects are classified as having Mira-like LC in Paper I. For further comparison with the colours of known dusty AGB stars, we refer the reader to van Loon et al. (2010a), van Loon et al. (2010b) and Boyer et al. (2011), though we note that most of the sources described therein have more modest amplitudes (but these works do include also Mira-like pulsators withK>1 mag).
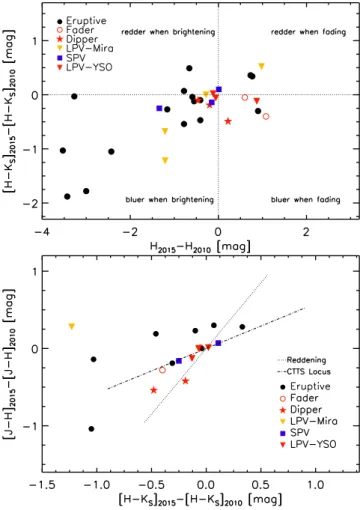
As we did in Paper I for the full sample, we use the two epochs ofJHKsphotometry from VVV in order to study the mechanism driving variability in our sample. Once again, we stress that in most cases, the two epochs do not sample directly the largeKsmagnitude changes in the systems. In addition, we note that 6 objects in our sample are undetected in the Jand Hpassbands in at least one epoch and 20 objects are not detected in theJpassband in at least one epoch. Fig.3shows(H−Ks) versusHand(J−H) versus
(H−Ks) for objects where this is information is available. In the first plot (upper panel), we see that our sample shows an elliptical distribution with its major axis along the redder when fading/bluer when brightening quadrants, consistent with changes being cause either by variable extinction or accretion (Lorenzetti et al.2012). The second plot shows that for sources with significant changes in colour, these changes are generally not consistent with extinction in the majority of the sample. The exception is the objects classified as dippers, for which extinction was already considered to be a more likely explanation for their variability (see Paper I).
3 O B S E RVAT I O N S
3.1 Magellan Baade/FIRE
3.1.1 Low-resolution spectroscopy
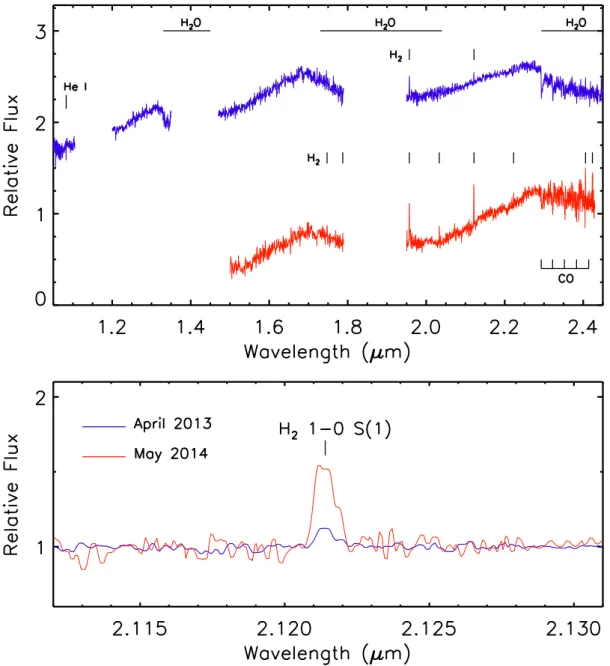
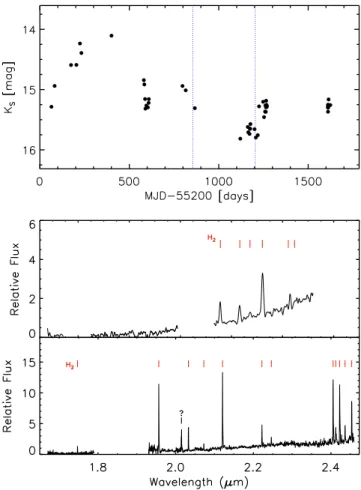
Follow-up of one high-amplitude variable VVVv815 was performed on 2012 May 8 with the FIRE spectrograph mounted on the Mag-ellan Baade Telescope at Las Campanas Observatory, Chile. As detailed in Paper I, VVVv815 was identified via an early search of the VVV time series, with slightly different quality criteria to the rest. The observations were carried out in the high-throughput prism mode which provides a continuous coverage from 0.8 to 2.5μm at low resolving power ofR=λ/λ∼250–350 with a 0.6 arcsec slit. Since the spectrum displayed exceptionally strong H2emission lines (suggesting an accretion-powered outflow), VVVv815 was observed again in echelle mode in a subsequent run allocated to the topic of this paper.
The object was observed in the usual ABBA pattern along the slit, with individual exposures of 148 s and at an airmass of 1.1. Observations of spectroscopic calibrators were carried out for pur-poses of telluric correction and flux calibration; the calibrators were observed at similar airmass as the objects and with the same instru-mental setup. Quartz lamp images were obtained for flat fielding of the data; they consisted of high-voltage (2.2V) images which provide data for thez/Jbands but saturate the red end of the spec-trum and low voltage(1.1 V) which generate counts in H/K but are too faint for the blue end. Additionally, ‘NeNeAr’ arc lamp images were acquired for wavelength calibration.
Figure 2. [24]−[70] versusKs−[24] (left) and [24]−[70] versus [3.6]−[24] (right) colour–colour diagrams for our sample. In the plots, we show likely
YSOs as filled circles and objects which were finally classified as non-YSOs as open circles. Large symbols represent objects with 70µm detections, whilst small symbols with grey arrows represent upper limits. In the figure, we also show the Perseus YSO sample from Young et al. (2015) as plus symbols. The colours for both VVV objects and YSOs from Young et al. mark class I (red), flat-spectrum (orange) and class II (blue) YSOs.
Figure 3. (H−Ks) versusH(top) and(J−H) versus(H−Ks)
(bottom) for objects in the spectroscopic sample with an available second JHKs epoch from VVV. In the plots, we mark the different classes from
LC morphology. Different symbols are explained in the plots. In the bottom plot, we mark the expected changes which occur parallel to the reddening vector (dotted line) and to the classical T Tauri stars locus of Meyer, Calvet & Hillenbrand (1997) (dot–dashed line).
weighting function spread over∼150 pixels centred on a transition pixel defined by the user. Finally, the software traces and extracts the spectrum of the object. Telluric correction and flux calibration were performed in the standard mode usingNOAO/TWODSPECpackage inIRAF.
3.1.2 Echelle spectroscopy
All 37 members of the sample were observed in the echellete mode with the FIRE spectrograph mounted on the Magellan Baade Tele-scope at Las Campanas Observatory, Chile. The echellete mode provides coverage from 0.8–2.5μm using echelle grating orders 11–32, at a resolving power ofR∼6000 with a 0.6 arcsec slit. The spatial scale is 0.18 arcsec pixel−1. The bulk of the observations were carried out over a total of three nights, on 2013 April 19 and 2014 May 10 and 11. Thick cloud cover on May 10 restricted us to bright targets but did not otherwise appear to affect the results. Additional data were also taken on the nights of 2015 April 26 and 27 in order to investigate the spectroscopic variability of the sam-ple. Data from the 2015 run are only included here for one source, VVVv25, for which the 2014 data were of insufficient quality for a clear classification. We defer further discussion of the 2015 data set to a future paper that will benefit from additional 2015 VVV time series photometry.
The majority of the variable stars were observed in the typical ABBA pattern along the slit, with individual exposure times be-tween 158 and 260 s and a total time on source of∼10–17 min. Airmasses were in the range 1–1.4. Immediately after observing each object, we observed ThAr lamps for wavelength calibration and F-type and A0 main-sequence stars for relative flux calibration purposes. These were also done in an AB pattern and with exposure times between 10 and 60 s. Sky and ‘Qh’ lamp flats were acquired at the beginning/end of each night to determine the pixel-to-pixel response calibration. Table2shows the date, exposure time and number of exposures for all of the VVV objects.
Table 2. Spectroscopic observations of VVV objects.
Object R Texp(s) Airmass Nexp Date
VVVv20 6000 253.6 1.4 4 2014 May 11
VVVv25 6000 253.6 1.2 4 2015 April 27
VVVv32 6000 253.6 1.2 8 2014 May 10
VVVv42 6000 253.6 1.4 4 2013 April 22
VVVv45 6000 253.6 1.2 4 2013 April 22
VVVv63 6000 253.6 1.4 4 2014 May 11
VVVv65 6000 158.5 1.3 4 2014 May 11
VVVv94 6000 253.6 1.2 4 2014 May 10
VVVv118 6000 253.6 1.2 4 2013 April 22
VVVv193 6000 158.5 1.1 4 2014 May 11
VVVv202 6000 158.5 1.1 2 2014 May 11
VVVv229 6000 158.5 1.1 4 2013 April 22
VVVv235 6000 158.5 1.1 2 2014 May 11
VVVv240 6000 253.6 1.2 4 2014 May 10
VVVv270 6000 158.6 1.2 4 2014 May 11
VVVv322 6000 158.5 1.3 4 2014 May 11
VVVv322 6000 253.6 1.1 4 2013 April 22
VVVv374 6000 253.6 1.1 4 2014 May 10
VVVv405 6000 158.5 1.3 4 2014 May 11
VVVv406 6000 158.5 1.4 4 2014 May 11
VVVv452 6000 253.6 1.2 8 2014 May 10
VVVv473 6000 253.6 1.2 4 2013 April 22
VVVv480 6000 253.6 1.25 12 2013 April 22
VVVv514 6000 158.5 1.2 4 2014 May 11
VVVv562 6000 253.6 1.3 4 2014 May 11
VVVv625 6000 158.5 1.2 4 2014 May 11
VVVv628 6000 253.6 1.1 4 2014 May 11
VVVv630 6000 158.5 1.2 4 2014 May 11
VVVv631 6000 253.6 1.1 4 2014 May 10
VVVv632 6000 253.6 1.2 4 2014 May 10
VVVv662 6000 158.5 1.2 4 2014 May 11
VVVv665 6000 158.5 1.1 4 2014 May 11
VVVv699 6000 158.5 1.1 4 2014 May 11
VVVv699 6000 253.6 1.1 4 2013 April 22
VVVv717 6000 253.6 1.1 4 2013 April 22
VVVv721 6000 158.6 1.2 4 2014 May 11
VVVv796 6000 253.6 1.3 4 2014 May ‘0
VVVv800 6000 253.6 1.2 4 2014 May 10
VVVv815 6000 253.6 1.2 4 2013 April 22
VVVv815 300 148 1.3 4 2012 May 8
object in each order. The wavelength solution has errors between 0.04 and 0.4 Å depending on the order.
The profile of the object and background sky residuals are fitted using an iterative procedure, where a non-parametric spline function is used for orders with high signal to noise, whilst a Gaussian profile is assumed for low signal-to-noise orders. It then performs an optimally weighted extraction of the object using the profile determined before.
In the case of the extraction of the telluric calibration stars, the software uses a boxcar extraction as the default, which simply sums the counts of the target within an extraction window of a pre-determined width. We found that the different extraction methods for the object and calibrator yielded odd results for the final spectrum of the object after telluric calibration, i.e. the objects had bluer spectra than expected from their near-IR colours. This problem was solved by using optimal extraction for the telluric calibration stars as well as the science targets.
The software removes intrinsic absorption features of HIfrom the telluric calibration stars following the methods of Vacca, Cushing & Rayner (2003). This procedure is only suitable for A0V stars and it
was used for the telluric calibration stars observed in the 2014 run. In the 2013 run, we observed F-type stars as calibrators because we were not confident that the software would remove HIfeatures from A0V spectra with sufficient precision to allow measurement of HIemission in YSOs, such as the Brγ line. Subsequent testing showed that the pipeline does remove HIfeatures from A0 stars very well, so we reverted to A0 stars in 2014, as recommended in the FIRE manual. For the 11 science targets observed in 2013, intrinsic features from the F-type calibrator were removed for each order by fitting and subtracting them withSPLOTinIRAF.
The final relative flux calibration and merging of individual orders were performed using theONEDSPECtasks,TELLURICandSCOMBINE, respectively.
The reduced and combined FIRE spectra of 37 objects are pre-sented in Appendix F.
4 F I R E S P E C T R A
4.1 General properties
In this section and Section 4.2, we discuss the general spectroscopic characteristics of the sample which confirm most of the variables as YSOs and show that they resemble eruptive systems more than normal class I YSOs. Then, in Section 4.3, we look at how the spec-troscopic characteristics of the confirmed YSOs differ between the different categories of LC, prior to a discussion on how to classify these stars in Section 5. We will present some of the individual spec-tra throughout the remainder of this work. However, we refer the reader to Appendix F in order to inspect the whole sample before reading through these sections.
In Table3, we show the equivalent widths obtained from the atomic and molecular features. Equivalent widths of individual lines are measured usingSPLOTinIRAFwith a Gaussian line profile.
Table 3. Equivalent widths of common features found in the near-IR spectra of YSOs detected in our VVV sample. The EW of CO was measured inSPLOT
by visually selecting two continuum points around the CO bandhead and estimating the continuum as a linear function between the two points. The EW is estimated by summing (1−Fi/Ci) over wavelength, whereFiandCiare the flux and the continuum at pixeli. This inevitably has fairly large errors due to uncertainty in the continuum level, even though the individual transitions are often very clearly detected.
Object H2(2.12µm) Brγ(2.16µm) NaI(2.21µm) CaI(2.26µm) 12CO(2.293µm) MgI(2.28µm)
near-IR continuum is either to rise with increasing wavelength or to be approximately flat, as expected for class I and flat spectrum YSOs or other sources suffering high IR extinction. Three YSOs, VVVv322, VVVv717 and VVV721 havev=2 CO absorption bands at 2.29–2.45μm which appear to be stronger than expected from the photosphere of a K or M dwarf, and are more in line with that expected from the photosphere of late M-type giant stars. In fact, the CO absorption of these three systems is very similar to that of some of our objects which are classified as AGB stars. Such strong CO absorption is characteristic of FUors and FUor-like YSOs (Connelley & Greene2010; Reipurth & Aspin2010). In fact, the latter authors regard it as the defining spectroscopic characteristic,
given the inferred origin in a disc with a high accretion rate (see Section 1). Two of these three sources also display the broad H2O absorption bands often seen in such systems.
We find that 22 of the YSO spectra (79 per cent) show 2.12μm H2emission. Of these, 10 objects also show additional lines from H2. In every case, the emission from this molecule is likely arising from shock-excited emission given that higher excited transitions are usually weak or not present in the spectra. Atomic lines of NaIand CaIare not common in our sample, with three or four objects showing absorption at these wavelengths (11–14 per cent) and emission in five–seven objects (18–25 per cent). When NaIwas observed in emission, CO was usually also in emission (see Table3) following the pattern seen in EXors (see Section 1).
CO emission is observed in 8–11 objects (27–37 per cent). We find that objects which show this characteristic can be fitted by models (see Appendix E) with temperatures between 2500 and 3500 K. This temperature range agrees with that expected to give rise to CO emission in gaseous discs of YSOs (Najita et al.1996). We also find that some objects show the evidence of broadened CO profiles. Rotation in Keplerian discs has been shown to produce this feature (see e.g. Najita et al.1996; Davies et al.2010). Although this needs a more detailed investigation at higher spectral resolution, the observed broadened profile appears consistent with a similar origin in some of our systems.
Brγ is not detected in four YSOs. One of these is VVVv815, an object for which only strong H2 emission is present (see Appendix A). In fact, the 2.12μm line has an equivalent width of EW= −200 Å in 2012 and EW = −119 Å in 2013 which is the largest equivalent width measured for this line across the whole sample. As for VVVv815, VVVv406 also does not show any fea-tures at the wavelength of Brγ, but is also, in general, a featureless spectrum with weak H22.12μm emission. The remaining two ob-jects, VVVv322 and VVVv721, are characterized by having CO absorption and broad H2O absorption bands, with a lack of other photospheric absorption features such as NaIand CaI. These two YSOs are spectroscopically similar to FUors, where CO absorption arises from the accretion disc rather than the stellar photosphere. We discuss later whether an FUor classification is appropriate in each case.
CO absorption is also observed in three objects which also show Brγ emission or absorption. The most interesting of these is VVVv717 (see Appendix A). It has the FUor-like property of very strong CO absorption: in this case, by gas at a fairly low tem-perature (1600 K, see Appendix E). The narrow, relatively weak Brγemission in this object seems to be on top of a broader absorp-tion feature. Brγ emission is not usually detected in FUors as this accretion-sensitive emission line is assumed to be quenched by the very high accretion rate in FUors. VVVv717 also shows weak H2 2.12μm and a marginal detection of MgI2.28μm emission. No other absorption features from a stellar photosphere are observed. The two other objects that show CO absorption are VVVv628 and VVVv630. In both cases, the CO absorption seems to arise from a stellar photosphere, given that other absorption features associated with a stellar photosphere, such as NaIand CaI, are also observed. The temperatures estimated from CO models in Appendix E (3100– 3200 K) are consistent with those expected for the cool upper layers of the stellar photosphere in low-mass YSOs.
Previous spectroscopic studies of YSOs at near-IR wavelengths report the following frequencies for the atomic and molecular fea-tures. In the case of Brγemission, Cooper et al. (2013) finds detec-tion rates of 75 per cent for high-mass YSOs, whilst Carr (1989) and Connelley & Greene (2010) find rates of 71 per cent and 75 per cent, respectively, for low-mass YSOs. 91 per cent of intermediate-mass and Herbig Ae/Be stars in the study of Ishii et al. (2001) show this feature in emission. We note that in all of these studies, the
Figure 4. Comparison of the equivalent widths of NaI+CaIversus12CO
for the VVV spectroscopic sample. Regions marked on the plots are based on the work of Connelley & Greene (2010). Objects marked in red represent objects later classified as members of the eruptive variable class, whilst black symbols mark YSOs found not to be part of this variable class.
samples were composed mostly of embedded sources, though not exclusively in every case.
CO emission is observed in 17 per cent of massive YSOs (Cooper et al. 2013), 20 per cent and 22 per cent for low-mass YSOs (Carr1989; Connelley & Greene2010) and 22 per cent for intermediate-mass and Herbig Ae/Be stars (Ishii et al.2001). For H2 emission, Cooper et al. find rates of 56 per cent (high-mass YSOs), Ishii et al. report 34 per cent for intermediate YSOs, whilst low-mass YSOs are found to show this feature in 25 per cent of the objects of Carr and 42 per cent in the sample of Connelley & Greene.
The detection frequency for Brγ emission in our sample is com-parable to the percentages obtained for low- and high-mass YSOs. In the case of CO emission, our numbers seem to be higher than those reported in previous studies. For H2emission, the detection rate in our sample appears to be significantly higher. H2and CO emission are commonly associated with outburst events. In addi-tion, the absence of photospheric absorption features in most of the YSOs suggests that these are objects with high veiling from hot circum-stellar material. High veiling may be related to a high accretion state (Connelley & Greene2010).
4.2 Eruptive YSOs versus normal YSOs: equivalent width diagrams
In Fig.4, we plot equivalent widths of CO against those of NaI+CaI for the VVV sample. In these plots, we mark the distinct regions defined by Connelley & Greene (2010) in their study of a large sample of class I YSOs (their fig. 5). First, we describe the results for the flux-limited sample of Connelley & Greene (2010).
(i) Region F: objects falling in this area were characterized by showing CO and NaI+CaIemission. Brγ emission is also typical in these sources. Objects from the sample of Connelley & Greene with these characteristics had strong veiling from hot circum-stellar material which they suggested is associated with a high accretion rate.
consistent with origin in the photosphere of a YSO, falling in be-tween the loci of dwarf and giant photospheres as marked by thick lines in the upper panel of Fig.4.
(iii) Region E: objects in this area showed CO absorption in excess of photospheric absorption, as well as a lack of photospheric absorption features. Objects in this area lack Brγ emission. The objects in the sample of Connelley & Greene falling in this region were either FUors or ‘FUor-like’ YSOs, a term commonly used to describe sources which have similar spectra to FUors but lack the photometric evidence for an eruption at present.
The VVV sample is clearly different from that of Connelley & Greene (2010), in that very few of the VVV sample are located in region D, where most normal class I YSOs were found. Instead, the location of the VVV YSOs is more often in the two regions of the upper panel expected for highly variable YSOs undergoing episodic accretion: (1) region F, where objects with high veiling and EXor-like active states of accretion are expected to fall. These objects display Brγemission in addition to shock-excited emission from H2. (2) Region E, where FUors are usually found.
4.3 Spectra and LC categories
We have seen that many of the 28 YSOs in the sample show char-acteristics that point to high states of accretion. In this section, we compare their spectroscopic characteristics to their LC classifica-tion from Paper I and analyse whether the observed variability can be explained by variable accretion or another of the known mecha-nisms in YSOs.
The 28 objects are divided into 4 long-period YSOs, 3 dippers, 1 fader, 3 STV stars and 17 eruptive objects. Unsurprisingly, most of the systems which we regard as bona fide examples of episodic accretion have eruptive LC classifications.
(i) Short-term: the three STV stars, VVVv65, VVVv625 and VVVv632, have lower amplitudes than most of the YSOs in the spectroscopic sample. The spectra of VVVv65 and VVVv625 lack CO emission or absorption features and show weak Brγ emission, with VVVv625 also showing weak H2emission. The spectrum of VVVv632 resembles that of classical T Tauri stars (e.g. TW Hya, see e.g. Vacca & Sandell2011) and shows several absorption features (NaI, CaI, MgI, and AlI) arising from the stellar photosphere. Emis-sion from atomic hydrogen is also present (Brγ, Paβ, Paγ, Paδ), as well as from some H2transitions. Finally, the HeI1.083μm line is also observed, and it exhibits a P Cygni profile, with absorption ex-tending to∼−200 km s−1. This feature suggests the presence of an outflow from the system. Given that clear indicators of a high accre-tion rate are absent and the nature of the LC is a nearly continuous short-term variability, with relatively low amplitudes (≤1.5 mag) for the VVV sample, we consider that the variability in these three objects is likely caused by a different mechanism than variable ac-cretion. We note that the VVVv65 spectrum was not taken during a bright state (and the VVVv625 spectrum may or may not have been) so we may be mistaken in this judgement). However, our main aim here is to identify the YSOs for which the evidence of episodic accretion is reasonably clear.
(ii) Dippers: VVVv628 hasKs=1.45, Brγ and H2emission and absorption features of NaI, CaIand CO with typical equivalent widths for a stellar photosphere. Given the lack of veiling despite observation in a bright state and the nature of the LC, it seems likely that another mechanism than accretion may be driving the variabil-ity in this object. VVVv405 and VVVv406 have larger amplitude Ks (≥2 mag), with the former showing emission from several
transitions of H2, as well as Brγemission. VVVv406, on the other hand, is faint at the epoch of observations and shows a featureless spectrum with weak H2emission. In both cases, the two epochs of near-IR variability are taken at similarKsmagnitudes so no infor-mation on colour changes could be derived. CO is not detected in these two objects. It is difficult to establish whether variable ac-cretion is responsible for the variability in these YSOs so for the present, we classify them as non-eruptive.
(iii) Fader: VVVv562 is the only object in this category. Brγ, H2 and 1.64μm [FeII] lines are seen in emission. No CO features are detected but we note that this object was observed when∼2 mag fainter than its maximum brightness. Inspection of ancillary data from 2MASS,WISEandSpitzersupports the idea that the object went into an eruption at some time between 2004 and 2010 and has been on a fading trend since then (see Fig. 5). The colour changes seen between the two epochs ofJHKsphotometry (bluer when fainter) disfavour variable extinction. We note that variations in geometry, such that absorption increases but so does scattered light, can lead to a star becoming bluer at minimum light (an effect sometimes observed in UX Ori stars deep minima due to dust clumps which screen stellar light; see e.g. Herbst & Shevchenko1999). However, in this case, the source faded by only 1.1 mag in H between the two epochs while becoming 0.35 mag bluer inH−Ks, so an unusually bright source of scattered light would be required. We consider it likely that the variability in this object is due to changes in the accretion rate. Note below that this is the first of four YSOs which we classify as an eruptive variable despite the absence of the CO emission or strong CO absorption seen in EXors or FUors, respectively. These indicators are likely to be absent during quiescence and in any case, they may be veiled into invisibility in heavily embedded YSOs, as in OO Ser (Hodapp et al.1996; K´osp´al et al.2007) or GM Cha (G´omez & Mardones2003; Persi et al.2007).
(iv) Long-term periodic: in Paper I, we discuss the possible mech-anisms which can drive periodic variability (P>100 d) in YSOs. One of these mechanisms can be variable accretion, which has been invoked to explain the variability in e.g. V371 Ser (where accretion is modulated by a binary companion, see Hodapp et al.2012). It is very interesting to see that three-fourth YSOs with the long-term periodic classification show characteristics of objects in high states of accretion. VVVv32 and VVVv473 show Brγ and CO emission, the latter also showing several transitions of H2. VVVv717 shows deep CO absorption with a lack of other absorption features and additional weak H2and Brγemission (this object is analysed with more detail in Appendix A). It is very likely that variable accretion is the driving mechanism for these three objects, which were all observed in a bright state. Finally, VVVv480 shows only weak Brγ emission. It is difficult to establish whether this object was observed at a faint or a bright state, so the absence of the evidence for a high accretion rate might be due to observation in quiescence, but by default, we place this YSO in the non-eruptive category. The two epochs ofJHKsphotometry have very similar fluxes for this source and therefore provide no information on colour changes.
Figure 5. Near- and mid-IR photometry (top) and near-IR spectra (bottom) for objects VVVv562 (left) and VVVv630 (right). Green arrows mark the epoch of spectroscopy. The photometry from different surveys is marked by different symbols which are labelled in each plot. Different emission/absorption lines are also marked in the spectra of the objects. VVVv562 is a fader-observed 2 mag below-peak brightness which we regard as a likely eruptive variable. VVVv630 has an ‘eruptive’ LC and was observed in a bright state but we consider that extinction is a more likely cause of the variability given the detection of absorption lines from the stellar photosphere, coupled with colour–magnitude variations along the reddening vector in the two epochs ofHandKsphotometry.
(but H2is clearly present). The accretion luminosity derived for this source does not support a high state of accretion (see Section 5.2) despite observation at an intermediate state. Finally, the variability in VVVv630 is more likely related to extinction events. The near-IR colour comparison shows that the object becomes bluer when brightening, following the reddening line (although this comes from theHversus (H−Ks) diagram only). The VVV LC resembles that of an eruptive object, with the spectrum being taken during the suspected bright state. However, the object shows photospheric ab-sorption from CO, NaIand CaI, with weak Brγ emission. This contradicts the expected behaviour from an eruption. 2MASS data shows that the object had a similarKsmagnitude in the bright state to that seen in 1999 (see Fig.5). It is possible that VVVv630 went through a dust obscuration event which had cleared at the time of the observations.
5 A N A LY S I S A N D C L A S S I F I C AT I O N
From 28 likely YSOs, we have seen that 9 are likely not part of the eruptive variable class (3 short-term, 3 dippers, 1 LPV-YSO and 2 eruptive). The remaining 19 VVV objects show characteristics of eruptive variables from their spectra and/or LC. But to which of the known subclasses of eruptive variables do these objects belong?
In the classical definition, during outburst, FUors show strong CO absorption at 2.29μm with H2O absorption sometimes present in their near-IR spectrum (Reipurth & Aspin2010), whilst EXors
show strong Brγ in emission, with CO bands also in emission and veiling of photospheric features (Lorenzetti et al.2009). By just considering spectroscopic features, we could easily classify objects in region F of the equivalent width plots discussed above as EXors, with objects falling in region E as FUors. However, the duration of the outbursts is one of the main characteristics used in the classification of eruptive variables. FU Orionis stars show outbursts lasting over>10 yr with a minimum time-scale of several thousand years for repeat eruptions (Scholz, Froebrich & Wood2013), whilst EXors have recurrent short-lived (<1 yr) outbursts and quiescent periods of 5–10 yr (see e.g. Hartmann & Kenyon 1996; Fedele et al.2007; Lorenzetti et al.2009).
A second problem with the classical definition is that it was defined at optical wavelengths. This has struggled to include some intermediate objects and excludes younger protostars which have higher accretion rates but are too deeply embedded in circum-stellar matter to be observed in the optical, such as in the cases of OO Ser, V2775 Ori, HOPS 383 and GM Cha (Hodapp et al.1996; K´osp´al et al.2007; Persi et al.2007; Caratti o Garatti et al.2011; Audard et al.2014; Safron et al.2015) or in the GPS sample of Contreras Pe˜na et al. (2014). Thus, this definition might not apply to our VVV objects given the embedded nature of our sample.
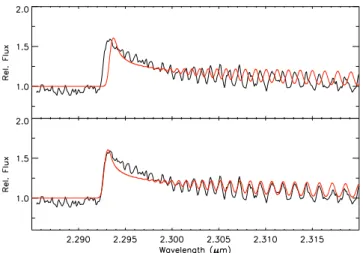
Figure 6. Comparison of the spectrum of VVVv665 (black line) with the CO emission model (red line), without any shifts (top) and after applying the shift derived by the cross-correlation function (bottom).
whilst emission-line objects (usually found in region F of Fig.4) are more likely EXors. In the following, we will study whether emission-line objects are found at high states of accretion, as ex-pected, by determining accretion luminosities from Brγ emission. Finally, we will discuss individual examples which demonstrate that the classical definition of eruptive variables fails to classify our VVV sample.
5.1 Radial velocities
We estimate radial velocities of objects showing CO emis-sion/absorption by using the cross-correlation technique described in Marocco et al. (2015), taking the simple CO models which will be explained later in Appendix E, as the radial velocity templates. In every case, the velocities are corrected to take into account the Earth rotation, its motion around the Sun and the motion with respect to the local standard of rest (LSR). The errors on radial velocity are dominated, in most cases, by the error in the wavelength calibration at the order where the CO region is observed. This error is∼0.4 Å which translates into an error of∼5.2 km s−1on radial velocity.
These estimates give us a more reliable measurement of the dis-tance to the objects which can help us determine accretion lumi-nosities for some of the emission-line stars. It also helps to identify likely AGB variable stars (see Appendix C).
Note that we are assuming that the CO-emitting region has a similar average velocity to the star. The measurement could be affected if the CO emission/absorption arises from an outflow or wind with a different velocity but in most YSOs, the CO arises in the rotating disc or the stellar photosphere.
In Fig.6, we show a comparison of the observed spectrum of VVVv665 and that of the CO model before and after deriving the radial velocities for the object. In Table4, we show the estimated values and errors for the objects where we were able to use this method. In Table 4, we also show the near- and far-kinematics distances estimated using the Galactic rotation model of Brand & Blitz (1993).
5.2 Accretion luminosities
The majority (16/19) of the eruptive VVV objects show emission-line spectra, which is one of the expected characteristics of EXors during outburst. This is not surprising given that only a 2 yr time
Table 4. Radial velocities.
VVVv193 −85.5 18.2 4.5 10.2
VVVv202 −84.2 5.2 4.4 10.5
VVVv229 −69.9 5.5 3.8 11.4
VVVv235 −92.8 5.2 4.8 10.6
VVVv270 −87.6 12.1 4.6 11.2
VVVv322 −59.8 5.5 3.8 12.7
VVVv628 −41.6 5.9 2.4 12.3
VVVv630 −32.9 5.9 1.9 12.8
VVVv665 −73.1 5.3 4.0 11.6
VVVv699 −93.5 5.3 4.9 11.0
VVVv717 −126.3 5.3 6.1 10.2
VVVv721 −89.7 5.8 4.9 11.5
VVVv796 −68.7 5.3 5.1 12.1
interval of VVV data (2010–2012) was used for our variable search (see Paper I), which would favour the detections of EXors over FUors.
From 16 objects with emission-line spectra, 15 show Brγ emis-sion, the exception being VVVv815. This source was observed well below maximum light and the spectrum shows very strong H2 emis-sion, implying the presence of a powerful accretion-driven outflow (see Appendix A). The majority of the emission-line objects fall in region F of Fig.4and are thus characterized by the lack of pho-tospheric absorption lines. CO bandhead lines in emission and/or H2lines in emission are also seen in most of these objects. The ob-jects with Brγemission are characterized by having broad emission profiles with full width at half-maximum>100 km s−1as expected from magnetospheric accretion (see e.g. Davis et al.2001).
In order to study whether these objects are in high states of accre-tion as we expect, we can try to determine the accreaccre-tion luminosity, Lacc, of objects in our sample. The latter is obtained from the known correlation between the Brγluminosity and the accretion luminos-ity in YSOs (see Muzerolle et al.1998; Calvet et al.2004). Then, in principle, ˙Mcan be derived from
Lacc=
Table 5. Accretion luminosity from luminosity of the Brγline. The second column refers to the approximate state (from the LC) at which the spectrum was taken.
Object STATE AKs D Lacca Laccb
(mag) (kpc) (L) (L) Eruptive
VVVv20 bright 2.3 2.5c 3.8 15.1
VVVv32 mid-point 0.9 1.9d 0.9 2.2
VVVv94 bright 2.5 3.5e 11.1 68.2
VVVv118 faint 0.5 2.2c 0.1 0.1
VVVv193 bright 2.5 4.5d 3.2 11.9
VVVv270 bright 2.5 4.6d 7.3 38.1
VVVv374 bright 2.5 2.9e 5.3 24
VVVv452 bright 1.4 2.8c 2.5 8.4
VVVv473 mid-point? 2.5 3.7e 0.6 1.1
VVVv562 faint 1.4 2.9e 0.4 0.6
VVVv631 bright 1.2 2.3e 2.5 8.4
VVVv662 bright 2.5 3.1e 3.2 11.7
VVVv665 bright 2.5 4.3d 6.6 33.2
VVVv699 bright? 32f 4.9d 7.4 38.9
VVVv699 bright? 2.5 4.9d 3.7 14.5
VVVv800 mid-point? 2.4 1.4e 0.7 1.4
Non-eruptive
VVVv63 mid-point 1.7 3.5e 0.6 1.1
VVVv65 faint 1.9 3.5e 0.8 1.8
VVVv405 faint 2.5 2.3e 0.2 0.2
VVVv480 faint 0 3.7e 0.2 0.3
VVVv625 bright? 2.5 2.3e 1.5 4.2
VVVv628 mid-point 1.1 2.3d 0.1 0.1
VVVv632 bright 0.3 2.5e 0.6 1.0
afrom Calvet et al. (2004).
vfrom line ratios, see Appendix A.
Given the above, ˙M can only be estimated by making many assumptions on the star+disc parameters, thus yielding unreliable results. We have shown in Paper I that some of our high-amplitude sample includes some PMS eclipsing binaries. Some of these have spectral indices of flat spectrum sources. Follow-up of these sys-tems could provide information on radii and masses for these younger sources, provided the contribution of scattered light can be accounted for.
For the accretion luminosities, we first need to determine the flux of the Brγline. We note that several assumptions are made during the derivation of this parameter. First, we do not haveKsphotometry from the time of the spectroscopic observations. Thus, we assume Ksas the magnitude of the closest epoch from the VVV photometry. From this, we obtain the continuum level,Fλ, for the Brγ line at 2.1659μm. In addition, we correct this value for the extinction along the line of sight to the source. This introduces further uncertainties given the difficulties in measuring accurate values of extinction towards class I YSOs. These objects have substantial contributions from scattered light that may cause the reddening and hence the line luminosity, to be underestimated (see e.g. Muzerolle et al.1998; Connelley & Greene2010). We measureAKsby dereddening the sources to the classical T Tauri locus in theJ−HversusH−K two-colour diagram (see Fig.1) and we present this in Table5as Av using the extinction law of Rieke & Lebofsky (1985). For the
nine sources that were not detected in theJfilter, we adopt a colour J−H=3.5 orAv=23 and deredden them to the red end of the T Tauri locus. This is consistent with the redH−Kcolours of these systems and the upper limits onJ−H, which are typically between 2 and 4 mag.
The line flux,FBrγ, is then estimated from
FBrγ =Fλ×EW×100.4Aλ, (2)
withAλfrom the above values. The line luminosity,LBrγ, depends on the distance to the object. In our case, we have distances from (1) the distance to the nearby SFRs at the location of the VVV objects (dSFR), (2) kinematic distances estimated from radial velocities and (3) results from the SED fitting tool (see Appendix D). For the calculation ofLBrγ, we use the best estimate available for the object: in order of preference, we use the kinematic distance (dnear), then
dSFR, then the distance from SED fits.
Finally, the accretion luminosity is calculated from theLacc–LBrγ relations of Calvet et al. (2004) (their equation 3) and of Muzerolle et al. (1998) (their equation 2). Calvet et al. (2004) deriveLaccfrom UV excess for a sample of intermediate-mass T Tauri stars (1.5– 4 M), whilst Muzerolle et al. (1998) use a similar method for a sample of lower mass classical T Tauri stars. Thus, the former relation is likely to be more suitable for objects in our sample. Table5shows the values forLaccobtained from both relations.
We can compare our results to the published luminosities for three different sample sets of class I and class II YSOs: (A) the intermediate-mass class II sample of Calvet et al. (2004) and the low-mass class II sample of Muzerolle et al. (1998); (B) low-mass class I and class II YSOs found in the literature. These are class I objects in Muzerolle et al. (1998), class I and class II YSOs in the Chamaeleon I and Chamaeleon II clouds (Antoniucci et al.2011) and class I YSOs HH26 IRS, HH34 IRS and HH46 IRS (Antoniucci et al.2008); (C) finally, we compare to eruptive variables EX Lupi (2008 outburst; Aspin et al.2010) and V1647 Ori (in quiescence and outburst, 2006–2008; Acosta-Pulido et al.2007).
We note that we could try to compareLacc for these samples directly. However, the results of this comparison would strongly depend on the relation used in estimatingLacc. Moreover,Lacc is derived independently (from UV excess) only in the class II samples of Calvet et al. (2004) and Muzerolle et al. (1998). The published accretion luminosities of objects in (B) and (C) are calculated from line luminosities using either the Calvet et al. or the Muzerolle et al. relations.
Instead, we compare Brγ luminosities which, given the corre-lation with Lacc, gives us a measure of the accretion state of our sample compared with that of typical class I and class II YSOs. The comparison is shown in Fig.7. From the figure, we first notice that VVV objects which are classified as eruptive and observed during bright states have higher Brγluminosities than the remainder of the sample. Brγluminosities from bright eruptive VVV YSOs are also higher than the majority of intermediate-mass class II YSO as well as low-mass class I and class II YSOs. Unfortunately, we are not able to find published Brγluminosities for intermediate-mass class I YSOs.
Figure 7. Histogram of Brγluminosities for VVV objects and a sample of YSOs found in the literature (top) Comparison of eruptive VVV objects observed at bright state (red solid line) with eruptive objects observed at faint states (black solid line) and non-eruptive VVV YSOs (dashed black line). (bottom) Comparison of VVV bright objects (solid red line) with the intermediate-mass class II YSO sample of Calvet et al. (2004) (solid grey line) and the low-mass class II YSO sample of Muzerolle et al. (1998) (dashed black line), low-mass class I YSOs found in the literature (solid black line). We also compare with eruptive variables EX Lupi during outburst (green arrow) and V1647 Ori during quiescence (blue arrow) and outburst (red arrow).
Table5). This is a further evidence to support our contention that we have identified embedded eruptive variable YSOs similar to the small number of such objects found previously, though a little more luminous on average.
We can estimate a range of values of accretion rates for erup-tive objects observed at bright states (open red circles in Fig.7), by adopting plausible values of mass and radius, M∗=3 M, R∗=5 Rand assuming Rin R∗. We stress that this is done for a simple comparison with expected rates in eruptive variables and should not be considered as reliable results. Using the accretion luminosities estimated from the Calvet et al. (2004) relation yields
10−6.8<M <˙ 10−6.2M
yr−1. Even allowing for a possible order of magnitude underestimate, these values would be considered at the lower end of accretion rates expected in FUor outbursts (10−3– 10−6M
yr−1) and more in line with those seen in nearby low-mass EXor outbursts (10−6–10−8M
yr−1; see Audard et al.2014). This may suggest that the Brγ emitters in our sample have lower ac-cretion rates than FUors, which is perhaps to be expected if FUors typically quench Brγ emission above a certain accretion rate. (We note that our sample does include three sources with FUor-like spectra and no Brγ emission.) Nevertheless, the accretion rates of the Brγ emitters are higher than those estimated from SED fitting (Appendix D). This may be attributed either to the fact that SED fitting used 2010 photometry, an epoch were most of the eruptive
objects are found at quiescent states, whereas the spectra were taken at epochs close to maximum brightness, thus at higher states of ac-cretion. Alternatively, the difference might be due to the fact that the SED fitting tool was not designed to model YSOs undergo-ing an eruption (see also the discussion about the reliability of the estimated parameters in Appendix D).
We note that values ofLaccin our sample tend to be lower than the bolometric luminosities (Lbol) derived from SED fits (by∼1 order of magnitude, specially when comparing the values obtained from the Muzerolle et al. relation, see Appendix D). This is some-what surprising as we might expect that the accretion luminosity dominates the total luminosity in eruptive variables: it is often as-sumed that in low-mass class I objectsLacc=Lbol(see e.g Enoch et al.2009; Evans et al.2009). However, Muzerolle et al. (1998) find that low-mass class I YSOs in their sample showLacc∼0.1Lbol. We also note that our sample are most likely intermediate-mass objects and the central star is expected to contribute an increasing fraction of the total luminosity of the system towards higher masses (Calvet et al.1991); on average,Lacc∝M2(Calvet et al.2004). Although, again this comparison might be affected by the unreliability of the SED fitting tool results (as mentioned above).